The January rout has shown this years hand early. Most have been punched in the face and are now bloody and bruised. The two day bounce in equities has provided momentary respite however, I believe it may be short lived. The supply waiting for the current dip buyers is enormous, and it will further shock the uneasy hands to the sidelines.
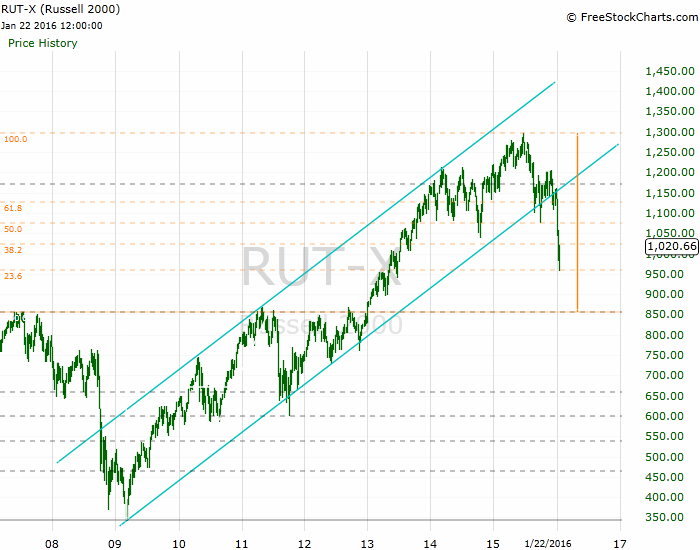
First up, the Russel 2000; while technically a work of art, it has been a great way to gauge the market. The target is the 2007 top around $850. The current dead-cat bounce we’re experiencing should not go above $1077 or I am wrong. More likely it will reverse around $1040, then head lower to $850, which is -16.7% from current levels:
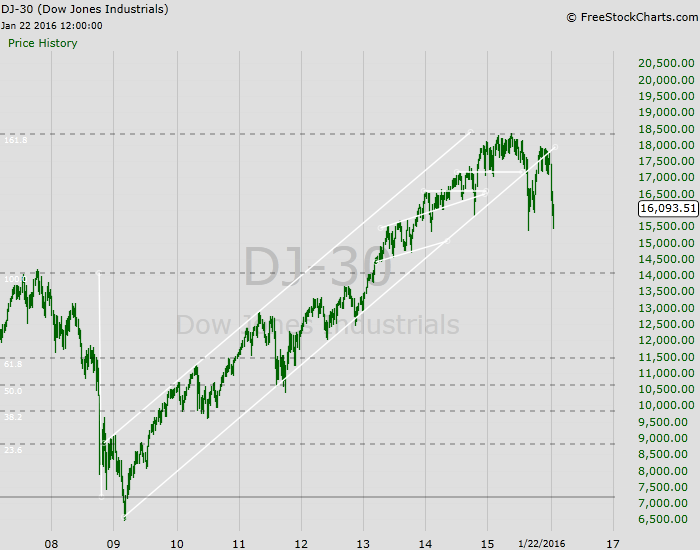
Next, the Dow 30; dust off your “Dow 14,000” hats from 2007 because we are headed back to those levels (a 13% pullback from here). The good news is we will likely bounce from there sometime in Q2:
So the bottom line for equities is this, prepare for the bounce to end and the downtrend to resume. The downside targets are the former 2007 top levels.
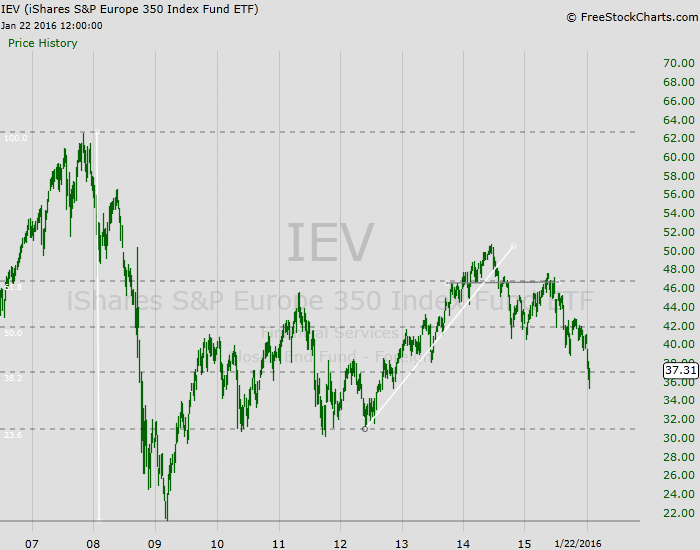
On the bright side however, I believe the rest of the world is more screwed than the US. Take Europe for example; the Europe 350 Index ($IEV) has not been holding up well. Another -17% appears in the cards – somewhere around the $31 level – perhaps more before 2016 is over:
For homework I will refer you to the Japanese Nikkei – talk about ugly. That may be the best short of them all, especially if you enjoy taking on “whatever it takes” Central Bankers.
Now, where it gets trickier is bonds. Could bonds also pull back in the face of an equity correction? I don’t think so, but the zero-boundary for rates is a natural wall – until the Fed changes the playing field again. Refer to the 7-10 Yr. Treasury Bond ($IEF) chart below:
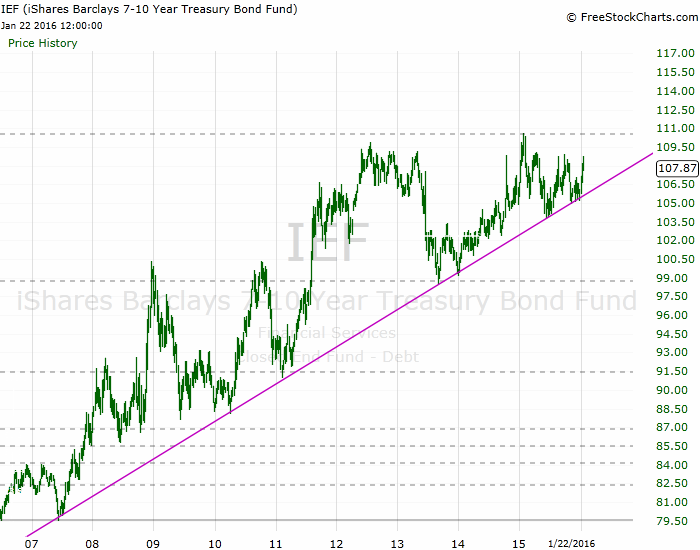
Will that trend line hold, and more importantly, what does it imply about our world if it doesn’t?
Lastly, I will touch on currencies. I first presented the USD/JPY and the EUR/JPY crosses in my article Calling All Degenerate Oil Gamblers!! last December. Some of you thought those levels were apparently too far-fetched to be approached anytime soon…
I’ll therefore leave you with an update to the USD/JPY chart:
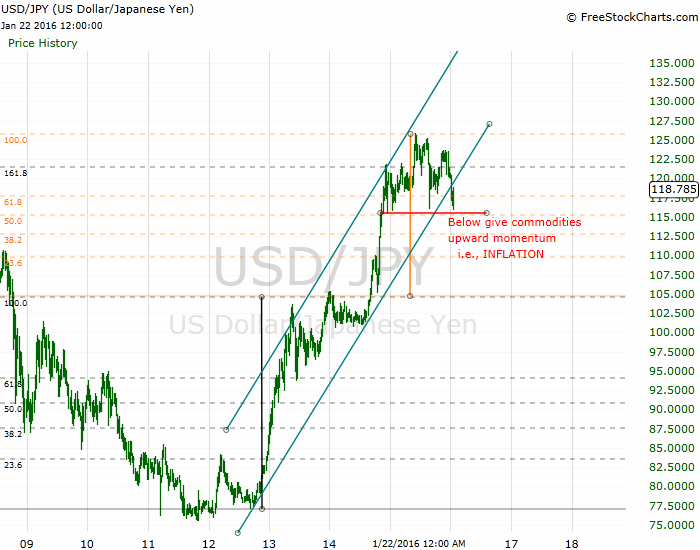
Is the US Dollar rally coming to an end? Or is this simply a healthy pullback? Will the Fed reverse course, causing the dollar to also reverse course – which would trigger my currency levels?
I try to picture a world that the charts are suggesting. For example: equities pulling back to 2007 levels, bonds breaking decade long up-trends, currencies suggesting the US Dollar rally may be over (at least in Yen terms), Europe is screwed, Japan is more-so screwed.
This is all just food for thought at this point. I welcome your thoughts/comments below. Follow me on Twitter @dyer440.
If you enjoy the content at iBankCoin, please follow us on Twitter


Highest regards for the top quality post Dyer440. Simple, direct, clean, & level-headed anaysis.
Thanks probucks.
I will be following up with some actionable trading ideas early this week.
Looking forward to it, thanks dyer440
phenomenal post good sir,
hat tip,….