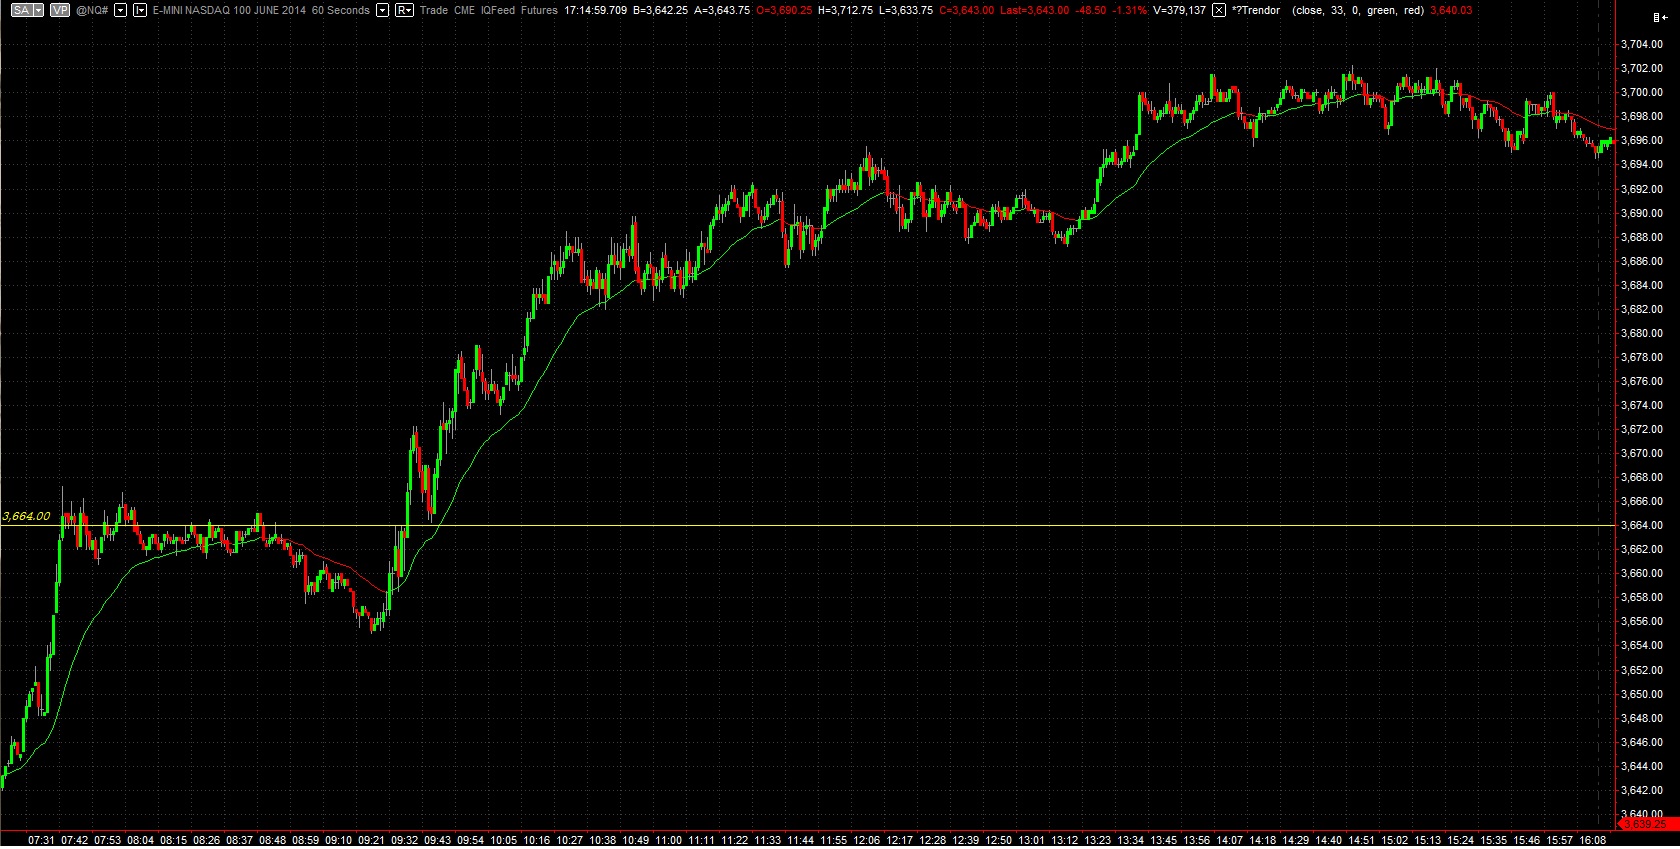
The NASDAQ futures are higher overnight, drifting quietly through the globex session after buyers put together a decent bounce yesterday afternoon. As the USA comes online, prices are currently trading just above the afternoon swing high.
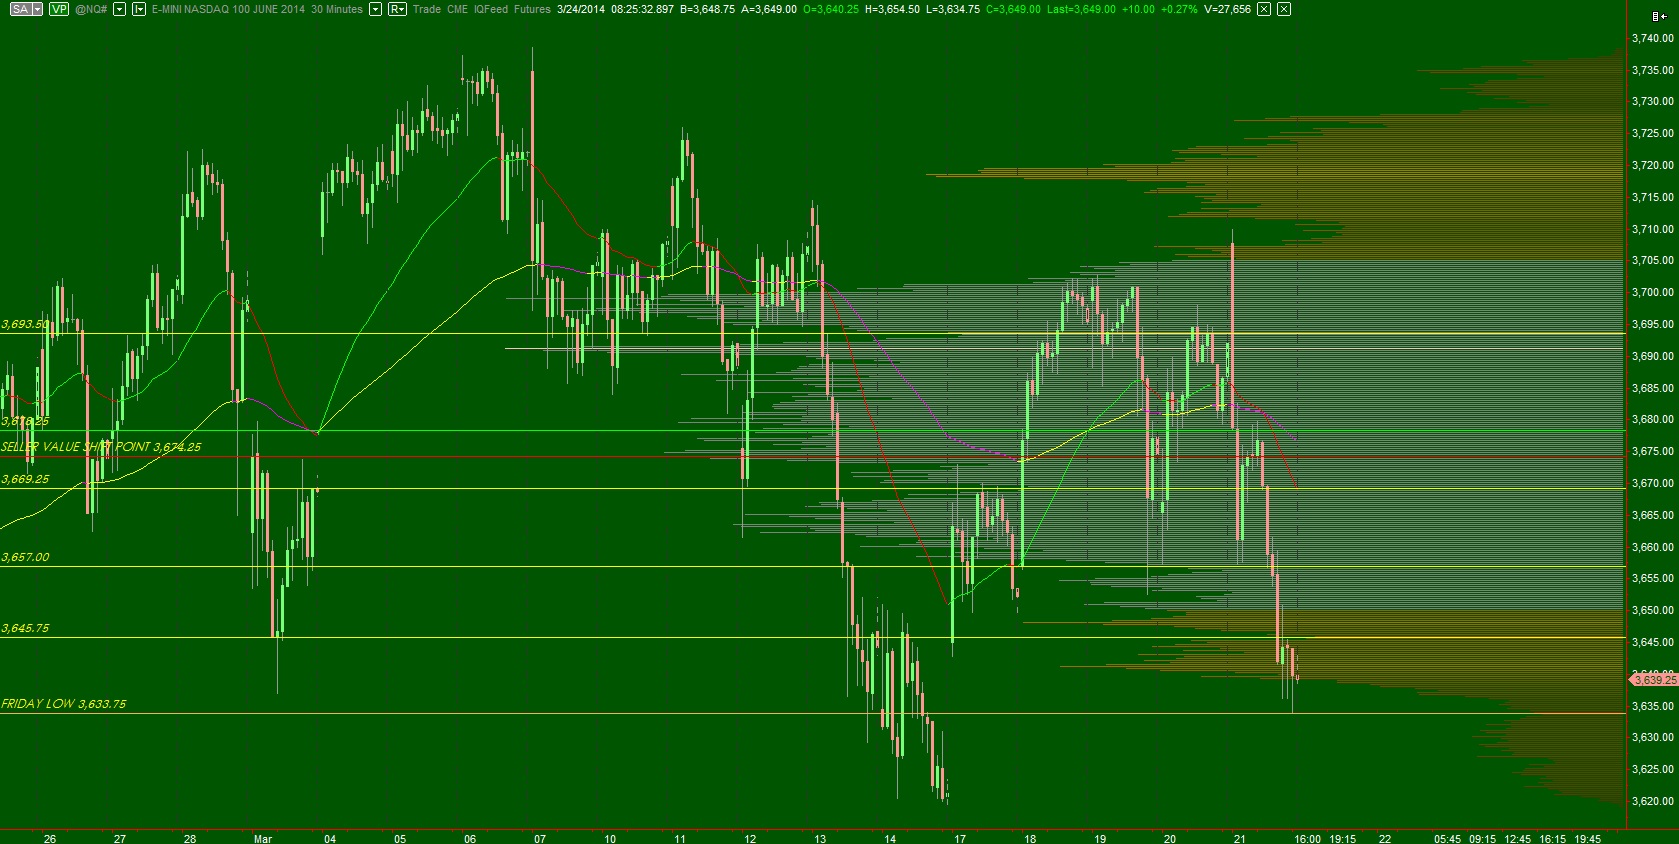
The long term auction taking place in the NASDAQ composite has become an interesting picture. On one hand, the weekly chart is very much still in buyer control. The series of higher highs and lows is still intact. Yet the weekly chart offers us a bit of contex that we continue to watch develop. Three weeks back it printed an outside candle and this week has the potential to confirm it to the downside. Of course, this is very early speculation since we have only seen one trading day, but something to keep in mind nonetheless. The daily chart suggests buyers are still in control but with a more confident seller pressing down below recent support. We have not seen a swing low support broken since late January. In that instance the market quickly V-shape recovered, should one expect the same outcome again?
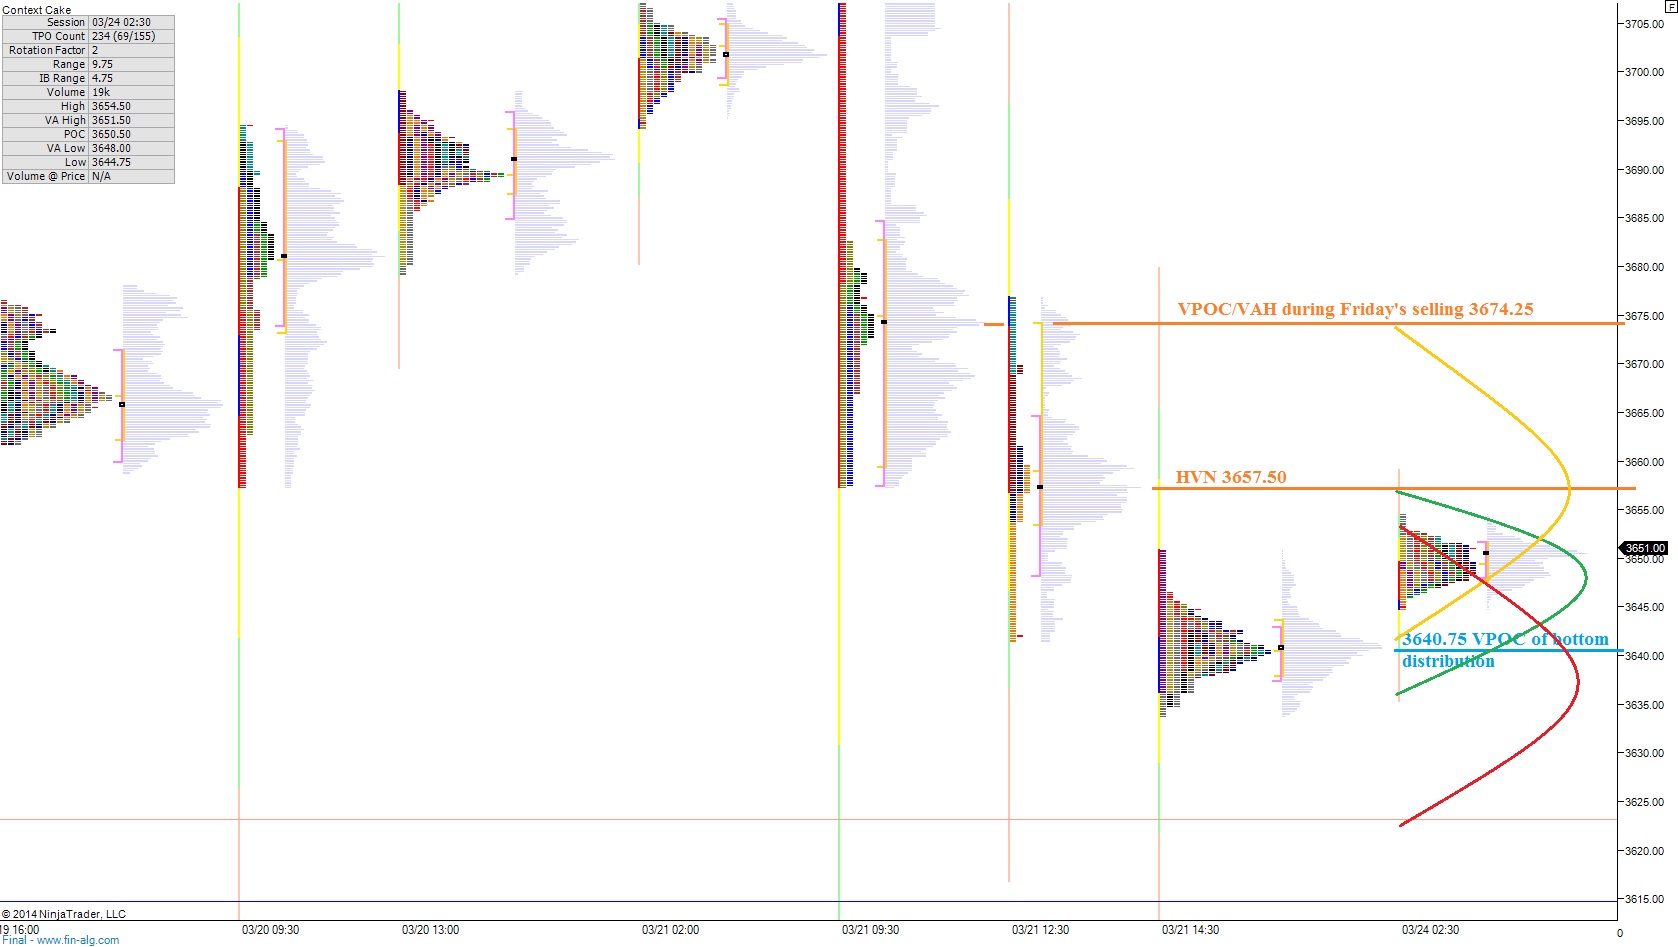
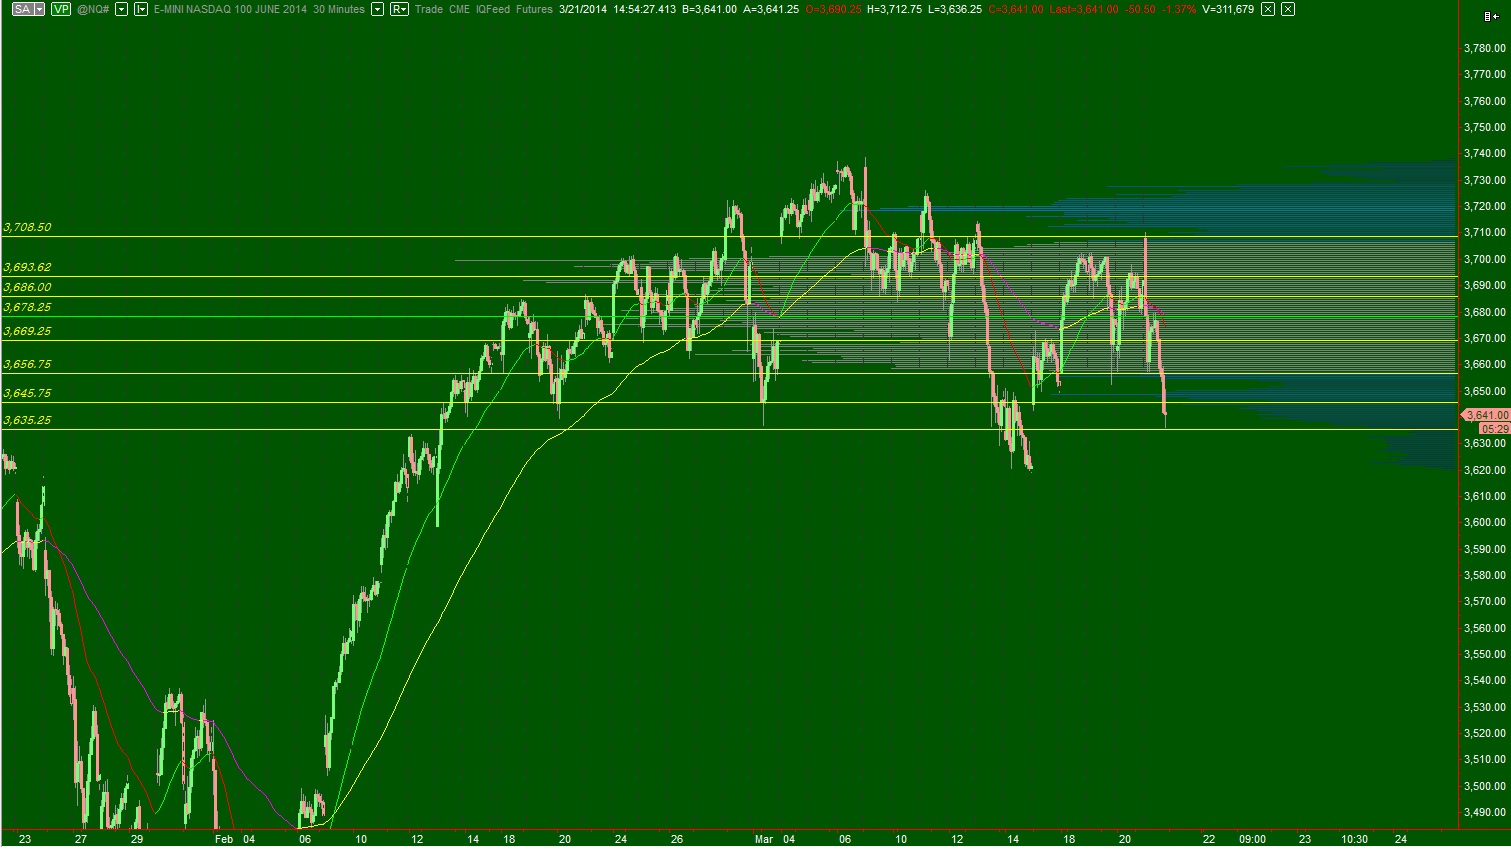
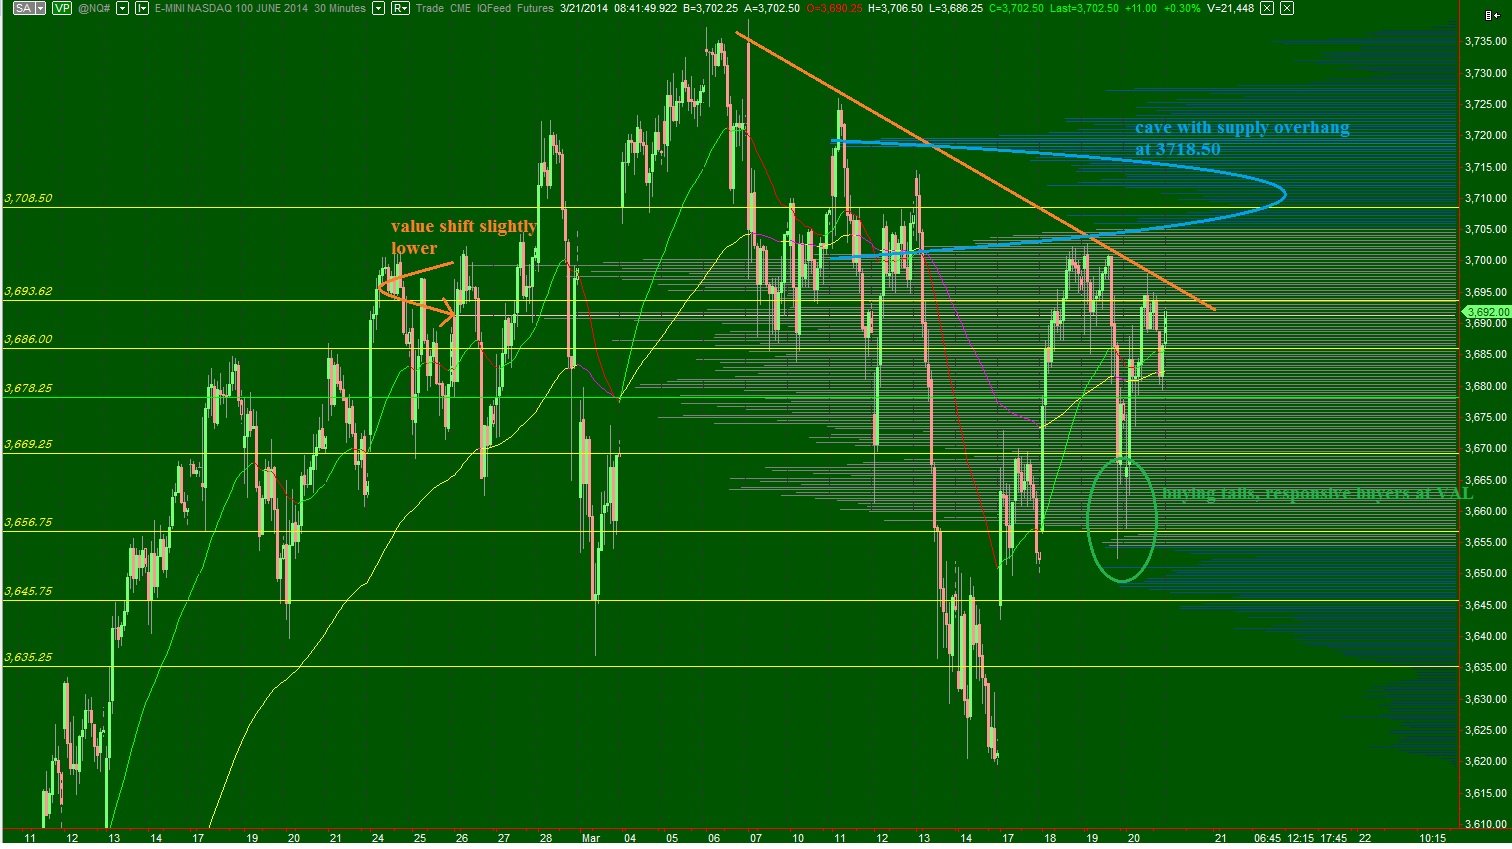
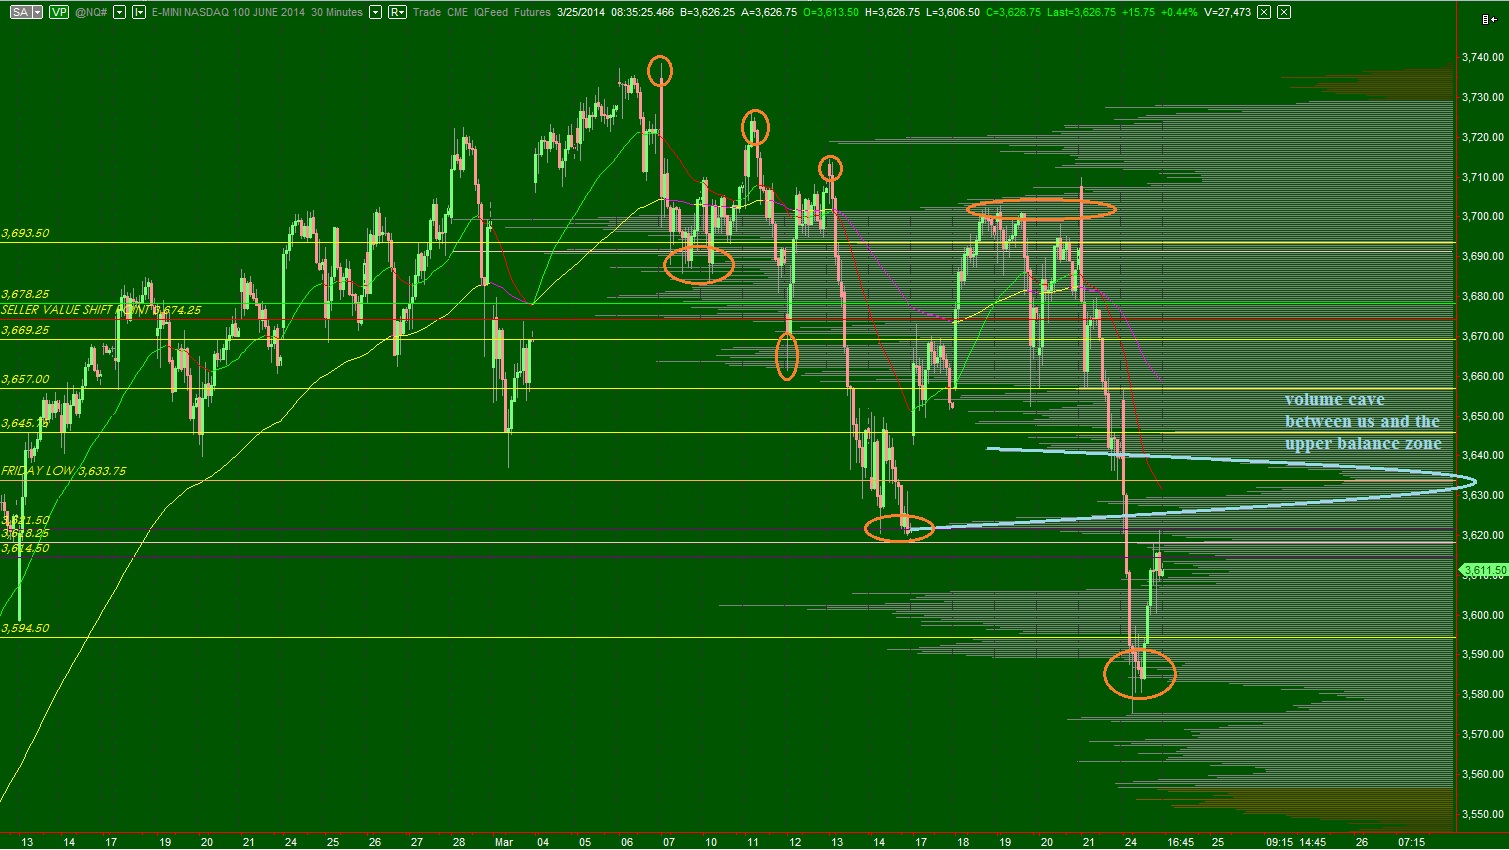
The intermediate term auction is seller controlled. This can be seen as a series of lower highs and lower lows. The sellers also pressed us out of the intermediate term balanced volume profile. There now exists a large void in volume where the lower end of balance once existed. It would not surprise me if price were to traverse this area several times the next time we come to it before the market ultimately decides which side of the cave it wants to trade on. I have highlighted this volume cave and some other interesting observations on the following volume profile chart:
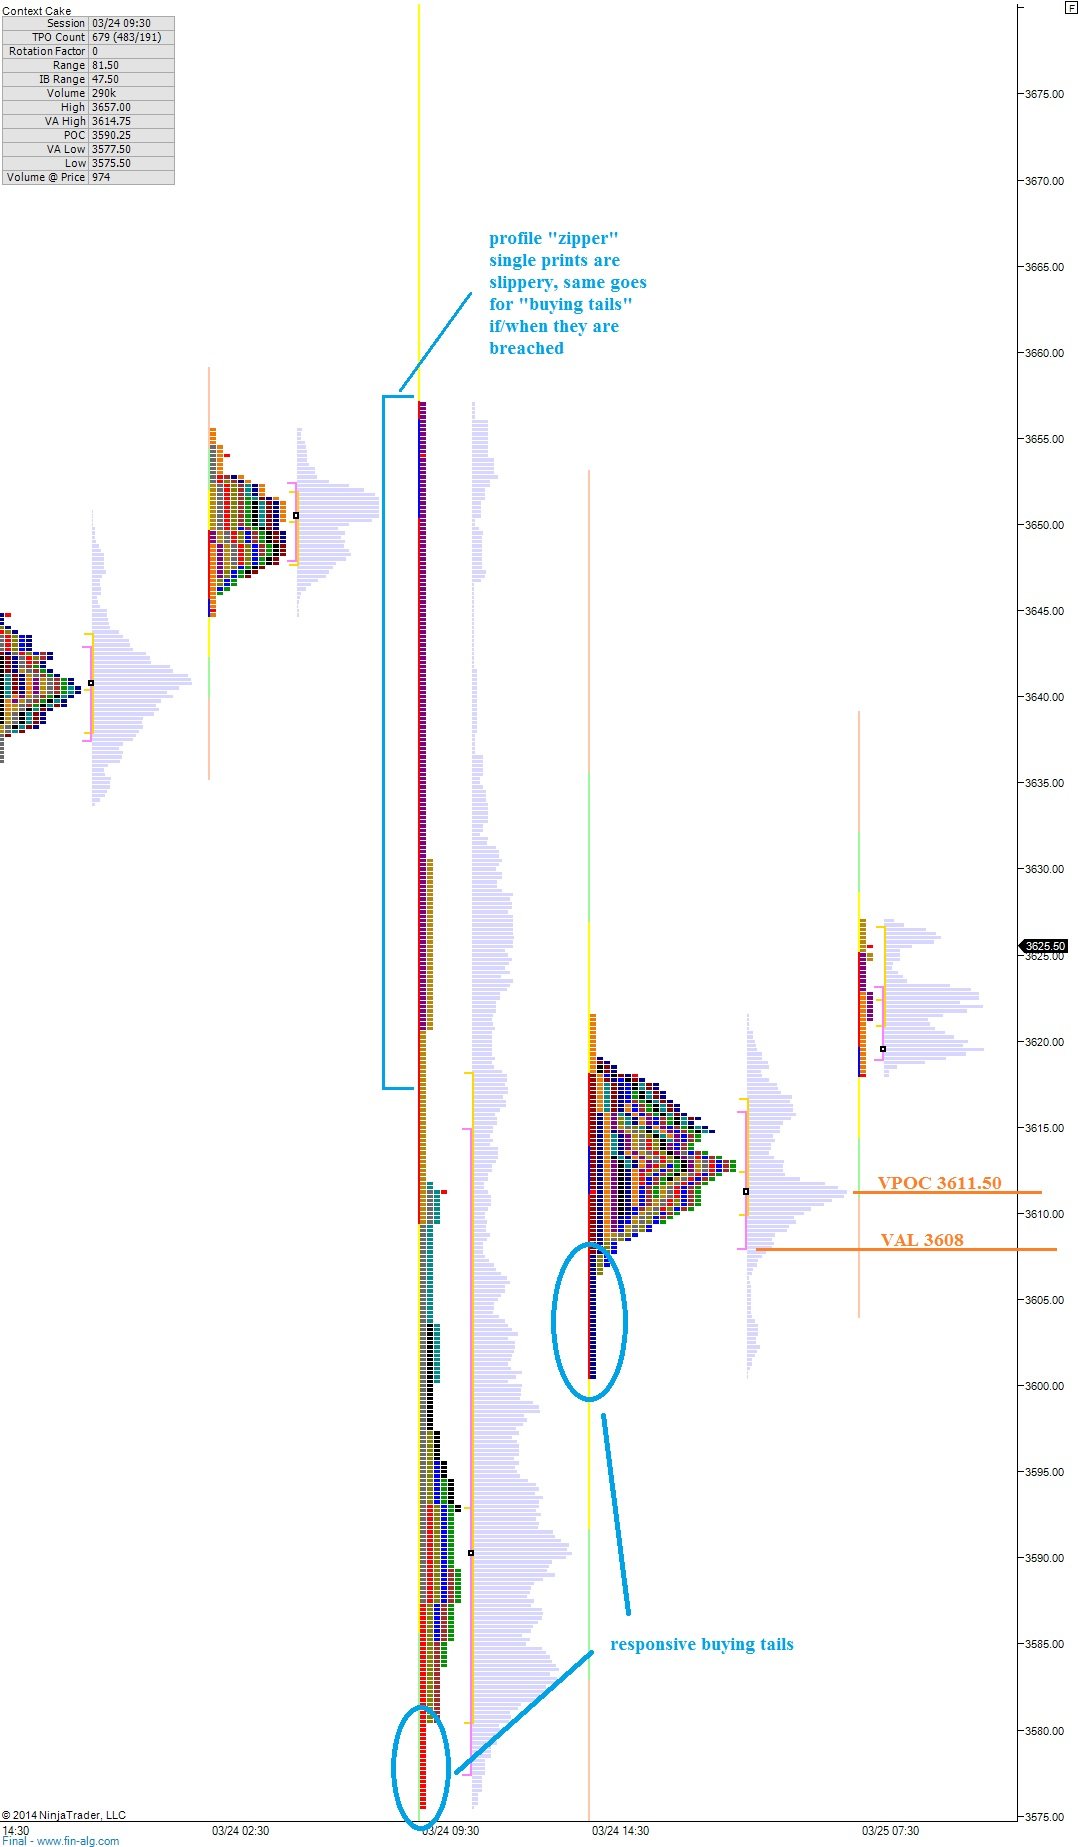
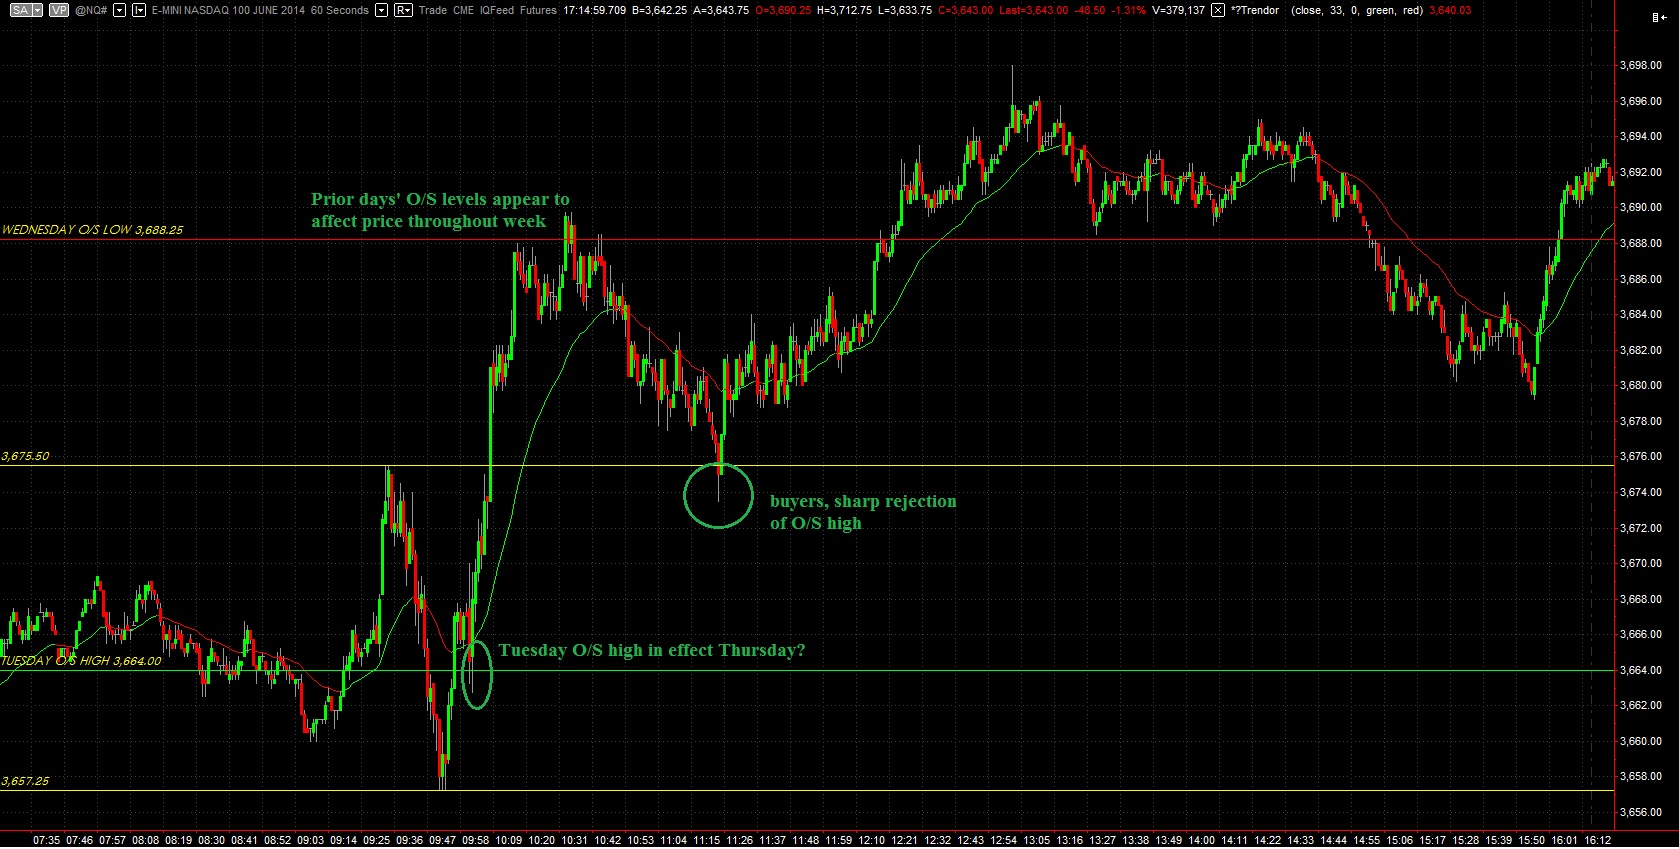
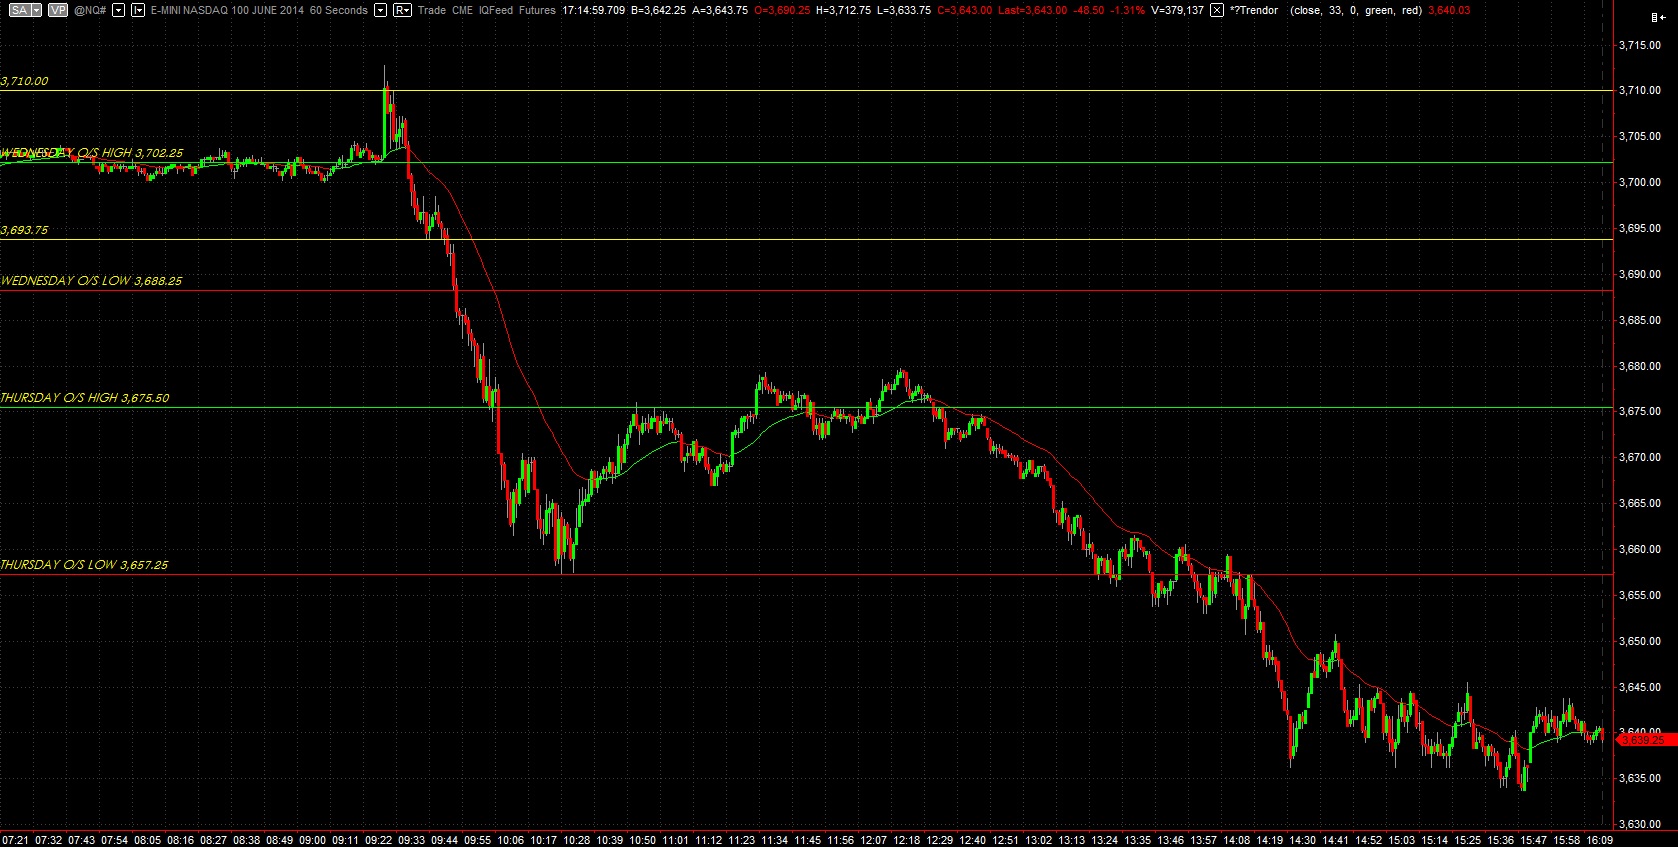
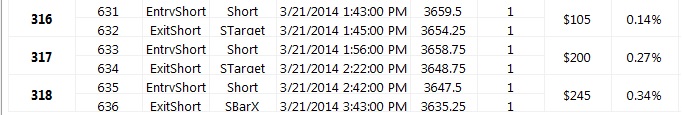
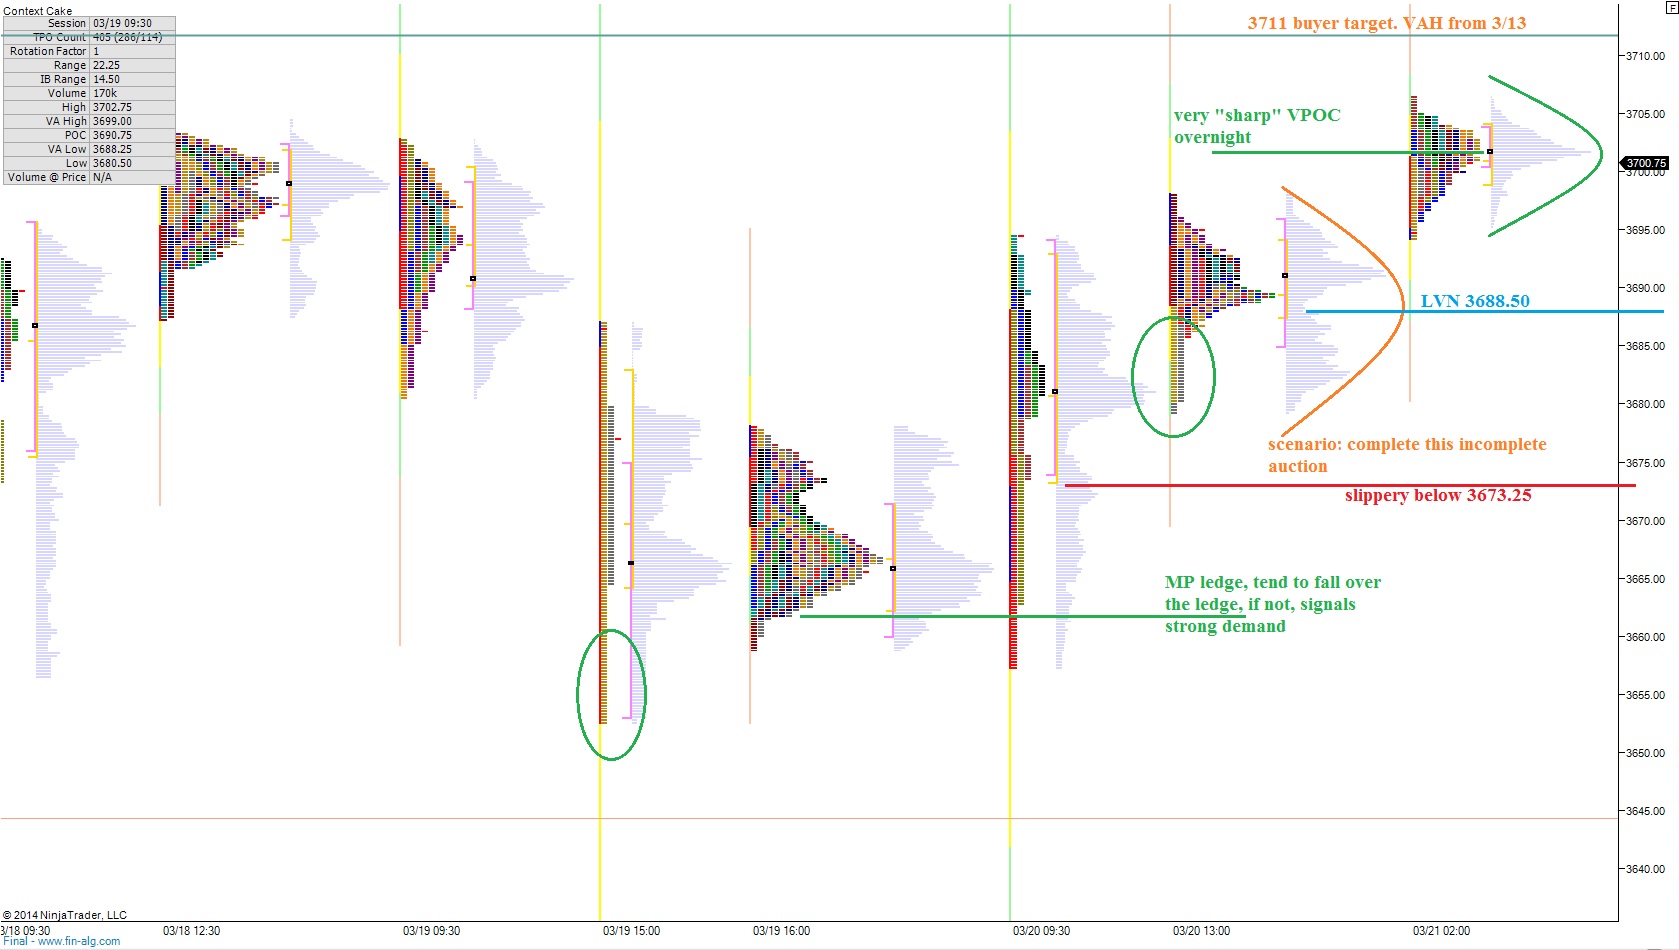
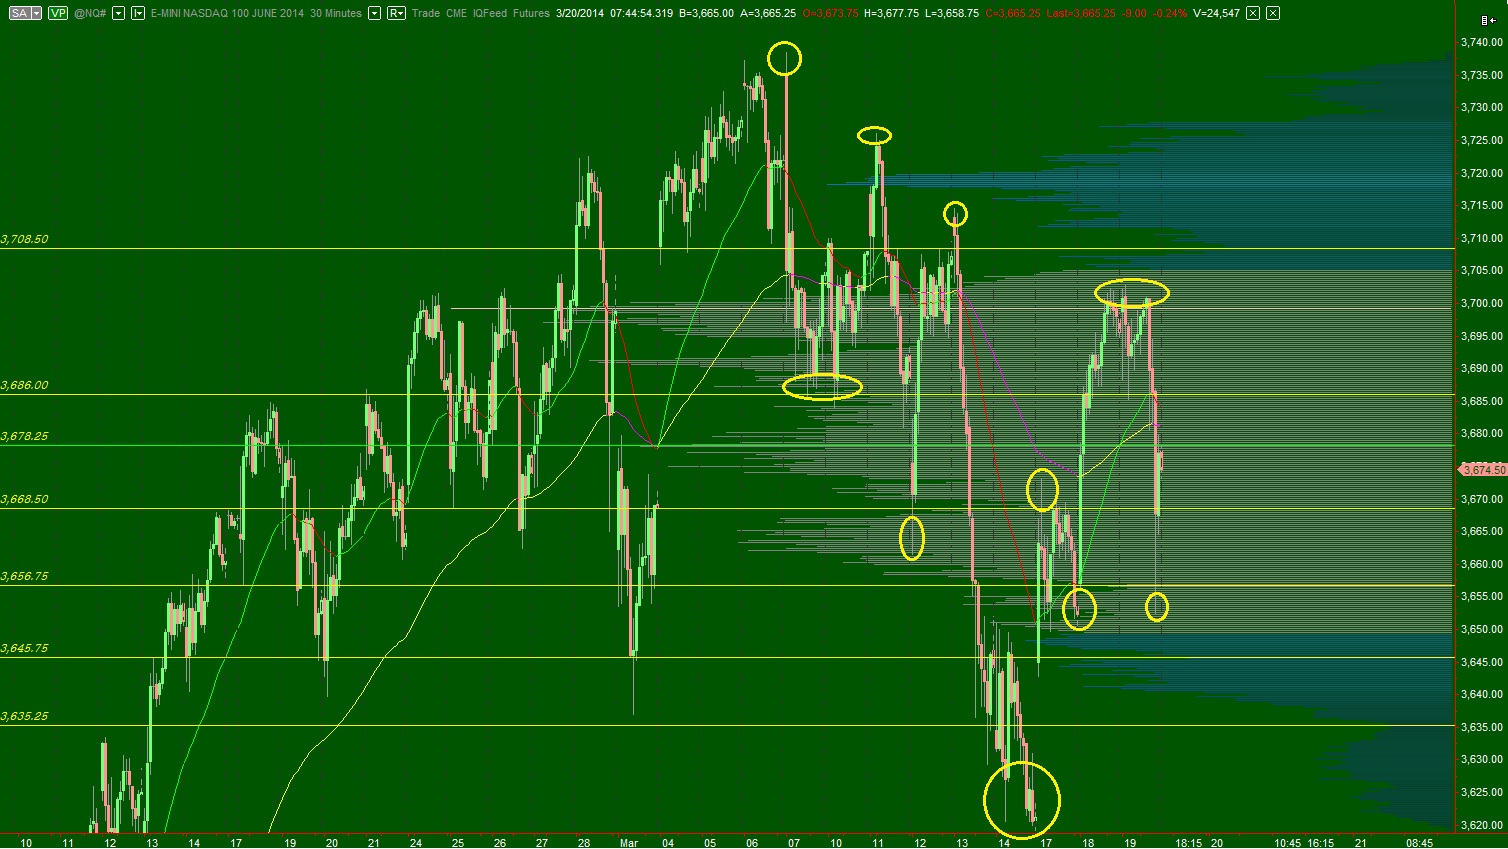
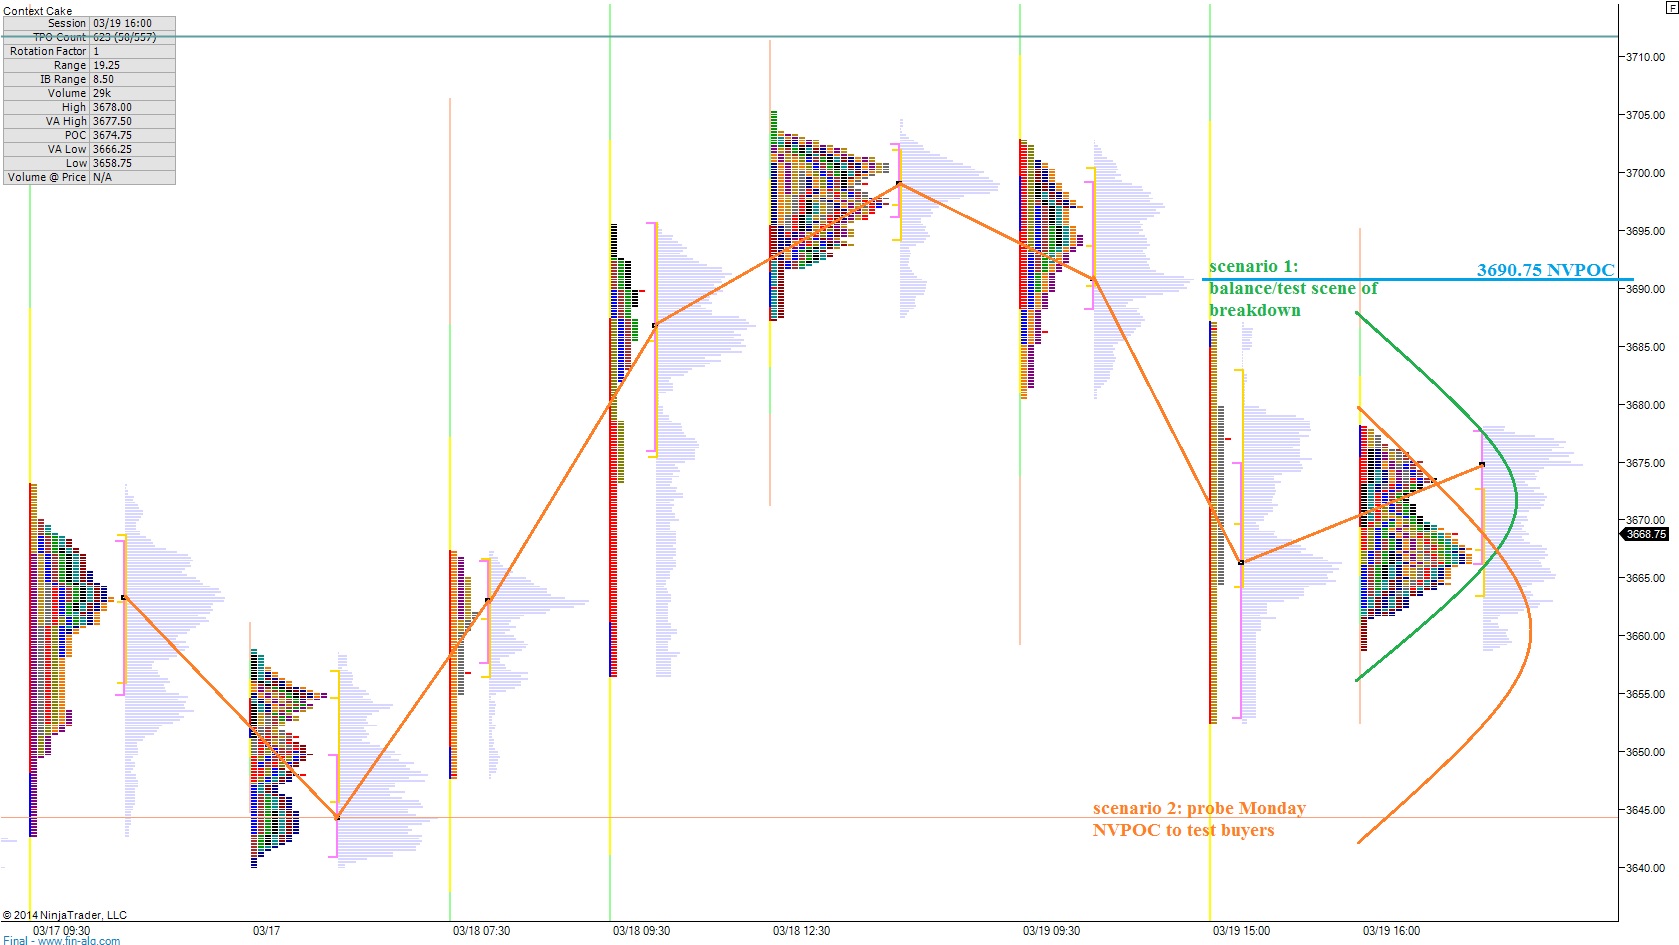
The short term auction is buyer controlled. We saw responsive buying yesterday afternoon which resulted in some tail prints which demonstrate strong demand. When the NASDAQ came into the bell while forming balance and that profile print has a long tail on it also. There exists a stronger potential for an opening drive this morning for two reasons. First, the market is currently trading only a few points below the volume cave highlighted above (intermediate term). Second the market profile prints are single prints like a zipper, and prices tend to run right up these. Thus, any aggressive attempts to fade early strength are at an elevated risk of a drive. Otherwise, we have a solid profile structure to trade against below us. The play would be to short into any early overbought positions and target an overnight gap fill. If price trades inside of the prior value for an hour, find another entry onto the short side to trade through value to the VPOC and then the VAL. I have highlighted this trade as well as a few other observations on the following market profile chart: