Late at night I like to run investment models, discerning Sharpe ratios — trying to find the best model to use for my longer term investments. Many lazy ham and eggers will simply say ‘just buy the QQQ’ and forget about it. But the problem with the Nasdaq is in its weighting. About 7 stocks make up more than 40% of the whole index. Even though they’re all mega cap stars, I’d hardly call that a diversified approach to portfolio management, especially when considering that all of them are in the tech sector.
What we want to find are high quality returns, not just throwing crap at the wall, hoping HMNY will shoot to the moon. As an advisor, ZERO smart money will invest with you with that harebrained philosophy. It’s imperative that you learn excel and get your sharpe ratio game going strong, or find some other methods to communicate that your model is, in fact, quality.
Let’s examine what the market has done over the past year.
According to Exodus, the median return for all stocks (3,997),was 11.5%. This is the true health of the entire market. But no one invests in all stocks, instead favoring a more rational approach through ETFs.
1yr returns
SPY: 19.8%
IWM (small cap): 14.9%
DIA (Dow 30): 25.5%
QQQ (Nasdaq): 32.2% 6mo: 12.5%, 3mo: 9%, 1mo: 3.45%
Again, while the QQQ returns are impressive, they are wrought with risk. All you have to do is go back in time and bear witness to what that God forsaken index did to investors in previous markets squalls. In the 30 months following the March 2000 top, the Nasdaq slid by 78%. I rest my case.
I’ve been experimenting with ways to chase alpha (high returns) while reducing my non-systematic risk. By non-systematic, I mean individual stock risk. I can do this by diversifying amongst sectors and different stocks.
Part of the problem with analyzing returns by market cap only is that you’ll grab the same top stocks that are outperforming in the Nasdaq. You’ll find yourself with a bunch of tech stocks, running hard in a car made of dynamite heading for the sun. Through countless hours of experimentation, I’ve found the perfect combination of fundamentals that produced the best returns, using qt rev, earnings growth, gross margins, free cash flow, price to sales and PE.
On a weekly basis, I reshuffle my personal portfolio using this approach. I call it Exodus Quant. The reason why I’ve been turning over so quickly is to find the model that works best. Since it’s my own money, turnover isn’t my prime concern. But for you, the navy suit wearing monkey in a necktie, you can’t go around switching client portfolios every week. I think a reasonable time frame to reevaluate is on a quarterly basis.
Here are the returns using my ‘perfect fundamental’ criteria across market caps.
Over 50b
1 mo: 2.78%
3 mo: 11.7%
6 mo: 21.3%
1 yr: 36.4%
10-50b
1mo: 0.57%
3mo: 7.71%
6mo: 12.97%
1 yr: 28.5%
5-10b
1 mo: 2.9%
3 mo: 11.1%
6 mo: 20.9%
1 yr: 45.6%
1-5b
1 mo: 1.57%
3 mo: 12.06%
6 mo: 22.09%
1 yr: 32.31%
Under 1b
1 mo: -2.24%
3 mo: 0.45%
6 mo: 0.22%
1 yr: 7.2%
I bet you didn’t expect the top returns to be found in the ambiguous $5-10b market cap quintile, did you? It’s worth noting, my strict criteria annihilated most micro caps, which is why the returns under $1b are so poor. If you stripped away my free cash flow criteria, 1 yr returns shot up to 17.6%.
Let me remind you, those returns are the entire basket, not a truly diversified approach across different sectors. There are 8 principle sectors: Basic Materials, Consumer Goods, Financials, Healthcare, Industrial Goods, Services, Technology and Utilities. My approach is to buy 2 of each, providing they fit the criteria. If, for example, I did a quarterly review and found that stocks in the $5-10b quintile was where I wanted to allocate assets, but zero utility stocks fit the criteria, I’d simply leave it out. Reason being: I am not going to sacrifice my core beliefs just for the sake of diversification. While it might increase the Sharpe ratio of my portfolio, it would most likely reduce the overall quality and returns. If you adhere to these basis principles, you would’ve avoided the oil and gas and retail rout over the past 2 years. Those sectors do not show up in my screens because their fundamentals aren’t good enough. While technical analysis can help find good investments over the short term, over the long term, fundamentals is the only thing that matters.
Let’s have a look at what a $5-10b portfolio would look like, using this approach.
1 yr median returns of 56.5%
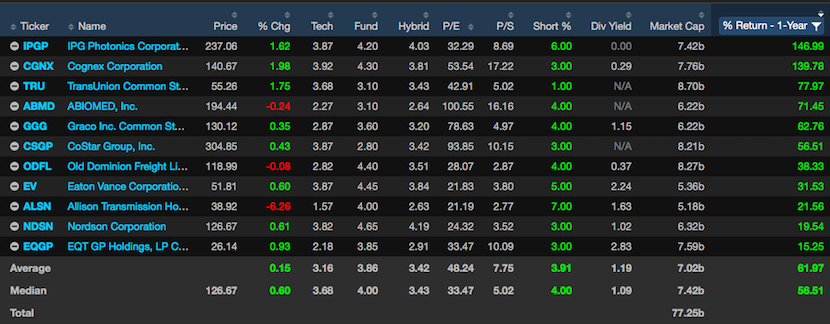
Now the actual screen produced a lot more stocks — but I would only accept the top two of each sector — ranked by our Hybrid score (a combo of technical and fundamental factors).
Here are the returns for the above portfolio over different time frames.
1mo: 7.4%
3mo: 15.8%
6mo: 21.1%
Going forward, it would be important to analyze the quality of the returns on a quarterly basis, using said criteria, and adjusting the portfolio accordingly.
Comments »