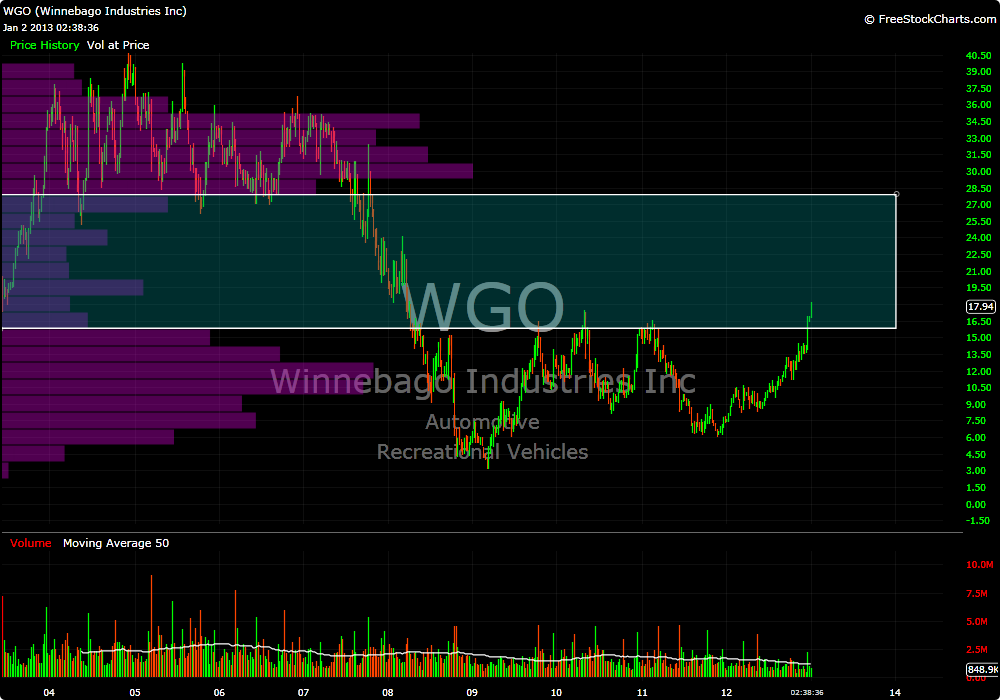
My portfolio sports a 1/4 position in Winnebago Industries (WGO). Looking at a daily chart would lead one to believe that this stock is racing to new highs. Zoom out to the weekly and an entirely different picture comes into focus:
Over the weekend, I took notice of this stock (initially because of a very high ranking by The PPT) making a very strong move into the “volume pocket” on the weekly. Here is where it appears that Price by Volume analysis can be a very powerful tool.
The weekly chart contains almost 9.5 years worth of price and volume data. You can clearly see that there was significantly less buying and selling going on in the highlighted area. With this in mind, one can deduce that there is likely to be limited resistance to buying thrusts throughout some of, if not all of this area.
Does this mean we are going to 28 in a straight line? Of course not.
The most challenging part of this analysis is that the PbV bars are truly dynamic and this pocket could disappear should price stall in this region. Simply put, I am merely trying to identify a “path of least resistance”.
Patience is key here, but ideally, my plan is to add shares upon consolidating price action in this range and ride a progressively larger position all the way to the top of the pocket around 28.
-EM


