[youtube://http://www.youtube.com/watch?v=GvrHZzgDjGs 450 300] [youtube://http://www.youtube.com/watch?v=5H8G7aotaXQ 450 300]
Comments »Lacy Hunt Ph.D., Economist: The Fed’s Failures are Mounting
“The Fed’s capabilities to engineer changes in economic growth and inflation are asymmetric. It has been historically documented that central bank tools are well suited to fight excess demand and rampant inflation; the Fed showed great resolve in containing the fast price increases in the aftermath of World Wars I and II and the Korean War. In the late 1970s and early 1980s, rampant inflation was again brought under control by a determined and persistent Federal Reserve.
However, when an economy is excessively over-indebted and disinflationary factors force central banks to cut overnight interest rates to as close to zero as possible, central bank policy is powerless to further move inflation or growth metrics. The periods between 1927 and 1939 in the U.S. (and elsewhere), and from 1989 to the present in Japan, are clear examples of the impotence of central bank policy actions during periods of over-indebtedness.
Four considerations suggest the Fed will continue to be unsuccessful in engineering increasing growth and higher inflation with their continuation of the current program of Large Scale Asset Purchases (LSAP):
- First, the Fed’s forecasts have consistently been too optimistic, which indicates that their knowledge of how LSAP operates is flawed. LSAP obviously is not working in the way they had hoped, and they are unable to make needed course corrections.
- Second, debt levels in the U.S. are so excessive that monetary policy’s traditional transmission mechanism is broken.
- Third, recent scholarly studies, all employing different rigorous analytical methods, indicate LSAP is ineffective.
- Fourth, the velocity of money has slumped, and that trend will continue—which deprives the Fed of the ability to have a measurable influence on aggregate economic activity and is an alternative way of confirming the validity of the aforementioned academic studies.
1. The Fed does not understand how LSAP operates
If the Fed were consistently getting the economy right, then we could conclude that their understanding of current economic conditions is sound. However, if they regularly err, then it is valid to argue that they are misunderstanding the way their actions affect the economy.
During the current expansion….”
Comments »The Socialization of Risk
[youtube://http://www.youtube.com/watch?v=sbqvvNiIfVs 450 300]
Comments »Peter Schiff is Not Smellin’ Yellen Roses
[youtube://http://www.youtube.com/watch?v=rfLlF1vtit8 450 300]
Comments »Is the Fed Steering the U.S. Towards Default?
[youtube://http://www.youtube.com/watch?v=5bbv-iXytEw#t=78 450 300]
Comments »A Word From Peter Schiff
[youtube://http://www.youtube.com/watch?v=-HA_jZGqFok 450 300]
Comments »Will China Force An End to QE?
“Nothing lasts forever… (especially in light of China’s earlier comments)

Submitted by Patrick Barron via The Ludwig von Mises Institute,
We use the term “reserve currency” when referring to the common use of the dollar by other countries when settling their international trade accounts. For example, if Canada buys goods from China, it may pay China in US dollars rather than Canadian dollars, and vice versa. However, the foundation from which the term originated no longer exists, and today the dollar is called a “reserve currency” simply because foreign countries hold it in great quantity to facilitate trade.
The first reserve currency was the British pound sterling. Because the pound was “good as gold,” many countries found it more convenient to hold pounds rather than gold itself during the age of the gold standard. The world’s great trading nations settled their trade in gold, but they might hold pounds rather than gold, with the confidence that the Bank of England would hand over the gold at a fixed exchange rate upon presentment. Toward the end of World War II the US dollar was given this status by international treaty following the Bretton Woods Agreement. The International Monetary Fund (IMF) was formed with the express purpose of monitoring the Federal Reserve’s commitment to Bretton Woods by ensuring that the Fed did not inflate the dollar and stood ready to exchange dollars for gold at $35 per ounce. Thusly, countries had confidence that their dollars held for trading purposes were as “good as gold,” as had been the Pound Sterling at one time.
However, the Fed did not maintain its commitment to the Bretton Woods Agreement and the IMF did not attempt to force it to hold enough gold to honor all its outstanding currency in gold at $35 per ounce. The Fed was called to account in the late 1960s, first by France and then by others, until its gold reserves were so low that it had no choice but to revalue the dollar at some higher exchange rate or abrogate its responsibilities to honor dollars for gold entirely. To it everlasting shame, the US chose the latter and “went off the gold standard” in September 1971.
Nevertheless, the dollar was still held by the great trading nations, because it still performed the useful function of settling international trading accounts. There was no other currency that could match the dollar, despite the fact that it was “delinked” from gold.
There are two characteristics of a currency that make it useful in international trade: one, it is issued by a large trading nation itself, and, two, the currency holds its value vis-à-vis other commodities over time. These two factors create a demand for holding a currency in reserve. Although the dollar was being inflated by the Fed, thusly losing its value vis-à-vis other commodities over time, there was no real competition. The German Deutsche mark held its value better, but German trade was a fraction of US trade, meaning that holders of marks would find less to buy in Germany than holders of dollars would find in the US. So demand for the mark was lower than demand for the dollar. Of course, psychological factors entered the demand for dollars, too, since the US was seen as the military protector of all the Western nations against the communist countries for much of the post-war period.
Today we are seeing the beginnings of a change. The Fed has been inflating the dollar massively, reducing its purchasing power in relation to other commodities, causing …”
Comments »Dollar and Stock Correlation May Spell a Bull Market Top
“The stock market is finally starting to show signs that the bull market may be coming to an end. Before I go into the stock market though, I want to discuss the dollar because I think currencies are going to be integrally tied to the topping process.
For the better part of the past five years a lower dollar has generally been positive for the stock market. However, we are now five years into QE and I think we are at the point where it’s important that the dollar hold its value. At this point I think the stock market is deathly afraid that the dollar is going to crack under five years of continual debasement. As many of you have probably noticed over the last several weeks stocks have been dropping along with the dollar.
We have some interesting currents at play in the currency markets at the moment. It’s been my opinion for some time that the dollar would adjust its yearly cycle low from the spring to later in the fall (this will set up next year’s yearly and three year cycle low to occur late in the year. This is also the most likely time frame generally for the currency crisis to occur). I think that process is now in play.
For this to come to fruition the dollar needs to move below the February low sometime in the next two or three weeks. Keep in mind that other than a three year cycle low the yearly cycle low is the most intense sell off of the year and generally does not terminate until it looks like the world is coming to an end (we definitely haven’t reached that point yet).
I suspect the government shutdown and debt ceiling debacle are going to intensify the dollar’s yearly cycle low this year. This suggests that we are going to see a very aggressive and scary decline in the dollar index over the next 2-3 weeks.
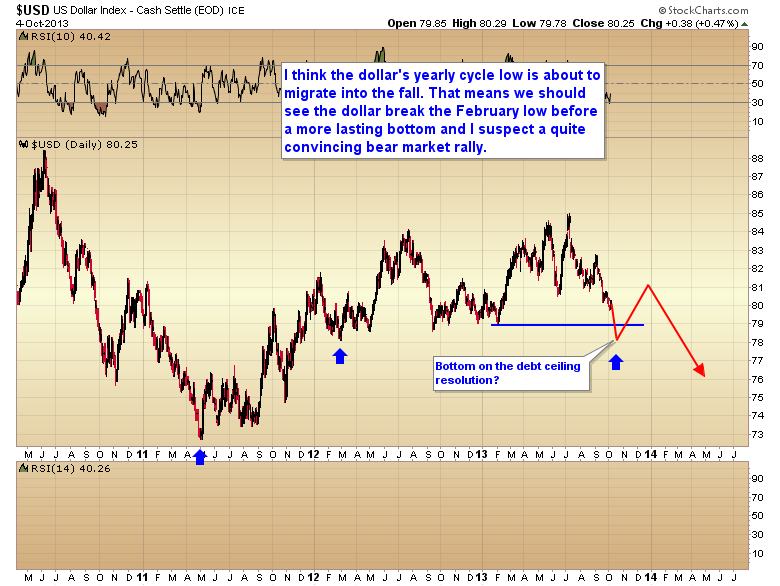
I’m expecting the yearly cycle to bottom either on the debt ceiling resolution, or one day either side of it as the market starts to sniff out a deal. At that point I think we’re probably going to see a significant intermediate degree rally as the currency markets breathe a sigh of relief.
However, within 1-2 months I also expect the currency markets to come to their senses and realize that nothing has changed and the dollar is going to continue to be debased, maybe even at a faster rate than before. At that point I think the dollar will roll over again and get busy moving down into next year’s three year cycle low which should manifest as a moderately severe currency crisis around this same time next fall.
Now let’s look at some of the warning signs in the stock market. To begin with, this is the first time in five years that the advance decline line has failed to follow the market to new highs.
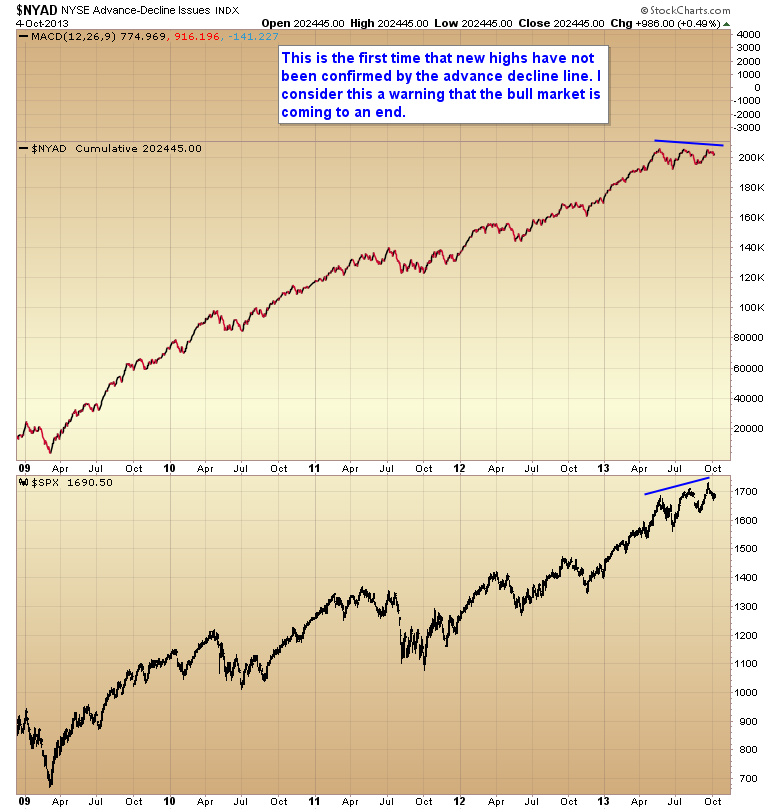
In the next chart I have marked each intermediate cycle low with a blue arrow. You can see that the previous intermediate cycle ran quite long as it was stretched by QE 4 to 33 weeks. This is a full 11 weeks longer than a normal intermediate cycle duration. Often a long cycle like this is followed by a short cycle. Note that the last intermediate cycle had 4 complete daily cycles nested within it. I think there is a very good chance that the current intermediate cycle will only have two.

Considering that the current daily cycle is already on day 25 …”
Comments »Bow Tie: “Be Careful… You’re In A Fool’s Paradise”
“Jim Rogers has a two-word message for U.S. investors: “Be careful.”
“The U.S. is the largest debtor nation in the history of the world,” Rogers told CNBC.com Wednesday night by phone from Singapore. “We may well have a big, big rally in the U.S. stock market, but it’s not based on reality. I would encourage investors to know you’re in a fool’s paradise, be careful, and when people start singing praises, say, ‘I’ve been to this party before, and I know know it’s time to leave.'”
For Rogers, the author of “Street Smarts: Adventures on the Road and in the Markets,” it is only a matter of time until the U.S. stock market runs into devastating problems due to the Fed’s quantitative easing program and the prevalence of similar stimulative programs around the world.
“First of all, throughout American history, we’ve always had slowdowns every four to six years. That means that sometime in the next couple of years—three years, maximum—we are going to have problems again, caused by whatever reason,” Rogers said. “For instance, there was 2001 and 2002, and then 2007 and 2009 was much worse. Well, the next time it’s going to be worse still, because the level of debt is so, so, so much higher. Every country is increasing its debt at the same time.”
Stimulative measures by central banks, such as the purchasing of assets with created money, boost asset prices in the short term. But Rogers said that central banks can only do so much….”
Comments »Globalization: Fleshing Out the End of an Age
“In his latest note to clients, Morgan Stanley head of global economics Joachim Fels relays an idea he says has him increasingly worried these days, even though, in his words, it is “no more than a tentative thesis that still needs to be fleshed out and checked for robustness.”
“In short, I wonder whether just as 1913 marked the end of first Golden Age of globalisation that had begun in 1870, 2013 may mark the end of our age of globalisation, which accelerated since the 1980s and 1990s after many emerging markets opened up to international trade and capital flows,” says Fels. “To be sure, I’m not predicting the world wars, mass sufferings and economic depressions of the three dark decades following 1913, but I do worry about a creeping trend towards a de-globalisation of economic activity and capital flows.”
Fels points to the Federal Reserve’s easy-money policies following the financial crisis, which caused investors to scramble into investments in emerging markets, a trend that is now reversing.
The economist envisions problems down the road as a result, as he explains in his note….”
Comments »How to Profit From the Greatest Wealth Transfer in the History of Mankind
Part two talks about the seven stages of an empire along with the process of the debasement of currency. If your interested you may watch here: Part 2
Otherwise the value can be found in part 3:
[youtube://http://www.youtube.com/watch?v=y-IemeM-Ado 450 300] Comments »The Greatest Wealth Transfer in the History of Man
[youtube://http://www.youtube.com/watch?v=DyV0OfU3-FU 450 300]
Comments »A Preview for the Upcoming Earnings Season
“For Q3, analysts expect both the financials and consumer discretionary sectors to show strong earnings growth. Earnings for the materials and energy sectors are expected to decline overall in Q3.
Throughout 2013, analyst estimates called for slow growth in the first half of the year, balanced out by strong growth in the second half. As the third-quarter earnings reporting season approaches, growth estimates have declined to a more modest 4.8%, down from the 8.5% projection from the beginning of the quarter, as seen below in Exhibit 1. Looking ahead to the fourth quarter, the current estimate is for 11.1% earnings growth, which appears optimistic, given projections for only 1.3% revenue growth.
Exhibit 1. S&P 500: Q3 2013 Earnings Growth Estimates, Current and Beginning of Quarter

Similar to the second quarter, analysts expect the financials sector to lead the way in third-quarter earnings growth, with a 10.4% increase expected. Within the sector, the big banks look to be driving earnings, as they benefit from gains in financial markets. Furthermore, many of these companies’ results will be flattered by weak results from a year ago. This is especially true in the investment banking & brokerage sub-industry, which is expected to report 477% earnings growth, primarily as a result of losses in the year-ago quarter from Morgan Stanley (MS.N) and E*TRADE Financial Corporation (ETFC.O).
Strength in the housing market has benefitted the financials sector in recent quarters; however, rising interest rates and more difficult comparisons are expected to provide challenges for third-quarter earnings results for companies with significant exposure to mortgages. Analysts estimate that the thrifts & mortgages sub-industry will undergo a 7% earnings decline, while the regional banks sub-industry will see profits fall by 17%, making it the weakest sub-industry within financials.
The other sector expected to be a major driver of earnings growth in the third quarter is consumer discretionary….”
Comments »BIS: The Share of “Leveraged Loans” is 10% Higher Than at the Height of the Financial Crisis in 2007
Note : The article was Google translated and may have grammatical inconsistencies.
“The Bank for International Settlements (BIS) is the current situation on the financial markets as worse than before the Lehman bankruptcy. The warning of the BIS could be the reason why the U.S. Federal Reserve decided to continue indefinitely to print money: Central banks have lost control of the debt-tide and give up. The decision by the U.S. Federal Reserve to continue indefinitely to print money ( here ) might have fallen on “orders from above”. Apparently, the central banks dawns that it is tight. Very narrow.
The most powerful bank in the world, the Bank for International Settlements (BIS) has published a few days ago in its quarterly report for the possible end of the flood of money directly addressed – and at the same time described the situation on the debt markets as extremely critical. The “extraordinary measures by central banks” – aka the unrestrained printing – had awakened in the markets the illusion that the massive liquidity pumped into the market could solve the fundamental problems (more on the huge rise in debt – here ).
This clear words may have meant that Ben Bernanke and the Federal Open Market Committee, the Fed got cold feet. Instead, as expected, which is now formally announcing the end of the flood of money, the Fed has decided to just carry on as before.
If one is to the BIS experts believe that no single problem is solved.
All problems are only increasing.
Because the BIS but apparently does not know how they get the genie back in the bottle, it pays to listen to those who were part of the system – but now have no official functions and therefore more able to find clear words.
The former chief economist of the Bank for International Settlements (BIS), William White, was also reported to be parallel to the BIS word.
His statements are nothing more and nothing less than an announcement of the big crash.
White warned in unusually clear form of a huge, global credit bubble.
The share of “leveraged loans” or the extreme form of credit risk by mid-2013 at an all time high of 45 percent. This is ten percentage points higher than at the height of the financial crisis in 2007. A year later, in September 2008, Lehman Brothers went bankrupt.
Thus, the current situation is much more dangerous than before the Lehman bankruptcy….”
Comments »Canadian Billionaire Predicts The End of the Dollar as the World’s Reserve Currency
[youtube://http://www.youtube.com/watch?v=nX7J8-VTG08 450 300]
Comments »Everything’s Fixed, Everything’s Great!
“A brief summary of everything that’s been fixed.
Much to the amazement of doom-and-gloomers, everything’s been fixed and as a result, everything’s great. The list is impressive: China: fixed. Japan: fixed. Europe: fixed. U.S. healthcare: fixed. Africa: fixed. Mideast: well, not fixed, but no worse than a month ago, and that qualifies as fixed.
Let’s scroll through a brief summary of everything that’s been fixed.
1. China’s economy. It was slowing down, which would have been bad for the global economy. But the recent PMI (preliminary made-up indicator) readings have been the strongest since the Great Leap Forward.
The basic story here is China needs a million more of everything…”
Comments »A Word From Nigel Farage
[youtube://http://www.youtube.com/watch?v=MjruPuo1KgU 450 300]
Comments »Rick Hanauer: “Rich People Do Not Create Jobs”
[youtube://http://www.youtube.com/watch?v=CKCvf8E7V1g 450 300]
Comments »A Possible Reason to Enter Syria
” “The powers of financial capitalism had another far reaching aim, nothing less than to create a world system of financial control in private hands able to dominate the political system of each country and the economy of the world as a whole.” —Prof. Caroll Quigley, Georgetown University, Tragedy and Hope (1966)
Iraq and Libya have been taken out, and Iran has been heavily boycotted. Syria is now in the cross-hairs. Why? Here is one overlooked scenario.
In an August 2013 article titled “Larry Summers and the Secret ‘End-game’ Memo,” Greg Palast posted evidence of a secret late-1990s plan devised by Wall Street and U.S. Treasury officials to open banking to the lucrative derivatives business. To pull this off required the relaxation of banking regulations not just in the US but globally. The vehicle to be used was the Financial Services Agreement of the World Trade Organization.
The “end-game” would require not just coercing support among WTO members but taking down those countries refusing to join. Some key countries remained holdouts from the WTO, including Iraq, Libya, Iran and Syria. In these Islamic countries, banks are largely state-owned; and “usury” – charging rent for the “use” of money – is viewed as a sin, if not a crime. That puts them at odds with the Western model of rent extraction by private middlemen. Publicly-owned banks are also a threat to the mushrooming derivatives business, since governments with their own banks don’t need interest rate swaps, credit default swaps, or investment-grade ratings by private rating agencies in order to finance their operations.
Bank deregulation proceeded according to plan, and the government-sanctioned and -nurtured derivatives business mushroomed into a $700-plus trillion pyramid scheme. Highly leveraged, completely unregulated, and dangerously unsustainable, it collapsed in 2008 when investment bank Lehman Brothers went bankrupt, taking a large segment of the global economy with it. The countries that managed to escape were those sustained by public banking models outside the international banking net.
These countries were not all Islamic. Forty percent of banks globally are publicly-owned. They are largely in the BRIC countries—Brazil, Russia, India and China—which house forty percent of the global population. They also escaped the 2008 credit crisis, but they at least made a show of conforming to Western banking rules. This was not true of the “rogue” Islamic nations, where usury was forbidden by Islamic teaching. To make the world safe for usury, these rogue states had to be silenced by other means. Having failed to succumb to economic coercion, they wound up in the crosshairs of the powerful US military.
Here is some data in support of that thesis.
The End-game Memo
In his August 22nd article, Greg Palast posted a screenshot of a 1997 memo from Timothy Geithner, then Assistant Secretary of International Affairs under Robert Rubin, to Larry Summers, then Deputy Secretary of the Treasury. Geithner referred in the memo to the “end-game of WTO financial services negotiations” and urged Summers to touch base with the CEOs of Goldman Sachs, Merrill Lynch, Bank of America, Citibank, and Chase Manhattan Bank, for whom private phone numbers were provided.
The game then in play was the deregulation of banks so that they could gamble in the lucrative new field of derivatives. To pull this off required, first, the repeal of Glass-Steagall, the 1933 Act that imposed a firewall between investment banking and depository banking in order to protect depositors’ funds from bank gambling. But the plan required more than just deregulating US banks. Banking controls had to be eliminated globally so that money would not flee to nations with safer banking laws. The “endgame” was to achieve this global deregulation through an obscure addendum to the international trade agreements policed by the World Trade Organization, called the Financial Services Agreement. Palast wrote:
Until the bankers began their play, the WTO agreements dealt simply with trade in goods–that is, my cars for your bananas. The new rules ginned-up by Summers and the banks would force all nations to accept trade in “bads” – toxic assets like financial derivatives.
Until the bankers’ re-draft of the FSA, each nation controlled and chartered the banks within their own borders. The new rules of the game would force every nation to open their markets to Citibank, JP Morgan and their derivatives “products.”
And all 156 nations in the WTO would have to smash down their own Glass-Steagall divisions between commercial savings banks and the investment banks that gamble with derivatives.
The job of turning the FSA into the bankers’ battering ram was given to Geithner, who was named Ambassador to the World Trade Organization.
WTO members were induced to sign the agreement by threatening their access to global markets if they refused; and they all did sign, except Brazil. Brazil was then threatened with an embargo; but its resistance paid off, since it alone among Western nations survived and thrived during the 2007-2009 crisis. As for the others:
The new FSA pulled the lid off the Pandora’s box of worldwide derivatives trade. Among the notorious transactions legalized: Goldman Sachs (where Treasury Secretary Rubin had been Co-Chairman) worked a secret euro-derivatives swap with Greece which, ultimately, destroyed that nation. Ecuador, its own banking sector de-regulated and demolished, exploded into riots. Argentina had to sell off its oil companies (to the Spanish) and water systems (to Enron) while its teachers hunted for food in garbage cans. Then, Bankers Gone Wild in the Eurozone dove head-first into derivatives pools without knowing how to swim–and the continent is now being sold off in tiny, cheap pieces to Germany…..”
Comments »CPI vs GDP Deflator
“Albert Einstein, a man who knew a thing or two about celestial mechanics, supposedly once called compound interest “the most powerful force in the universe.” While the remark was likely meant to be funny (astrophysicists can be hilarious), it sheds light on the often overlooked fact that small changes, over time, can yield enormous results. Over eons, small creeks can carve large canyons through solid rock. The same phenomenon may be at work in our economy. A minor, but persistent under bias in the inflation gauge used in the Gross Domestic Product (GDP) may have created a wildly distorted picture of our economic health.
It would be impossible to measure the economy without “backing out,” inflation. That is why economists are very careful to separate GDP reports into two categories: “nominal” (which are not adjusted for inflation), and real (which are). Only the real reports matter. The big question then becomes, how do we measure inflation? Just as I reported last week with respect to the biases baked into the government’s GDP revisions, the devil is in the details.
As it turns out there are a number of official inflation gauges that vie for supremacy. Most people tend to follow the Consumer Price Index (CPI) which is compiled by Bureau of Labor Statistics, a division of the Department of Labor. The CPI is regarded as the broadest measurement tool, but it has been changed many times over the years. Most famously, its formulas were loosened in the late 1990’s as a result of the “Boskin Commission” which said that the CPI overstated inflation by failing to account for changes in consumer behavior. I believe those changes seriously undermined the reliability of the index. But the CPI itself has to contend for relevance with its stripped down rival, the “Core CPI,” which factors out food and energy, which many believe are too volatile to be accurately counted. The core CPI is almost always lower than the “headline” number.
Another set of inflation data, the “GDP Deflator” is compiled by the Bureau of Economic Analysis (part of the Commerce Department), and is used by them to calculate GDP. The deflator differs from the CPI in that it has much more flexibility in weighting and swapping out items that are in its sample basket of goods and services. While the CPI attracts the lion’s share of the media and political attention, it is the deflator that is relevant when looking at economic growth.
On a quarterly basis the two numbers are usually close enough to escape scrutiny. (However, the most recent 2nd quarter GDP estimates relied on annualized inflation of a ridiculously low .7%!). But if you look at a broader time horizon a very clear pattern emerges that makes a great difference in how we perceive the economic landscape.
Available data sets for both the CPI and the GDP deflator go back to 1947. That 66 year period falls neatly into two phases. From 1947 to 1977 both yardsticks moved together almost identically, both rising 173% over that time. But in the ensuing 36 years (until 2013), the CPI is up almost three fold (292%) while the deflator is only up about two fold (209%). The CPI rising 40% more than the GDP deflator is an extremely significant factor. How did that happen? As it turns out, quarterly inflation assumptions have been, on average, .17% lower for the deflator than for the CPI since 1977. That is a small number. But as with compound interest small numbers add up to big numbers over time.

Annualized the .17% difference would shave off an additional .68% of annual GDP growth. This is about a quarter of the average 2.85% real growth rate since 1977 that the government has calculated using the deflator. Over 35 years this has likely made a huge difference in the how the economy actually feels and how we live, regardless of the nominal figures that are published. Even if you were to split the difference between the CPI and the deflator you would still get an economy that feels significantly smaller than it appears.
The $64,000 question ($188,000 adjusted by CPI inflation since 1977) is what happened in 1977 to make the CPI and the deflator diverge? Sadly, the details aren’t really made public. What we do know is that ….”
Comments »