iBankCoin
Home / Commentary (page 30)

Commentary

Real vs Implied Reality

“For the last few years, the US equity market has soared through Q4 and into Q1 and macro-economic indications have trended with them in a virtuous circle ‘confirming’ that this time it’s different and recovery is ‘on’. Then just as investors get all bulled up, convinced by the market’s all-knowing-efficiency that the old normal is back and growth is returning, macro-economic data starts to disappoint expectations. This is initiallyshrugged off – “it’s a transitory dip”, “the market sees through this temporary weakness”, “where else are you going to put your money?” – and the stock buying continues through the Winter. But there comes a time, when the divergence from economic reality grows too wide and the ‘faith’ that the market knows best starts to fade; and sure enough, each time, the market drops back rapidly to reality. What is the common denominator for this winter surge?

Simple – massive global central bank bailouts/injections in the months just before winter that levitate the market (and psychologically create ‘hope’ that is then extrapolated into future economic expectations which then after a one- to two-quarter lag, leads to disappointment as real economic data can’t match the market’s implied reality).


2010-11…


2011-12…”

Full article

Comments »

The Power of the Tweet

Today the DOW did a 150 point v shape move inside of 3 minutes; all thanx to an erroneous or hacked tweet appearing to come from AP.

The tweet described an explosion at the W.H. reporting injury to the president.

Fun times indeud!

Full article


Comments »

Gapping Up and Down This Morning

SOURCE 
NYSE

GAINERS

Symb Last Change Chg %
BCC.N 31.92 +1.65 +5.45
BERY.N 18.44 +0.94 +5.37
PBF.N 31.33 +1.38 +4.61
ABBV.N 44.20 +1.81 +4.27
AGI.N 11.94 +0.40 +3.47

LOSERS

Symb Last Change Chg %
EVTC.N 20.04 -0.80 -3.84
MODN.N 19.86 -0.63 -3.07
SSNI.N 17.89 -0.56 -3.04
USPH.N 22.97 -0.70 -2.96
HCI.N 24.66 -0.64 -2.53

NASDAQ

GAINERS

Symb Last Change Chg %
PWER.OQ 6.33 +2.29 +56.68
ABIO.OQ 2.90 +0.93 +47.21
DGICB.OQ 22.97 +3.82 +19.95
CLIR.OQ 8.30 +0.97 +13.23
MNOV.OQ 2.95 +0.33 +12.60

LOSERS

Symb Last Change Chg %
PBHC.OQ 13.09 -2.66 -16.89
OMTH.OQ 6.44 -0.90 -12.26
FABK.OQ 11.26 -1.41 -11.13
AFFX.OQ 3.46 -0.36 -9.42
IESC.OQ 5.40 -0.53 -8.94

AMEX

GAINERS

Symb Last Change Chg %
OGEN.A 3.84 +0.20 +5.49
SAND.A 7.44 +0.36 +5.08
FU.A 3.83 +0.13 +3.51
ORC.A 13.40 +0.20 +1.52
REED.A 4.15 +0.05 +1.22

LOSERS

Symb Last Change Chg %
MHR_pe.A 18.35 -1.07 -5.51
BXE.A 5.98 -0.27 -4.32
ALTV.A 10.62 -0.41 -3.72
SVLC.A 2.03 -0.02 -0.98
EOX.A 5.91 -0.05 -0.84

Comments »

Bond Yields and Rate Cut Expectations Rise as Economic Data Worsens for Europe

“Italian bonds advanced, pushing two-year note yields to a record low, as data showing euro-area output contracted for a 15th month in April boosted speculation the European Central Bank will lower interest rates.

The yield on Italian 10-year government bonds fell below 4 percent for the first time in almost 2 1/2 years, while Spanish and Portuguese yields dropped to the least since 2010. Borrowing costs in France and Ireland declined to the lowest on record as a purchasing managers’ index showed services in Germany unexpectedly shrank with manufacturing. Bunds rose for a second day, with yields falling to the lowest since July, and Treasuries and U.K. gilts also advanced.

“The weaker tone in the headline and German PMIs this morning has fueled rate-cut speculation with regard to the next meeting,” Michael Leister, an interest-rate strategist at Commerzbank AG in London. “Bonds are rallying across the board, bunds as well as peripherals, which clearly shows to us that this hunt for yield is really intensifying and the market is expecting an ultra-low yield environment to stay in place for the foreseeable future.”

Italy’s two-year yield fell six basis points, or 0.06 percentage point, to 1.17 percent at 12:14 p.m. London time, after reaching 1.16 percent, the lowest level since Bloomberg began compiling the data in 1993. The 6 percent security due November 2014 rose 0.09, or 90 euro cents per 1,000-euro ($1,230) face amount, to 107.41.

The nation’s 10-year yield declined as much as eight basis points to 3.975 percent, the lowestsince Nov. 8, 2010.

Yield Lows…”

Full article

Comments »

State of the Union: The Decline of Small Business and Self Employment

“Small business is the incubator of employment. As it declines, so too do opportunities for first jobs, second chances and economic independence.

Self-employment and small business are two sides of a single economic coin: financial independence. The Bureau of Labor Statistics (BLS) counts two types of self-employed, the unincorporated and the incorporated. The unincorporated may have employees, but typically do not, i.e. they are sole proprietors. The incorporated have employees, starting with the owner, as the BLS counts the incorporated self-employed as employees of their own corporation.

I know that’s confusing, but it’s important to separate the sole proprietors from those “self-employed” incorporated businesses that have employees: law firms, doctors’ offices, accountants, etc.

When we speak of “small business,” we’re referring in large part to the incorporated self-employed: people who establish corporations as the legal structure for their enterprise.

Nothing is simple when it comes to parsing all the data, of course, but the BLS has a paper that explains the basic categories: Self-employment in the United States(Bureau of Labor Statistics).

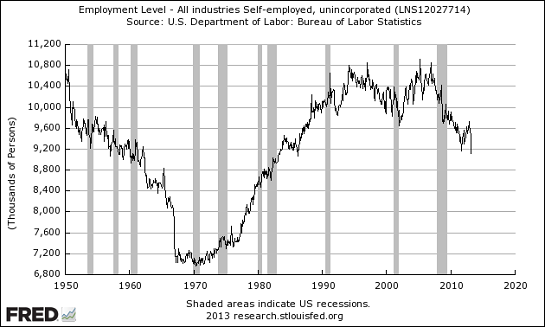
The BLS attributes the decline in unincorporated self-employment from 1950 to 1970 to the consolidation of agriculture. As agriculture became more mechanized, small farms were no longer viable and farming required less labor. As a result, many self-employed farmers and laborers became employees or moved to other sectors.

The trajectory of self-employment from 1970 to the mid-2000s tracked general economic growth, which was weak in the 1970s but began a 30-year boom in the early 1980s. Things changed in the recession, as the self-employed ranks have lost 1.6 million from the peak in 2007. The number of self-employed has fallen to early 1980s levels: (All FRED charts courtesy of frequent contributor B.C.)

This chart displays the self-employed as a share of total non-farm employment. The first chart showed a strong rise in self-employment from 1970, but this chart shows that employment rose even faster: the self-employed share of all those employed has been declining for 30 years:

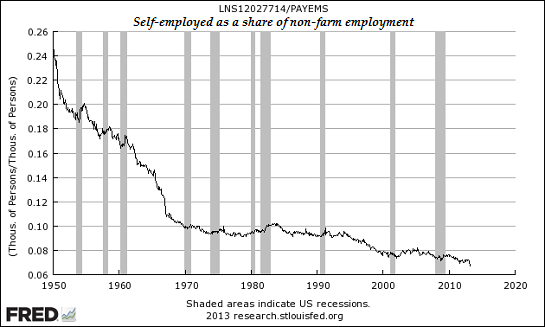
We can attribute this trend to the rise of global Corporate America and government employment. The workforce expanded, and relatively more people became employees of corporations or the government than became self-employed.

It’s important to note here that the BLS does not break down the income of unincorporated self-employed: if millions of self-employed saw their net incomes slashed in the recession, the BLS still counts them as self-employed. So a consultant who earned $100,000 prior to the recession and now scrambles to net $10,000 is still self-employed.

This is the statistical equivalent of 6 million people losing full-time jobs and then 4 million of those people getting part-time jobs. Did employment truly recover most of the losses?….”

Full article

Comments »

Divergence Between The S&P and Inflation is Signaling a Third Top for Equities

“As @ParagonCap points out on Twitter, the S&P 500 is now outpacing inflation expectations even more than it did at the market tops of either 2000 or 2007.

The chart below shows that this divergence has been a couple years in the making at this point. However, in recent weeks, a lot of talk about disinflation and deflation has resurfaced.

After taking the prize as one of the worst performing asset classes in the first quarter, the commodity complex has become completely unglued in April. At the same time, there has been a big rally in Treasuries as investors position for a slowdown in global growth….”

Full article

Comments »

David Woo Says the Markets are Realigning and It will Not Be Pretty

“Different markets sending different signals.

That’s the gist of BofA Merrill Lynch rates guru David Woo’s latest report – titled “The impossible trinity: A tale of three cities” – which begins like this (emphasis added):

The commodity market is saying global growth is slowing. The US equity market is saying US consumers are still going strong. The FX and European sovereign markets seem to believe Mrs. Watanabe is about to embark on a global shopping spree. We think it is unlikely that these markets will all turn out to be right. Something will have to give and a major re-alignment of the markets, the odds of which are rising, will probably not be either smooth or benign, in our view.

“It is probably an understatement to say that lately it has become more difficult than usual to read markets,” writes Woo. “To the extent that these themes reflect market expectations of reality, there seems to be three different versions of reality right now.”

With regard to the first version of reality – that which is evidenced by the commodity market, which has sold off hard in recent weeks and months – Woo says “the body of evidence suggesting that the global economy is slowing is growing almost every day,” making the idea of a global slowdown “difficult to refute.”

Here, Woo points to China and its recent release of weaker-than-expected first quarter economic data. In the past, he says, investors usually took weak data as a sign that Beijing would “unleash more stimulus” on the Chinese economy in response.

“This time around,” he writes, “things may turn out differently as the strong momentum behind recent home price appreciation may hold back policymakers from easing quickly and with decisiveness.”

The chart below shows the home price obstacle facing Chinese leaders weighing any additional stimulus at this stage in the game.


China house prices

BofA Merrill Lynch Global Research


The second version of reality is that advanced by the rising U.S. stock market.

Not only have U.S. stocks outperformed outperformed other major equity markets around the world this year, but within the U.S. market, consumer staples and consumer discretionary stocks have been leading the way higher. Woo points out that the first quarter of this year was the first time since 2000 that both consumer sectors led a rising stock market.

However, the story on the ground is not as encouraging….”

Full article

Comments »

Gapping Up and Down This Morning

SOURCE
NYSE

GAINERS

Symb Last Change Chg %
RH.N 38.00 +5.25 +16.03
SEAS.N +2.96 +9.69
TRQ.N 5.64 +0.44 +8.46
EVTC.N 20.84 +1.30 +6.65
AGI.N 11.54 +0.69 +6.36

LOSERS

Symb Last Change Chg %
SBGL.N 3.88 -0.15 -3.72
WAC.N 32.21 -0.83 -2.51
SZC.N 23.79 -0.41 -1.69
MIE.N 20.36 -0.34 -1.64
PANW.N 50.71 -0.79 -1.53

NASDAQ

GAINERS

Symb Last Change Chg %
VRTX.OQ 85.36 +32.49 +61.45
NVDQ.OQ 12.73 +2.51 +24.50
OSTK.OQ 18.73 +3.03 +19.30
HWAY.OQ 12.89 +1.87 +16.97
NETE.OQ 3.19 +0.39 +13.93

LOSERS

Symb Last Change Chg %
ACTG.OQ 21.49 -7.97 -27.05
PRGX.OQ 5.24 -1.00 -15.97
AIRM.OQ 39.76 -6.14 -13.38
VIRC.OQ 2.18 -0.31 -12.45
NSIT.OQ 16.51 -2.02 -10.90

AMEX

GAINERS

Symb Last Change Chg %
ALTV.A 11.03 +1.11 +11.19
AKG.A 2.54 +0.23 +9.96
SAND.A 7.08 +0.06 +0.85
FU.A 3.70 +0.03 +0.82
BXE.A 6.25 +0.05 +0.81

LOSERS

Symb Last Change Chg %
MHR_pe.A 19.42 -1.93 -9.04
OGEN.A 3.64 -0.09 -2.41
ORC.A 13.20 -0.20 -1.49

Comments »

A Stronger Aussie Dollar is Curtailing Revenues Down Under

Australia has lost A$7.5 billion ($7.7 billion) in revenue since the October mid-year budget review due to its strong currency and lower terms of trade, worsening its budget position, Treasurer Wayne Swan said.

“We’ve been hit in Australia with a high dollar, lower terms of trade, which has had a dramatic impact upon the profitability of companies and prices more generally in the economy,” Swan said in an interview on the Australian Broadcasting Corp.’s ‘Insiders’ program yesterday. That’s caused “a sledgehammer to revenues in the budget since the mid-year update of something like A$7.5 billion.” …”

Full article

Comments »

To Worry or Not to Worry Over $AAPL’s Stock Price

“Apple is in the news for losing its rank for a time on Wednesday as the most valuable publicly-traded U.S. stock. And now Henry Blodget — who first became famous for the gap between his bullish reports on tech stocks and his bearish emails about them — is touting seven reasons why Apple is a buy.

But I think all those reasons are wrong and the stock has further to fall.

Apple fell $23 a share — dipping below $400 on April 17. According to Bloomberg, one of its audio-chip suppliers, Cirrus Logic, produced too much inventory — which analysts concluded meant that iPhone sales could fall short of analysts’ expectations.

Vernon Essi, Jr., an analyst at Needham & Co., wrote in a research report, “We blame Apple for losing its mobility mojo. This was simply an inventory overbuild for the iPhone 5 relative to Apple’s forecast.”

But this has not stopped Henry Blodget’s Business Insider from arguing that investors should buy Apple shares. According to the SEC, in 2000, Blodget issued a very bullish analyst report while at Merrill Lynch on a company called 24/7. The next day, he wrote an email claiming the company was “a pos [piece of shit].” This helped get him banned from the securities industry.

And now Blodget is touting Apple as a buy – citing seven reasons. Here’s why I think his argument does not hold water…..”

Full article

Comments »

Big Blue Suggests a Grim Future Ahead

“IBM’s poor earnings performance in the first quarter likely foretells a rough time ahead for the stock market.

In an after-the-bell report Thursday, the information technology leader missed narrowly on bottom-line profit but widely on top-line revenue. Profit of $3 a share missed Wall Street estimates by a nickel, while revenue of $23.41 billion fell short of hopes for $24.62, a 5 percent whiff.

As a result, traders punished IBM in Friday action, with the shares closing down more than 8 percent.

IBM has been underperforming the market the way it is, dropping 10.9 percent over the past month while the Standard & Poor’s 500 has risen about 0.2 percent.

The earnings report may well confirm weakness both in the company and broader market.

IBM earnings, in fact, have served as a highly efficient proxy for market movement going all the way back 10 years, according to research from Bespoke Investment Group.

While many investors focus on Alcoa because it kicks off earnings season, as a barometer, IBM has proved more efficient.The company’s stock movement immediately after earnings has had a stunning 75 percent success rate in predicting market movement over the next five weeks.

More recently, the correlation has been perfect over the past five quarters. In the three times IBM rose after earnings, the S&P 500 also gained. Likewise, the correlation held in the two quarters when the company’s stock fell.

In the 10-year period, the trend has been more accurate when IBM has a positive earnings reaction, with the market up 80 percent of the time. Negative earnings have correlated with market movement at a 70 percent rate, Bespoke found.

“Part of the explanation lies in the fact that IBM generates more than half of its revenues from its services unit, which has a presence in practically every S&P 500 company,” Bespoke said. “Any weakness in the performance of corporate America (or even the corporate world) will likely show up in the results of IBM.” …”

Full article

Comments »

The FBI Has Some ‘Splaining’ To Do Over Boston Bombers

“The FBI needs to explain in more detail why it failed to realize that the older Boston bombing suspect, Tamerlan Tsarnaev, was a terrorism risk.

By the FBI’s own admission, the FBI was warned about Tsarnaev in 2011 by a foreign government (presumably Russia).

The foreign government told the FBI that Tsarnaev had become “a follower of radical Islam and a strong believer and that he had changed drastically … as he prepared to leave the United States for travel to the country’s region to join unspecificied underground groups.”

In response to this warning, the FBI says it checked databases and interviewed Tsarnaev and other family members in the summer of 2011 but found no evidence of “terrorism activity.”

Then the FBI says it “requested more information” about Tsarnaev from the foreign government but never received it.

Less than two years later, Tsarnaev is suspected of masterminding a successful terrorist attack on the city of Boston that killed three people and injured nearly 200.

So the FBI has some questions to answer.

Namely:

  • Given the explicit warning, why didn’t the FBI continue to monitor Tsarnaev?
  • Why didn’t the FBI follow up with the foreign government when it didn’t get the additional information it requested?
  • How common is a warning from a foreign government about a specific person like this? Does the FBI get thousands of them?
  • What made the FBI effectively clear Tsarnaev — and what might the FBI change  to avoid making this mistake again?
  • Will the FBI conduct a full investigation into what happened?

Here’s the key section of the FBI’s statement….”

Full article

Comments »

Will Deflation Bring More Easing & QE ?

Source 

“WASHINGTON (MarketWatch) – The Federal Reserve will be watching price data closely for further signs of falling prices, two central bank officials indicated on Thursday Richmond Fed President Jeffrey Lacker and Minneapolis Fed President Narayana Kocherlakota said that that the Fed must be on its guard against falling prices. “If inflation looked like it was going to sag further on a persistent basis, I would certainly consider stimulus for the purpose of bringing inflation up to target,” Lacker told reporters, according to Bloomberg. In a separate speech, Kocherlakota said that cooling price pressures were “definitely a cause for concern.” The comments echo remarks made Wednesday by St. Louis Fed President James Bullard, who said he was concerned that the Fed’s preferred measure of inflation, the personal consumption expenditures price index, increased at a 1.3% rate in February, well below the Fed’s 2% target. Economists said the implication of the concern is that the Fed may maintain its $85 billion-per-month asset-purchase program for longer than expected and perhaps augment it with other easing steps.”

Full article

Comments »

The U.S. Mint Reports Record Sales of Gold Coins Following Price Debacle

“The U.S. Mint in April has sold 153,000 ounces of American Eagle gold coins, the highest in almost three years, after futures prices started the week by plunging the most since 1980.

Sales have more than doubled from March and surged sevenfold from a year earlier, data on the Mint’s website showed. The amount for all of May 2010 was 190,000 ounce.

This week, retail sales and jewelry demand soared in India, the world’s top gold buyer, and China, the second-biggest, after futures in New York slumped into a bear market, touching the lowest in more than two years. Coin sales also surged in Australia….”

Full article

Comments »

The Chart That Keeps the Fed Up at Night

“While Cyprus has been brushed away as a “storm in a teacup” and asset-gatherers stare blankly at their screens pointing at record highs to confirm the “market knows best”, it appears something rather important ‘broke’ that day (and hasn’t stopped breaking since). While we have discussed the rather glaring divergences between US equities’ exuberance and global equity markets and macro- and micro- data; supposedly theFed’s key indicator (the 5Y5Y forward inflation expectation) has reversed rather significantly. The last two times, forward inflation expectations dropped so significantly, the ECB launched LTRO and the Fed launched QE3. It seems the BoJ’s QQE is not having the effect perhaps they had hoped on inflation expectations. Will the Fed have to come to the rescue once again? And how will gold react to that?


Cyprus appears to have stolen the jam out of the reflation-game donut…


as one of the Fed’s key indicators (5Y5Y forward inflation) is diverging significantly… suggesting multiple compression (not expansion)

or moar money-printing…”

Full article

Comments »

Boston Bomber’s Uncle: ‘They Do Not Deserve To Live On This Earth’

“Ruslan Tsarni, the uncle of the two suspects in the Boston Marathon bombings, told a local television station that the suspects “do not deserve to live on this earth.”

Tsarni told WBZ-TV in Boston (in an interview that was just aired Friday by CNN) that the two suspects — Dzhokar and Tamerlan Tsarnaev — do not deserve to live, and he apologized to their victims.

“He deserved his. He absolutely deserved his,” Tsarni said of Tamerlan, who was killed early Friday morning. “They do not deserve to live on this earth.”…”

Full article

Comments »

Gapping Up and Down This Morning

SOURCE
NYSE

GAINERS

Symb Last Change Chg %
AGI.N 10.85 +0.62 +6.06
VET.N 46.67 +1.80 +4.01
TAM.N 14.55 +0.43 +3.05
HY.N 51.65 +1.45 +2.89
BCC.N 30.61 +0.79 +2.65

LOSERS

Symb Last Change Chg %
RALY.N 17.16 -0.84 -4.67
RH.N 32.75 -1.60 -4.66
SSNI.N 17.76 -0.76 -4.10
AXLL.N 51.50 -1.65 -3.10
ASGN.N 22.15 -0.61 -2.68

NASDAQ

GAINERS

Symb Last Change Chg %
OSTK.OQ 15.70 +4.24 +37.00
THRX.OQ 32.56 +4.55 +16.24
TZOO.OQ 24.33 +2.60 +11.97
TCCO.OQ 6.70 +0.70 +11.67
CRME.OQ 2.15 +0.22 +11.40

LOSERS

Symb Last Change Chg %
MCOX.OQ 5.18 -1.29 -19.94
RDHL.OQ 8.20 -1.80 -18.00
UTEK.OQ 29.88 -6.50 -17.87
UNXL.OQ 32.42 -5.65 -14.84
EXAS.OQ 8.84 -1.13 -11.33

AMEX

GAINERS

Symb Last Change Chg %
SVLC.A 2.05 +0.29 +16.48
SAND.A 7.02 +0.68 +10.73
OGEN.A 3.73 +0.28 +8.12
BXE.A 6.20 +0.44 +7.64
ALTV.A 9.92 +0.47 +4.97

LOSERS

Symb Last Change Chg %
MHR_pe.A 21.35 -0.65 -2.95
REED.A 4.08 -0.03 -0.73
EOX.A 5.96 -0.03 -0.50

Comments »