[youtube://http://www.youtube.com/watch?v=Pp2M870u_gQ#t=16 450 300]
Comments »
“A chart of the Dow Jones Industrial Average going back to July 2012 closely matches one from 1928-29, signaling a crash may be coming later this month or in March, if the correlation continues, says Mark Hulbert, editor of Hulbert Financial Digest.
“There are eerie parallels between the stock market’s recent behavior and how it behaved right before the 1929 crash,” he writes in an article for MarketWatch.
He first wrote about the chart on MarketWatch in early December, questioning its validity. But now that the pattern has continued to repeat, he’s turning into a believer.

“One of the biggest objections I heard two months ago was that the chart is a shameless exercise in after-the-fact retrofitting of the recent data to some past price pattern,” Hulbert notes.
“But that objection has lost much of its force. The chart was first publicized in late November of last year, and the correlation since then certainly appears to be just as close as it was before.”
Another objection Hulbert heard was that the Dow soared more than 100 percent in 1928-29, compared with a gain of less than 50 percent in 2012-13….”
Comments »[youtube://http://www.youtube.com/watch?v=zYUCJMPQVY4#t=12 450 300] [youtube://http://www.youtube.com/watch?v=MeE3-rOG7i4 450 300]
Comments »“On both sides of the Atlantic, failed policies threaten to doom people to years of slow economic growth and stagnant incomes, asserts Columbia University professor Joseph Stiglitz.
“There are alternatives,” writes the Nobel laureate in an article for Project Syndicate, published just days ahead of new Federal Reserve Chair Janet Yellen’s widely anticipated testimony to Congress on monetary policy and the economy. “But we will not find them in the self-satisfied complacency of the elites, whose incomes and stock portfolios are once again soaring. Only some people, it seems, must adjust to a permanently lower standard of living. Unfortunately, those people happen to be most people.”
Stiglitz warned of entrenched Japanese-style sluggish growth in 2008. Leaders on both sides of the Atlantic claimed they had learned lessons from Japan, and then promptly repeated the same mistakes.
The U.S. economy was sick even before the 2008 financial crisis, he writes. It wasn’t just the housing bubble. Problems festering beneath the surface included growing inequality, global imbalances and rampant speculation that was doing nothing to spur productivity or create jobs.
Policymakers not only failed to address those problems, they actually made them worse and created news ones, Stiglitz charges. Austerity polices made the downturn deeper and longer than necessary — and “with long-lasting consequences.”
Many countries became more indebted as the downturn diminished tax revenues. Because of public and private underinvestment, a generation of young people who should have been improving their skills have become idle and increasingly alienated.
Inflation-adjusted GDP per capita is lower in most Western countries than in 2007. Median real income in the U.S. is less than it was in 1989…..”
Comments »“The international capital flows from advanced Western Economies to Emerging Markets is not a new phenomenon. Since the abandonment of the Bretton Woods, there has been an upward trend in international capital movements. Reasons are being the growth of international trade and the liberalization of the trade and current accounts in the industrial economies, from the 1940s till the 1970s. Such capital flows are recorded in the Capital Account in the Balance of Payment of a country.
Emerging economies from Latin America such as Brazil, Mexico and Argentina are some of the pioneers in opening up their economies to international capital flows in the late 1970s. Latin America recorded about $8 billion in capital inflow in the late1980s surged to $24 billion in 1991. With the expansion of international trade, emerging market countries are beginning to open up their semi-open economies. Semi-open economies are characterized by artificial restrictions or barriers created to restrict the freedom of capital movement. Examples include the creation of taxes, quotas, licenses and so on.
The success of the Latin American countries in attracting capital inflows from Western countries also prompted many Asian Countries to follow suit. The first wave of capital inflow from the West occurred during 1988-1989. During this period the capital inflows, many Asian countries recorded capital account surplus and some to the tune of 2.5% to GDP. As a result of this, there is a marked increase in the international reserves held by those countries. To capitalize on the growth of international trade, many emerging market countries began to liberalize both their trade and capital markets. Tariffs and quotas are either reduced or eliminated; licenses are relaxed so as to promote a more open economy.
Thus, this also led to many of them abandoning their traditional protectionist model for economic growth and embracing a more open economy by liberalizing their trade or current account. Instead of promoting the import substitution and infant industry development strategy they now encourage Foreign Direct Investment inflow as their next growth strategy. Other reasons for opening up their economy are to facilitate capital inflows of cheap funds to fast track their economic development and also the urge to compete with their neighbors to attract more funds.
What causes capital inflow?
There are many reasons associated with the recent international capital flows and most are attributed to both push and pull factors. Since the last Global Financial crisis in 2008, it left many economies especially from the West in tatters. Their economies plunged into recessions and as a result there is a constriction of credit. To prevent their economies from plunging into a severe recession, funds are injected into the economy through quantitative easing. Further to that, interest rates are lowered to almost zero percent so as to promote borrowing to revive economic activity.
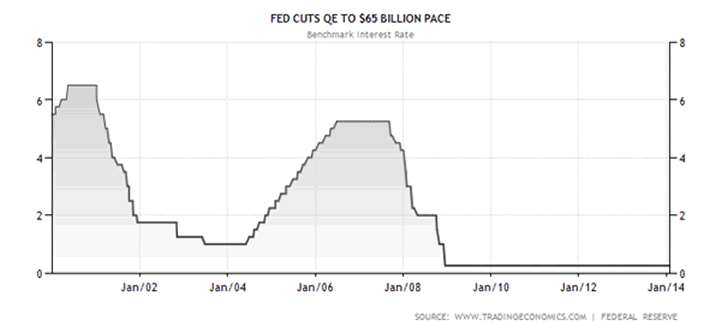
The above chart shows the movement of the U.S interest rate and as can be seen rates are lowered twice. The first downward move of the interest occurred in the year 2000 to counter the recession caused by the Y2K. The second and most recent one was during the financial crisis in 2009 where the interest rate was lowered from more than 5% to 0.25% and prevailed till now.
This drop in interest rate provided an impetus for the Emerging Markets to repatriate some of their funds from Western countries and at the same time increased their borrowings. Further to that the sharp drop in the interest rate also helped improve the solvency of many Emerging Market debtors. This is due to the lower debt service obligation on external debts held by emerging market economies.
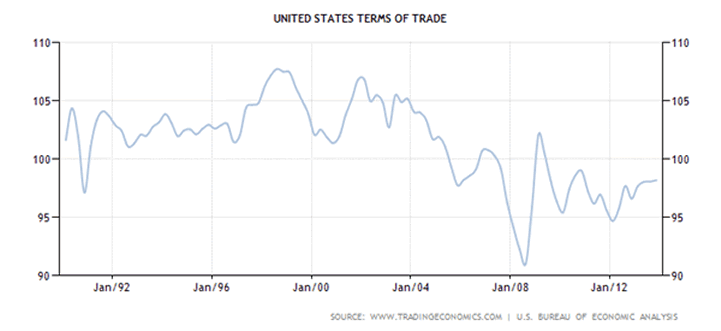
Another determinant for the increased capital inflow into Emerging Markets is the eroding trade balance positions of many Emerging Economies. Thus a deteriorating trade balance will eventually lead to a worsening current account deficit. This process or linkage is known as the Harberger-Laursen-Metzler effect. Hence, the need to finance this deficit through capital inflows also contributed to the relaxation of rules governing capital inflows.
This effect can be shown by the following terms of trade and current account graphs in the U.S from 1990 to 2014. As can be seen the U.S Current Account worsens as the terms of trade deteriorates.
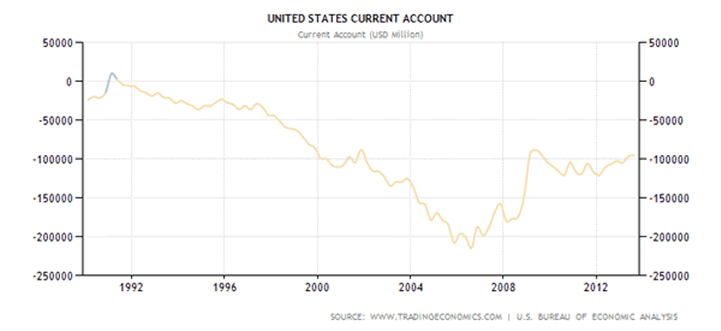
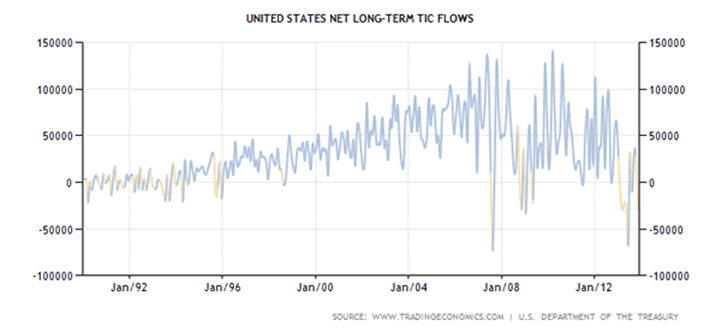
This also correspond to the increased of private capital outflow from the U.S Capital Account due to the deteriorating Balance of Payment in the U.S. There has been an increase in the amount of investments by U.S mutual and institutional funds in overseas securities. This may be due to the need for diversification to reduce risk and also to take advantage of higher yields in Emerging Markets. The following is the net long term flows chart in the U.S as from 1990 to 2013. This chart tracks the Treasury, securities, Corporate bonds and equities flow in and out of the United States. As can be seen there has been a steady outflow of funds since the 1990s except for the year 2008 and as recently as 2013.
Among the pull factors that encourage capital inflows into recipient countries are the availability of cheap funds to fast-track their economic development cycle and financing their current account deficits. Nations that are experiencing shortage of capital to invest can take advantage of borrowed money from capital inflow to speed up their economic development.
This can be explained using the Harrod-Domar growth model which was developed in the late 1940s by two economists namely Roy Harrod and Evsey Domar. According to the growth model, the key ingredients are the national savings ratio (or S) and capital output ratio or ICOR (Incremental Capital Output Ratio or K). For example, to calculate the rate of growth of an economy with a savings rate of 30% and a capital output ratio of 5, we then apply the following formula.
Economic Growth = S/K or 30/5 = 6% per annum.
Thus, a country’s economic growth can be enhanced by either increasing its savings from National Income which will be redirected towards investment or decreasing the Capital to Output ratio by way of increasing investment in technology to reduce the K ratio. This is because by applying technology, less capital will be needed to produce one unit of output. As a result, it gained popularity and countries like China and India have incorporated it into their 5 year Economic Plan.
As can be seen, capital deficient countries can enhance their Investments through borrowed funds by way of liberalizing their capital account. By removing barriers to capital inflows, these countries will be able to achieve higher economic growth in a shorter time span through higher investment.
This objective is only achievable if the debtor countries spend their borrowed capital wisely. Investing wisely can increase their productive capacity and hence will generate future returns to pay off the loans. Another condition to justify capital inflow is to make sure that the funds are not directed towards portfolio or personal consumption so as to prevent future complications in debt servicing. Thus, this can explain why some developing countries like China, South Korea, Taiwan and Singapore has done relatively well and able to pay the higher cost of increasing interest rates. Other countries especially from the South America and African nations could not and thus consistently plunge into financial crisis.
Problems of Capital Inflow
In theory, capital inflow can be viewed as having a positive effect on an economy like helping it to fast track its economic growth. However along the way, it also helped create some unwanted externalities. Some of them include the following.
First……..”
Comments »“U.S. stocks have too much momentum to make betting against the Standard & Poor’s 500 Index a winning strategy and the gauge will probably reach 1,900 next quarter, according to money manager Laszlo Birinyi.
Birinyi, the founder of Birinyi Associates Inc. and one of the first analysts to advise clients to buy when stocks were bottoming after the 2008 financial crisis, said in a phone interview Feb. 7 that the benchmark gauge for U.S. equities will increase almost 6 percent by July.
It fell 5.8 percent in the three weeks staring Jan. 15, losses he said signal healthy skepticism that set the stage for more gains.
“I don’t like when the market just shrugs these things off,” Birinyi said from Westport, Connecticut. “It’s OK to just stop and take a deep breath. The market should have some sort of a negative reaction when you have problems in Turkey and Argentina. That didn’t make me uncomfortable.”
Weakening currencies from Argentina to Turkey, cuts to Federal Reserve stimulus and slower economic growth in the U.S. and China sent the S&P 500 to its worst performance to start a year since 2010. While almost $3 trillion was erased from share prices globally, the retreat failed to stir bearish speculators, who left bets against S&P 500 companies near the lowest level on record, data compiled by Bloomberg starting in 2006 show. The gauge’s futures slid 0.2 percent at 8:25 a.m. in London.
Lesson Learned
“Short sellers have probably learned their lesson” after a year when 460 of 500 companies in the benchmark index climbed, the most since at least 1990, Birinyi said. At the same time, “there’s nothing that you can say is a bargain or a real value” if you’re a bull, he said. “You have situations on a day-to-day basis that will give you opportunities, and that’s what we’re trying to take advantage of.”
In a short sale, a trader borrows stock and sells it, hoping to profit by replacing it after a decline.
Shares rose last week as reports suggested the U.S. economy may weather Fed stimulus reductions. The S&P 500 added 0.8 percent to 1,797.02, snapping the longest weekly losing streak since May 2012 The gauge rallied 2.6 percent in the last two days, the most since Oct. 11, to push its price-earnings ratio to 16.6. The five-year average is 15.5, according to data compiled by Bloomberg.
The 70-year-old investor has defied market pessimists throughout the five-year bull market that sent the S&P 500 up 166 percent, writing in December 2008 that stocks were near a bottom. In September 2011, he said U.S. companies were earning too much to be dragged lower by Greece’s debt crisis. The index is up 56 percent since then. A year later, with the gauge at about 1,400, he said comparisons with prior bull markets suggested it could reach 1,500 in four months. It took five.
Shorts Retreat…”
Comments »“Following rate-rigging scandals, FX manipulation debacles, insider-trading idiocy, and over-aggressive lending practices, bankers are taking a different approach in regaining some public trust. As Jamie Dimon gives himself a “well-deserved” pay rise, Dutch bankers are turning to God… As Bloomberg reports, all 90,000 Dutch bank employees will take an oath ‘to do no harm’ as it were, punishable by the Banking Association. While Goldman may be doing God’s work; the Dutch are vowing to Him to enhance confidence in their industry….”
Comments »
“The U.S. Bureau of Labor Statistics releases the January jobs report today at 8:30 AM ET.
The median estimate of 92 market economists polled by Bloomberg is that 180,000 workers were hired to nonfarm payrolls in January after last month’s report revealed only 74,000 hires, well below everyone’s estimates.
Meanwhile, economists predict 185,000 workers were hired to private-sector payrolls, implying a net 5,000 reduction in government employee headcount.
The big question is whether the weather effects that appeared to drag down the December number will also weigh on the January report. The consensus view seems to be that this is not likely to be the case due to the fact that temperatures were actually relatively warm over the period in which the January survey was conducted.
“The market is priced for 180,000, which implies an average gain of 127,000 over the past two months,” says Eric Green, global head of rates, FX, and commodities research at TD Securities.
“We enter the number where risks appear asymmetric. 180,000 would suggest the December number was an anomaly, but the two month trend would still be almost 80,000 off the recent pattern. Given the recent uptick in yields and a world populated with more uncertainty and volatility, that is not a number likely to push yields higher or keep risk appetites on the mend. A weaker number, however, would reinforce the fear that another false start on this recovery has reemerged.”
In its monthly National Employment Report released on Wednesday, payroll-processing firm ADP estimated 175,000 workers were hired by private-sector firms in January. The ADP report, which foreshadows the official jobs report, significantly overestimated the official December jobs number. However, this may have been due to differences in survey methodology — the upshot being that ADP’s report does not capture weather effects.
Beyond the nonfarm payrolls number, market participants will be watching the unemployment rate closely. The median estimate of market economists is that it will remain unchanged from December at 6.7%, but around 40% of those surveyed see it falling either to 6.6% or 6.5% in January…..”
Comments »Random surfing of the interwebs turned up a video which was partially correct on a statement, but potentially not by the correct person.
What made the vid interesting was talk of derivatives, tapering, rising interest rates, currency reset, and market turmoil to begin in 2014. Given the volatility in the last month i thought it may be worth your consideration.
In October 2012 Grady Means Predicted The End of the Real World Will Occur on March 4, 2014
“Grady Means is a businessman, former assistant to Vice President Nelson Rockefeller and former economist at the U.S. Department of Health, Education and Welfare”
————————————————————————————————————————————————————————————————————————————
“Those wild and crazy Mayans put down their marker that the end of the world would occur on Dec. 21, 2012 — about two months from now. There is, of course, some small chance that they might be right. On the other hand, there is a very large probability that the real end of the world will occur around March 4, 2014.
The doomsday clock will ring then because the U.S. economy may fully crash around that date, which will, in turn, bring down all world economies and all hope of any recovery for the foreseeable future — certainly over the course of most of our lifetimes.
Interest rates will skyrocket, businesses will fail, unemployment will go to record levels, material and food shortages will be rampant, and there could be major social unrest.
Any wishful thinking that America is in a “recovery” and that “things are getting better” is an illusion.
The problem is not Medicare, which won’t quit on us for another six or seven years. Nor is it Social Security, which will not be fully bankrupt for another 15 years or so. The crisis is much more immediate and much more serious.
The central problem is that America is the bank of the world. What this means, simply, is that the dollar is the world’s currency (often termed the “reserve currency”).
Throughout the world, nearly all traded goods, oil, major commodities, real estate, etc., are denominated in dollars.
The world needs dollars, and the U.S. provides them and provides confidence that the dollar is the “safest” currency in the world. Countries get dollars by trading with us on attractive terms, which enables Americans to live very well.
Countries support this system and cover their risk by investing in dollars through T-bill auctions and other mechanisms, which enables us to run budget deficits — up to a point.
The central issue is confidence in America, and the world is losing confidence quickly.
At a certain point, soon, the United States will reach a level of deficit spending and debt at which the countries of the world will lose faith in America and begin to withdraw their investments.
Many leading economists and bankers think another trillion dollars or so may do it. A run on the bank will start suddenly, build quickly and snowball.
At that point, we will need to finance our own deficit, and we will not be able to do so. We will raise bond rates to re-attract foreign investment, interest rates will go up, and businesses will fail. Unemployment will skyrocket.
The rest of the world will fully crash along with us. Europe will continue to decline, and the euro will not replace the dollar. Russia will see a collapse in oil prices as market demand softens, and Russia will collapse along with it.
China will find nowhere to export and also will collapse. The Russian and Chinese governments, which see all this coming and have been stockpiling gold to hedge against such a dollar collapse, will find that you cannot eat gold…..”
A grain of salt may be needed for this video….at least it led to an interesting article.
[youtube://http://www.youtube.com/watch?v=OOQ2jUZKKic 450 300] Comments »“On January 17, 2014, we explained “The Hows and Whys of Gold Price Manipulation.” In former times, the rise in the gold price was held down by central banks selling gold or leasing gold to bullion dealers who sold the gold. The supply added in this way to the market absorbed some of the demand, thus holding down the rise in the gold price.
As the supply of physical gold on hand diminished, increasingly recourse was taken to selling gold short in the paper futures market. We illustrated a recent episode in our article. Below we illustrate the uncovered short-selling that took the gold price down last Friday.
When the Comex trading floor opened January 30 at 8:20AM NY time, the price of gold inexplicably plunged $17 over the next 30 minutes. The price plunge was triggered when sell orders flooded the Comex trading floor. Over the course of the previous 23 hours of trading, an average of 202 gold contracts per minute had traded. But starting at the 8:20AM Comex, there were four 1-minute windows of trading here’s what happened:
8:21AM: 1766 contracts sold
8:22AM: 5172 contracts sold
8:31AM: 3242 contracts sold
8:47AM: 3515 contracts sold
Over those four minutes of trading, an average of 3,424 contracts per minute traded, or 17 times the average per minute volume of the previous 23 hours, including last Thursday’s Comex trading session.

The yellow arrow indicates when the Comex floor opened for gold futures trading. There were not any news events or related market events that would have triggered a sell-off like this in gold. If an entity holding many contracts wanted to sell down its position, it would accomplish this by slowly feeding its position to the market over the course of the entire trading day in order to avoid disturbing the price or “telegraphing” its intent to sell to the market.
Instead, Friday’s selling was designed to flood the Comex trading floor with a high volume of sell orders in rapid succession in order to drive the price of gold as low as possible before buyers stepped in.
The reason for this is two-fold: Driving down the price of gold assists the Fed in its efforts to support the dollar, and the Comex is running out of physical gold available to be delivered to those who decide to take delivery of gold instead of cash settlement.
The February gold contract was subject to delivery starting on January 31. As of January 29, two days before the delivery period started, there were 2,223,000 ounces of gold futures open against 375,000 ounces of gold available to be delivered. The primary banks that trade Comex gold (JP Morgan, HSBC, Bank Nova Scotia) are the primary entities that are short those Comex contracts. Typically toward the end of a delivery month, these banks drive the price of gold lower for the purpose of coercing holders of the contracts to sell. This avoids the problem of having a shortage of gold available to deliver to the entities that decide to take delivery. With an enormous amount of physical gold moving from the western bank vaults to the large Asian buyers of gold, the Comex ultimately does not have enough gold to honor delivery obligations should the day arrive when a fifth or a fourth of the contracts are presented for delivery. Prior to a delivery period or due date on the contracts, manipulation is used to drive the Comex price of gold as low as possible in order to induce enough selling to avoid a possible default on gold delivery.
Following the taper announcement on January 29, the gold price rose $14 to $1270, and the Dow Jones Index dropped 100 points, closing down 74 points from its trading level at the time the tapering was announced. These reactions might have surprised the Fed, leading to the stock market support and gold price suppression on January 30.
Manipulation of the gold price is a foregone conclusion. The question is: why is the Fed tapering? The official reason is that the recovery is now strong enough not to need the stimulus. There are two problems with the official explanation. One is that the purpose of QE has always been to support the prices of the debt-related derivatives on the balance sheets of the banks too big to fail. The other is that the Fed has enough economists and statisticians to know that the recovery is a statistical artifact of deflating GDP with an understated measure of inflation. No other indicator—employment, labor force participation, real median family income, real retail sales, or new construction—indicates economic recovery. Moreover, if in fact the economy has been in recovery since June 2009, after 4.5 years of recovery it is time for a new recession.
One possible explanation for the tapering is that the Fed has created enough new dollars with which to purchase the worst part of the banks’ balance sheet problems and transfer them to the Fed’s balance sheet, while in other ways enhancing the banks’ profits. With the job done, the Fed can slowly back off.
The problem with this explanation is that the liquidity that the Fed has created found its way into the stock and bond markets and into emerging economies. Curtailing the flow of liquidity crashes the markets, bringing on a new financial crisis.
We offer two explanations for the tapering……”
Comments »“Today the man who remarkably predicted months ahead of time that the Fed would taper in December, then again in January, and who also predicted the global market plunge that we are now seeing, warned KWN that there is no way out this time for central planners as the global Ponzi scheme has now begun to collapse. He also discussed the incredible turmoil taking place around the world. Below is what Gerald Celente, founder of Trends Research and the man considered to be the top trends forecaster in the world, had to say in this remarkable interview.
Eric King: “Gerald, so far this chaos is unfolding exactly as you said it would with the market turmoil around the world. Some of the market participants are becoming a bit shocked at what’s unfolding here, but you called it to perfection. My question to you is, where do we go from here?”
Celente: “Global markets are headed down, but it may not be in a straight line because you are going to start seeing the Fed, (Washington) D.C., and the Wall Street gang move in to stop the slide in global equities.
“Look at what’s going on around the world: The Asian markets keep tumbling, and the European markets are also continuing to tank. Look at what’s happening in the emerging markets: As I said to you last week, ‘These countries are raising interest rates in order to protect their currencies as their economies are declining. Brilliant. That’s the exact opposite strategy for growth.’
So the handwriting is on the wall now, but it’s going to try to be erased by outright lies from the Federal Reserve, its members, and it’s Orwellian propaganda machine — the mainstream media. Washington will also play a part in the lies and propaganda, along with Wall Street gang.
You are also going to see the Plunge Protection Team go to work at some point, and they will also use every trick they can in an attempt to try to prop up these plunging global markets. During this chaos the mainstream media and Wall Street propaganda will be non-stop and it will be proclaiming, ‘This is only a temporary correction.’
If you tune in to the major business networks they are dragging out every possible Wall Street shill that they can to spew the great lie that ‘This is a buying opportunity.’ Then these shills start spouting out half-truths and outright lies to keep promoting the Ponzi scheme.
I want to be perfectly clear about this: There is no way out. And as this starts to really being to unravel, and it will, just like I have predicted — the Fed will come up with a new scheme to increase the amount of money they are dumping into the system. But this is the important point for KWN readers around the world: This new scheme by the Fed is not going to work.
Just look at what’s going on over in Japan. We have seen ‘Abenomics,’ with trillions of yen dumped into the system. But just like in the US, the only ones that have benefitted from it are the big players — the elite — and now it’s all coming unwound.”
Eric King: “Today John Embry told KWN that the global markets are now subject to “total collapse” overnight. Is that a possibility here?”
Celente: ….”
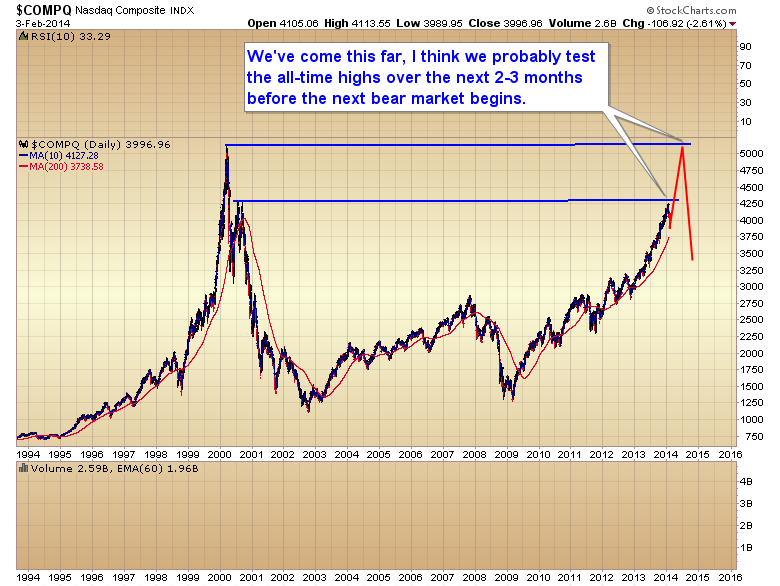
“It’s been my opinion now for the last year that the bull market that started in March of 2009 at 666 on the S&P would come to an end either in late 2013, or early 2014. I’m confident that will be the case, but based on the cyclical pattern of the current decline I believe we still have one last leg up before this bull comes to an end. I think the intermediate decline now in progress is going to create the conditions for a final manic melt up phase over the next 2-3 months to complete this huge parabolic structure that the Fed has constructed with 5 years of QE and 0% interest rates.
We’ve come this far and tested the 2000 reaction high, I have to think we’re probably going to go all the way and test the all-time highs on the NASDAQ before this bull market comes to an end.
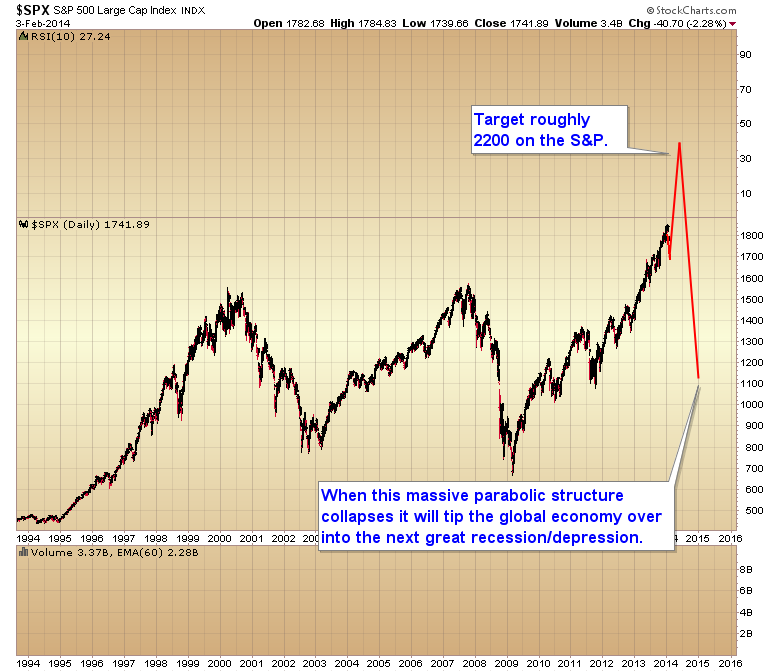
A similar percentage advance would place the S&P 500 at roughly 2200 points which when completed would represent a massive parabolic structure that when it collapses will tip the globe over into the next recession/depression.
So when do we buy stocks you ask? Should we buy today? The answer is, no I don’t think the intermediate decline is done just yet. We first need to break the intermediate trend line to confirm this as an intermediate degree correction.
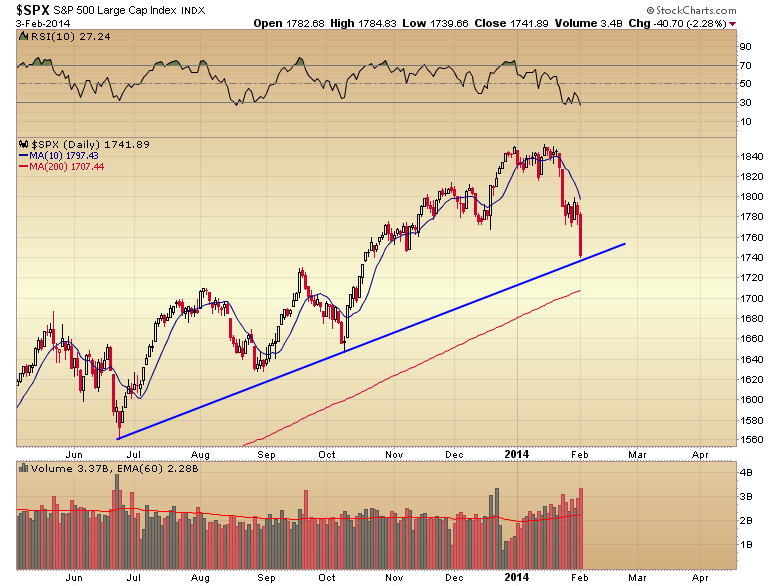
At the very least I think the S&P needs to retrace 50% of its recent intermediate rally. That comes in at roughly 1700-1705….”
Comments »” “It’s not just tapering that is putting pressure on markets,” Marc Faber warns in thie brief clip. “Emerging economies have practically no growth and we have a slowdown in China that is more meaningful than strategists are willing to believe,” he adds and this is “causing a vicious circle to the downside” in inflated asset markets as most of the growth in the world over the last five years has come from emerging markets. Faber suggests Treasuries as a safe haven in the short-term; but is nervous of their value in the long-term as “debt is becoming burdensome on the system.”
“A lot of economic growth was driven by soaring asset prices” …”
Comments »“Those of us who have attained a certain age can remember being bombarded by commercials in which we were asked “Is it live or is it Memorex?” The thrust of the ad was that it didn’t make any difference, that the tape recording was just as good as being there to watch that TV show live. Video recording technology was in its infancy, and the ability to play a movie whenever you wanted was really cool. Imagine being able to set a video recorder to record a TV show while you were away! … As long as you had somebody in the house young enough to be able to program the recorder to do it, it was great technology.
Today investors are asking themselves a similar question: “Is the meltdown in the stock market the result of Fed tapering, or is there something else going on?” We’ll address that question today and take a deep plunge into the emerging markets. We have a good old-fashioned central banker throwdown in progress, and if the results didn’t have such an impact on our investment portfolios, it could actually be quite fun to watch. What happens in the emerging markets will unfortunately not stay in the emerging markets. It’s all connected. There is more happening here than a simple correction. Let’s put our thinking caps on and try to connect some dots.
The current emerging-market meltdown is what Jonathan Tepper and I discussed in our book Endgame and specifically predicted in our latest book,Code Red. Let’s rewind the Memorex tape and see what we said:
This unprecedented global monetary experiment has only just begun, and every central bank is trying to get in on the act. It is a monetary arms race, and no one wants to be left behind. The Bank of England has devalued the pound to improve exports by allowing creeping inflation and keeping interest rates at zero. The Federal Reserve has tried to weaken the dollar in order to boost manufacturing and exports. The Bank of Japan, not to be outdone, is now trying to radically depreciate the yen. By weakening their currencies, these central banks hope to boost their countries’ exports and get a leg up on their competitors. In the race to debase currencies, no one wins. But lots of people lose.
Emerging-market countries like Brazil, Russia, Malaysia, and Indonesia will not sit idly by while the developed central banks of the world weaken their currencies. They too are fighting to keep their currencies from appreciating. They are imposing taxes on investments and savings in their currencies. All countries are inherently protectionist if pushed too far. The battles have only begun in what promises to be an enormous, ugly currency war. If the currency wars of the 1930s and 1970s are any guide, we will see knife fights ahead. Governments will fight dirty, they will impose tariffs and restrictions and capital controls. It is already happening, and we will see a lot more of it….
We are already seeing the unintended consequences of this Great Monetary Experiment. Many emerging-market stock markets have skyrocketed. Only to fall back to earth at the mere hint of any end to Code Red policies.
Emerging-market countries have to fend for themselves. Bernanke, Kuroda, and other developed-country central bankers accept no responsibility. If other countries don’t like a weaker dollar or yen, too bad. Bernanke places the blame, not on the United States for weakening the dollar, but on emerging countries for not revaluing their currencies or imposing capital controls. As U.S. Treasury Secretary John Connally said to foreign finance ministers in 1971, “The dollar is our currency, but it’s your problem.” Indeed.
Let’s stop there for a moment, as this is an extremely important point. There have been numerous speeches by developed-world central bankers explicitly explaining that they are responsible for their own markets and that the central bankers of developing economies have to adjust on their own. Just as there have been many emerging-market central bankers complaining about quantitative easing in the developed world creating problems in their markets. In a few pages, we are going to look at a very important interview on Bloomberg with Raghuram Rajan, the brilliant head of the Reserve Bank of India, but now, back to Code Red:
Whenever the Fed hikes rates, bad things happen somewhere. It’s that simple. In 1994 the quick rise in rates killed a lot of leveraged investors in the bond market. Orange County had interest-rate derivatives that blew up in its face. It was the largest municipal bankruptcy in history. Emerging-market stocks and bonds were hammered, and Mexico was even forced to devalue its currency in a major financial market crisis. If (when) the Fed hikes rates today, we’ll see lots of bankruptcies like Orange County’s and blow-ups like the Mexican Tequila Crisis. The very low rates globally in a Code Red world mean that now there are probably hundreds or thousands of investors like Orange County. You can bet on that. And that is why the market gets so nervous about suggestions that the Fed might start tapering its quantitative easing. If QE is finally ended, can rising rates be far behind? [Or at least that’s the thinking!]
Recently, much of QE’s effects have been felt in emerging-market countries. This is a response not just from the U.S. Fed but from the BOJ, ECB, and BoE. Unlike the sick, indebted developed world, many emerging-market countries are growing and doing well. [Let me remind you that we wrote this in August 2013!] We have not seen a lot of borrowing in the developed markets. Instead, growth of credit and lending to private borrowers is happening in emerging markets. Emerging markets have been a popular target of excess capital for a number of reasons: their overall ability to take on debt remains strong, and their balance sheets are still relatively healthy; and more importantly, investment yields have been high relative to sovereign competitors. This two-speed world presents enormous problems. Code Red-type policies in the developed world are leading savers and investors to flee very low rates of return at home in favor of putting money into Turkey, Brazil, Indonesia or anywhere that offers higher rates of return.
Code Red-type monetary policies are designed to produce investment and growth, and they are! Just not in the countries that central banks intended to help. This is a major headache for governments in these countries. For them it is like having loads of visitors drop by all of a sudden. It is flattering that they like your house; but after a while, you’d rather they didn’t show up unexpectedly. Hot money flows are like drunken guests. They create a very big party, they leave unexpectedly, and they leave a god-awful mess behind. Large hot money flows have been behind most major emerging-market booms and busts.
Whenever major, developed-world central banks keep rates at very low levels and weaken their currencies, they cause bubbles. Let’s look at two recent bubbles and crashes that Code Red policies helped cause.
After the Japanese bubble burst in 1989, the bank of Japan cut interest rates close to zero. By 1995 the dollar/yen exchange rate weakened, and the yen lost almost half of its value. The Japanese took money out of Japan and put it into Indonesia, Korea, Malaysia, Philippines, and Thailand. Investors in other countries borrowed money either directly in yen or through synthetic instruments. It was called the yen carry trade, and it was designed to take advantage of easy Japanese money to invest elsewhere. Everyone assumed that the yen would continue to go down, making the terms of repayment easier.
Asia attracted nearly half of the total capital inflow to emerging markets, and the stock markets of South Korea, Malaysia, Singapore, Thailand, and Indonesia were soaring. The party didn’t last forever. When the Thai currency came under pressure in June 1997, almost all Asian countries faced stock market crashes, capital flight, currency depreciations, and banking busts. The entire Asian episode perfectly fit the five stages of a bubble, but it was certainly much greater than it otherwise would have been, given the policies of the Bank of Japan….
The idea that ultra-low interest rates cause booms and busts is not new. Economists of the Austrian school, led by von Mises and Hayek, warned that credit-fueled expansions lead to the misallocation of real resources that end in crisis. In the Austrian theory of the business cycle, the central cause of a credit boom is the fall of the market rate of interest below the natural rate of interest. Investments that would not be profitable at higher rates become possible. The bigger the deviation of interest rates from the natural rate, the bigger the potential credit boom and the bigger the bust.
Like all bubbles, rapid price increases can rapidly reverse when interest rates return to normal levels. The greatest danger will then be to leveraged investors who bought farmland, corporate bonds, some emerging markets, and other bubbles with borrowed money.
Narrative or Reality?
The US Federal Reserve has begun to taper by $10 billion a meeting. That means they are still putting $65 billion a month into the world economy. Let’s do a thought experiment. If the Fed had originally announced they were going to do $65 billion per month in QE rather than the $85 billion they did announce, would it have made any difference in the overall outcomes? I would suggest there is not a great deal of actual difference between $85 billion and $65 billion. Yet now the markets are acting as if there is some massive difference.
I would submit to you that the difference is actually in the narrative. The Federal Reserve is signaling that it is going to end quantitative easing at some point in the future; therefore, investors are trying to find the exits before the end actually comes. But does it make any real difference to your portfolio whether it’s the reality or the narrative that is driving the volatility in the markets?
Sidebar: the US just printed 3.2% (annualized) GDP growth for the fourth quarter – a quarter in which the government was a significant drag. Without that drag, growth might have been 4%. In such an environment it is going to be difficult if not impossible for the Federal Reserve to discontinue the tapering of QE. If there is a surprise – and with continued growth there might be – it will be to increase the amount of easing each meeting. Just saying…
What’s Driving Emerging Markets?
The trouble in emerging markets is just beginning.
Hot money has been chasing a growth story across the emerging markets since early 2009. Trouble is, the real driver of economic growth in emerging markets is not the explosive force of eager, low-skilled workers as they climb into the middle class. That’s just the story you hear from mutual fund salesmen. That’s like saying the economy grows over time because we all get raises and spend the new income on plasma screen TVs.
Emerging-market consumption is a RESULT of growing incomes, not the CAUSE. The real driver of long-term global growth has been the great spurts of innovation enabled by the last two industrial revolutions.
Longtime readers know I disagree with Professor Robert Gordon on his long-term forecasts for productivity growth. He specializes in economic history and is one of the finest productivity economists in the world, while I am just an amateur futurist with a wild imagination, but…
Dr. Gordon was absolutely right to proclaim the end of the Second Industrial Age. It began to pass away in the 1970s, and except for the boost from the 1980s through the early 2000s due to the advent of personal computers, the world economy has essentially been running on the fumes of a dying growth model, an unprecedented but now-deflating credit bubble, and the last high-spending years of wealthy but aging populations in the developed world.
As he attempts to peer beyond the chaos of debt, deleveraging, bankrupt governments, and desperate central banks that will ensue for the next five to ten years, Dr. Gordon’s dark and dire predictions about long-term growth hinge around the fact that he can’t see the rapidly accelerating technological transformation that promises to drive another century of explosive innovation. He doesn’t think it can happen again.
Can you blame him?
Identifying the next set of world-changing technologies before it “crosses the chasm” is infinitely harder than calling a market peak or a rare turn in the long-term credit cycle. In all of human history, we have seen only TWO sets of world-changing technologies that enabled centuries of follow-on innovation, inspired dynamic new industries, and revved up the faltering growth engines of ages past.
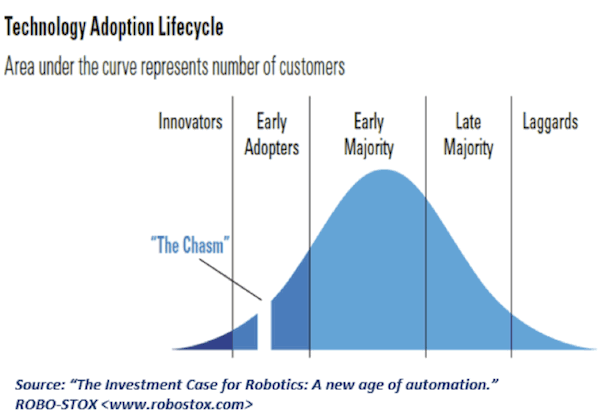
You would have to be extremely close to potentially world-changing technology to notice when it first leaps across the chasm, goes parabolic, and begins to drive a fresh explosion of innovation, productivity, and then – and only then – income.
But as you already know, the constant doubling of computing power since the late 1950s (known as Moore’s Law) has reached a point where our technological capabilities are taking exponentially larger leaps every year. And that constantly accelerating computing power is already enabling a massive round of follow-up innovation so disruptive that it looks and feels like magic.
That is great news for the human experiment and great news for the privileged minority in developing countries … but it could be terrible news for the vast majority of people in emerging markets who do not have the skills to participate in this new economy.
Contrary to popular belief, the real drivers of economic growth in most emerging markets are still investment and/or trade demand from the developed world. And those growth models – (A) attracting investment from the rich world to encourage development, (B) producing the things consumers in rich countries want, and/or (C) supplying the things manufacturing economies need to produce the things rich consumers want – are either running out of steam or becoming a lot more hazardous.
Let’s look at the longer-term challenge for export-oriented growth models first and then shift our attention to the sharp, Fed-induced reversal in capital flows that could devastate emerging economies in the coming months.
Emerging markets can’t depend on trade demand from the developed world…..”
Comments »“Monday’s 2.3 percent drop in the Standard & Poor’s 500 Index represents a “natural phenomenon” that makes stocks a good bargain, says Savita Subramanian, head U.S. equity strategist for Bank of America Merrill Lynch.
“I do see this as a great buying opportunity for some of the higher-quality names in the S&P 500 that have sold off on emerging market exposure,” she told CNBC.
U.S. stocks historically experience 5 percent corrections about three times a year, particularly around shifts in monetary policy, Subramanian says.
The S&P 500 has lost 5.8 percent so far this year, closing at 1,741.89 Monday. The Federal Reserve last week announced the second leg of tapering of its quantitative easing (QE), cutting its monthly bond purchases by $10 billion….”
Comments »“The apparent suicide death of the chief economist of a US investment house brings the number of financial workers who have died allegedly by their own hand to four in the last week.
50-year-old Mike Dueker, who had worked for Russell Investment for five years, was found dead close to the Tacoma Narrows Bridge in Washington State, says AP.
Local police say he could have jumped over a fence and fallen 15 meters to his death, and are treating the case as a suicide.
Dueker was reported missing by friends on January 29, and police had been searching for him.
A Sheriff’s spokesman said investigators learned that he was having problems at work but did not elaborate.
Jennifer Tice, a company spokeswoman declined to comment, however said, that Dueker was in good standing at Russell.
“We were deeply saddened to learn today of the death,” Tice said in an e-mail on Friday. “He made a valuable contributions that helped our clients and many of his fellow associates.”
Dueker joined Russell Investment in 2008. He wrote for Market Outlook financial services publications, forecasting the business cycle and the target federal funds rate. He is the creator and developer of a business cycle index that forecast economic performance published monthly on the Russell website.
He was previously an assistant vice president and research economist at the Federal Reserve Bank of St. Louis, and is ranked in the top 5 percent of published economists.
Over the past two decades he wrote tens of research papers mostly on monetary policy, according to the bank’s website.
His most-cited paper was “Strengthening the case for the yield curve as a predictor of U.S. recessions,” published in 1997 while he was a researcher at the Federal Reserve.
“He was a valued colleague of mine during my entire tenure at the St. Louis Fed,” said William Poole, the bank’s ex-president. “Everyone respected his professional skills and good sense.”
Dueker held an undergraduate degree in math from the University of Oregon, a master’s degree in economics from Northwestern University and a Ph.D. from the University of Washington.
Goldman’s Global Leading Indicator’s January reading and the latest revisions to previous months paint a significantly softer picture of global growth placing the global industrial cycle clearly in the ‘Slowdown’ phase. They add, rather ominously, While the initial shift into ‘Slowdown’ (which we first noted in October) had a fairly idiosyncratic flavor, the recent growth deceleration now looks more serious than in previous months. Of course, as we noted yesterday, Jan Hatzius us rapidly bringing his optimistic forecasts back to this slowdown reality.
Swirlogram solidly in “slowdown” phase…
Via Goldman Sachs,
The January reading and the latest revisions to previous months paint a significantly softer picture of global growth and the GLI now locates the global industrial cycle clearly in the ‘Slowdown’ phase.
Comments »“Viviane Reding, the vice president of the European Commission, has made it abundantly clear that her vision is to create and enforce a United States of Europe, and the upcoming election of 751 delegates to the European Parliament in May is just the time to accomplish the task. Said Reding, “We need to build a United States of Europe, with the Commission as government, and two chambers: the European Parliament, and a ‘Senate’ of Member States.”
Once enacted, the commission would reign supreme over the governments of the once-sovereign nations of Europe, and the European Parliament members (MEPs) would supersede the authority of parliament members of the various national governments. And now is the time, declared Reding:
This debate is moving into the decisive phase now. In a little more than four months’ time, citizens across Europe will be able to choose the Europe they want to live in.
There is a lot at stake. The outcome of these elections will shape Europe for years to come.
And then she acknowledged why such a big push for a supranational regime is needed: the growth of the Euroskeptics who see what she is planning and don’t like it one bit. “This will be our best weapon against the Euroskeptics: to explain to our citizens that their vote really matters,” Reding noted.
It’s going to be close. The harder Reding and her comrades push toward a political union with teeth, the more her efforts are being resisted. Major media mouthpieces for internationalism are getting nervous and are devoting massive resources not only to explore the breadth and the depth of the euroskeptic movement, but to begin to mount counterattacks to neutralize it.
For example, Huffington Post turned loose five of their journalists to explore the extent of the Euroskeptic movement across Europe and had them report back to headquarters what they found. What they found wasn’t pretty. Peter Goodman, the leading light among them, titled his report “Skepticism and Contempt” and noted that his researchers found strong sentiments of “suspicion and even contempt” for Reding’s plans. He added:
Given abundant signs of Euroskepticism from London to Berlin, this once-every-five years electoral exercise appears to be shaping up as no less than a referendum on the merits of continuing on with the European Union itself….
Distrust about the treaties and conventions that hold together modern Europe appear[s] to be at an all-time high … [which is] fueling a drive to reclaim national identities.
The Economist devoted nine pages to that growing unrest in its January 4 article….”
Comments »“In 1928, just as income inequality was surging, stocks were soaring and monetary distortions were rearing their ugly head, the now infamous words“a chicken in every pot and a car in every garage” were integral to Herbert Hoover’s 1928 presidential run and a “vote for prosperity,” all before the market’s epic collapse. Fast forward 86 years and income inequality is at those same heady levels, stocks are at recorderer highs, the President is promising to hike the minimum wage to a “living wage” capable of filling every house with McChicken sandwiches and now… to top it all off – Maserati unveils their (apparent) “everyone should own a Maserati” commercial. It would seem that chart analogs are not the only reminder of the pre-crash era exuberance and its recovery mirage and massive monetary distortions.
The last time the top 10% of the US income distribution had such a large proportion of the entire nation’s income was the 1920s – a period that culminated in the Great Depression and a collapse in that exuberance.

…”
Comments »