iBankCoin
Joined Nov 11, 2007
1,458 Blog Posts

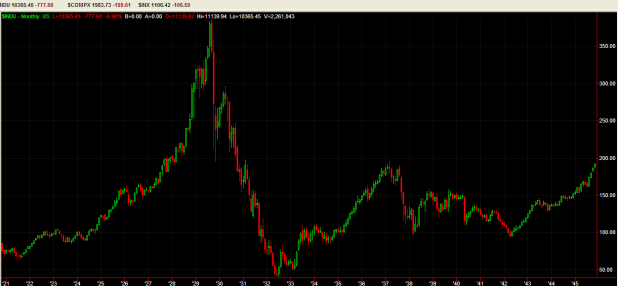
Dow Jones Charts: 1921-1945

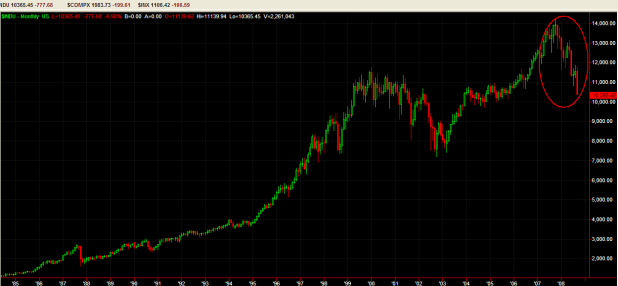
Comparing the current top (below, circled in red) with the 1929 top (above) clearly shows just how bad things can actually get. If we are to experience a prolonged meltdown, it appears the indexes have the potential to fall a lot farther than anyone is even imagining.

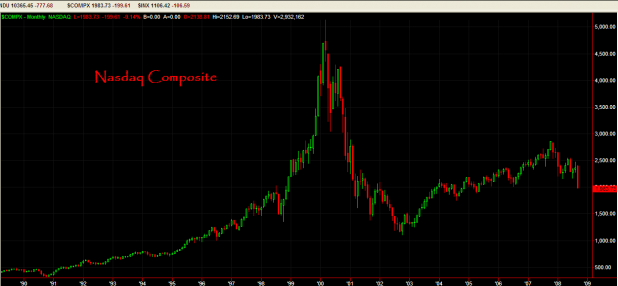
Update: I added the Nasdaq Composite chart at the very top as requested in the comments section.

From the top in 1929 to the bottom, the Dow Jones lost almost 90%. Were something similar to happen today, we would be seeing the Dow Jones print 1620.

Seeing a 50% drop from the October 2007 top seems more likely. I would not be surprised to see the Dow Jones print somewhere as low as 7,000-8,000.

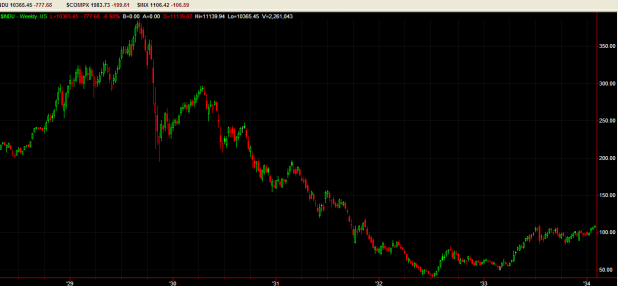
I included this weekly look at the Depression Top for some comparison to the current top. Again, current charts look like they still have a ways to go.

Comments »

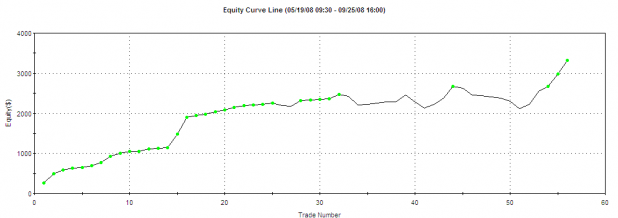
Strategy Trading Account at New YTD High

This strategies traded in this account are derived entirely from technical analysis. I strive to trade the account completely mechanically. This month I implemented a new short-selling strategy. The short strategy has triggered 2 trades, both of which were winners.

I expect that once the market digests the bailout, the strategies will begin to signal several trades a week. The past month or so has been very slow.

Due to the nature of the market over the past few months, I still have not utilized 100% of the capital in this account. Once I feel comfortable increasing position sizes enough to deploy all of my capital, I fully expect these strategies to earn better than 30% per year.

  All Trades Long Trades Short Trades
Total Net Profit $3,319.63 $2,667.84 $651.79
Gross Profit $4,546.37 $3,894.58 $651.79
Gross Loss ($1,226.74) ($1,226.74) $0.00
Profit Factor 3.71 3.17 n/a
       
Total Number of Trades 56 54 2
Percent Profitable 75.00% 74.07% 100.00%
Winning Trades 42 40 2
Losing Trades 14 14 0
Even Trades 0 0 0
       
Avg. Trade Net Profit $59.28 $49.40 $325.89
Avg. Winning Trade $108.25 $97.36 $325.89
Avg. Losing Trade ($87.62) ($87.62) $0.00
Ratio Avg. Win:Avg. Loss 1.24 1.11 n/a
Largest Winning Trade $421.02 $421.02 $340.79
Largest Losing Trade ($219.00) ($219.00) $0.00
Largest Winner as % of Gross Profit 9.26% 10.81% 52.29%
Largest Loser as % of Gross Loss 17.85% 17.85% n/a
       
Max. Consecutive Winning Trades 25 25 2
Max. Consecutive Losing Trades 7 7 0
       
Total Commission $100.31 $96.31 $4.00
       
Return on Initial Capital 6.64%    
Annual Rate of Return 18.16%    
Buy & Hold Return -1.67%    
Avg. Monthly Return $663.93    
Std. Deviation of Monthly Return $717.13    
       
Trading Period 4 Mths, 7 Dys, 6 Hrs, 29 Mins    
Percent of Time in the Market 55.52%    
Time in the Market 2 Mths, 10 Dys, 18 Hrs, 33 Mins    
Longest Flat Period 13 Dys, 21 Hrs, 28 Mins    
       
Max. Equity Run-up(Daily) $3,321.63    
Date of Max. Equity Run-up 9/24/2008 16:00    
Max. Equity Run-up as % of Initial Capital 6.64%    
       
Max. Drawdown(Daily)      
Value ($1,687.00) ($1,687.00) ($107.38)
Date 7/24/2008 9:30    
as % of Initial Capital 3.37% 3.37% 0.21%
Net Profit as % of Drawdown 196.78% 158.14% 606.99%
       
Max. Drawdown(Trade Close)      
Value ($555.34) ($555.34) $0.00
Date 8/29/2008 9:30    
as % of Initial Capital 1.11% 1.11% 0.00%
Net Profit as % of Drawdown 597.77% 480.40% n/a
       
Max. Trade Drawdown ($413.06) ($413.06) ($261.45)


Comments »

20/50 Cross: A Simple System for Trading the Russell 2000

With the markets in limbo,  I’ll just continue to look at simple trading systems. This one will again use the Russell 2000 Small Cap Index, for no other reason than I already had the symbol up on my platform after running last night’s study, The Golden Cross: A Simple System for Trading the Russell 2000.

Entry Rules:

If the 20dma average crosses above the 50dma from below, buy the next open.

10,000 starting equity and 10,000 per trade.

Exit Rules:

If the close is less than the 60dma, sell the next open.

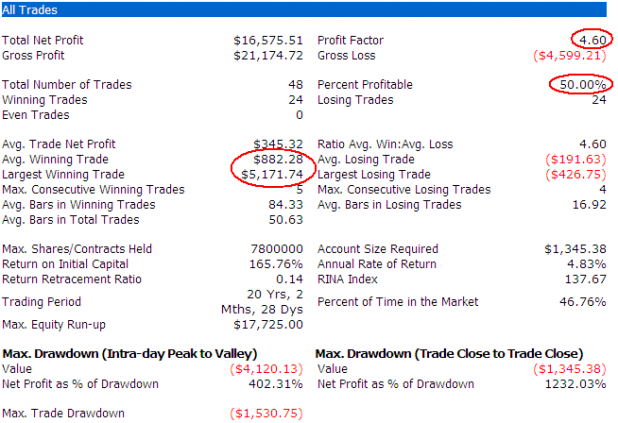
Results:

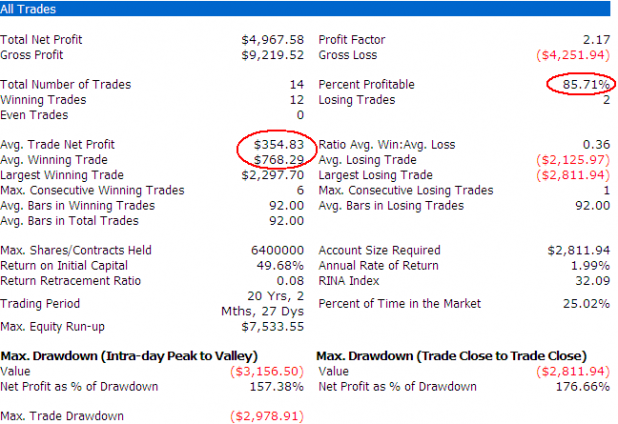
It should be noted that one of the losses occurred because the 20/50 cross was only in effect for a few days. Because it was a very weak cross, the price was not above the 60dma when the trade was entered. This made the exit difficult as price had to eventually trade above, and then back below the 60dma before a sell signal was issued.

This system is good at catching long trends, as the “avg. bars in winning trades” and “largest winning trade” show. It is also very good at keeping losers small, with most losers equaling around 2% of initial equity.

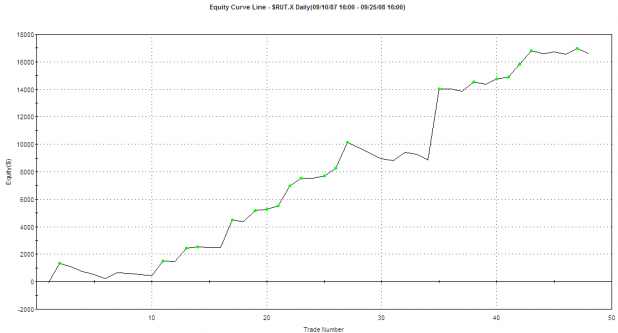
The system just closed a losing trade in September, but caught the bulk of the uptrend from April through June.

As always, these simple systems should be easy to improve.

Equity Curve:


Comments »

The Golden Cross: A Simple System for Trading the Russell 2000

On Thursday, September 18th, the Russell Small Cap Index generated a technical buy signal when the 50 day moving average (dma) crossed over the 200dma from below. This moving average cross is typically labeled a Golden Cross.

Has this signal truly been golden, for technical traders?

Entry Rules:

If 50dma crosses the 200dma from below, buy next market open.

$10,000 per trade.

Exit Rule:

If the close is less than the 50dma, sell next market open.

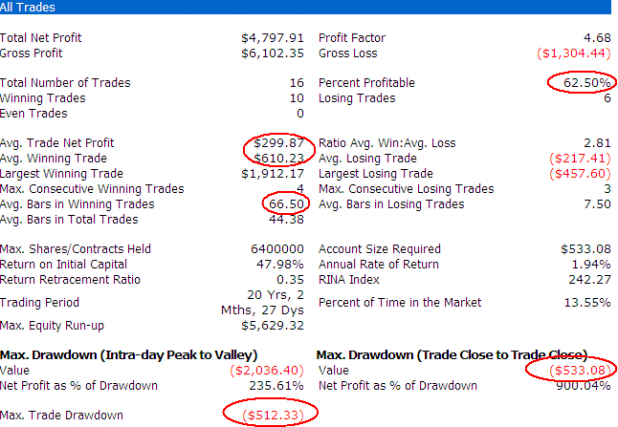
Results:

It seems the Golden Cross can be a profitable entry signal, at least on the Russell.

What if we use a time-based exit, instead of the previous moving average-based exit?

Exit Rules:

Exit after being in the trade 90 days.

(90 days was a fairly random number, although I knew that moving average systems like this one typically favor longer hold times.)

Highlights of the time-based exit include a high win ratio and a high intraday drawdown. Profits increased marginally over the moving average exit, with the tradeoff coming in the form of much larger losing trades.

It seems the Golden Cross does typically lead to higher prices, and may offer an early clue that a market rally is near.

The chart below shows the recent Golden Cross.

Note that had the signal been acted upon on Friday, that the first exit rule (exit the next day after a close beneath the 50dma) would have triggered on Tuesday, which means a sell order was placed for this morning.


Comments »

U.S. OH!

The U.S. is looking to sell a 700 Billion Dollar Secondary Offering. As with any secondary, the deal is dilutive. It should not be suprising then to see Oil rallying, since it is priced in dollars.

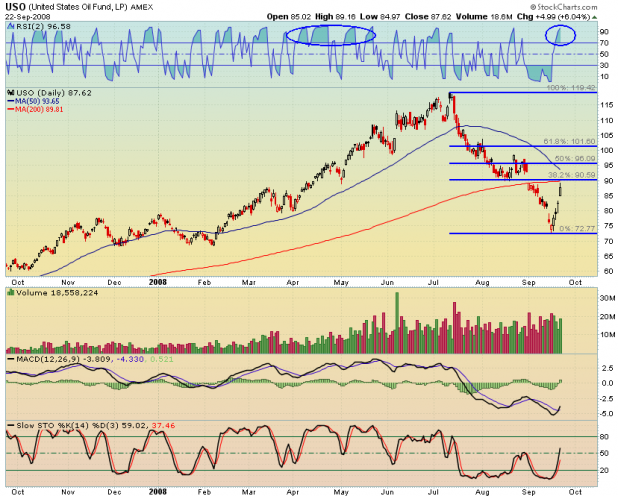
Still, I see lots of resistance just above today’s close in Oil. The technicals have me betting on a pullback. RSI(2) is overbought, but note that there have periods in April and May when USO stayed overbought for many days. There is also the 38.2% Fib, the declining 50 Day Average, and the 200 Day Average acting as overhead pressure.

Be careful, though. Should [[USO]] blast through the overhead resistance, there should be no doubt at all about which side of the trade to be on.

As for the rest of today’s action, volume was minimal. I do not put a lot of weight on today’s action due to the low volume. My post from last night is still fresh and the wisdom contained within still stands.

Comments »

Do Or Die? Indexes Close Beneath Heavy Resistance

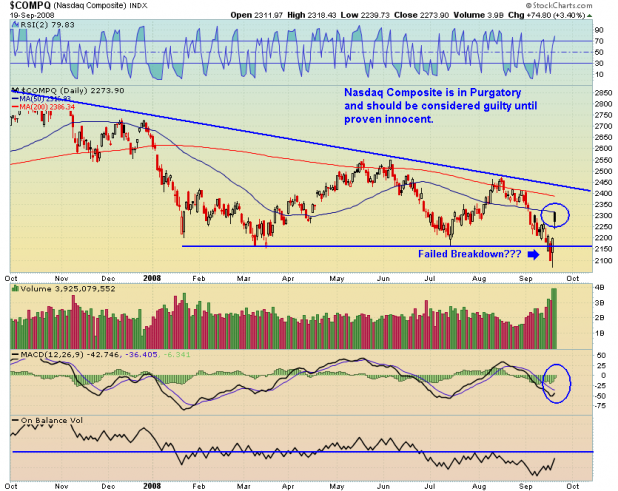
While I’m bullish on the next few weeks, the indexes should be considered guilty until proven innocent, as they are trading beneath heavy resistance and are still within the confines of a year-long declining ranges and channels.

The Nasdaq hit hard underneath the 50 day average and closed lower. Only the recent intervention saved the index from breaking down out of a descending triangle. Despite Gov’t intervention, January, March, and July lows are still support, and should not be breached. Should these low get broken, the Armageddon Trade will again be in play.
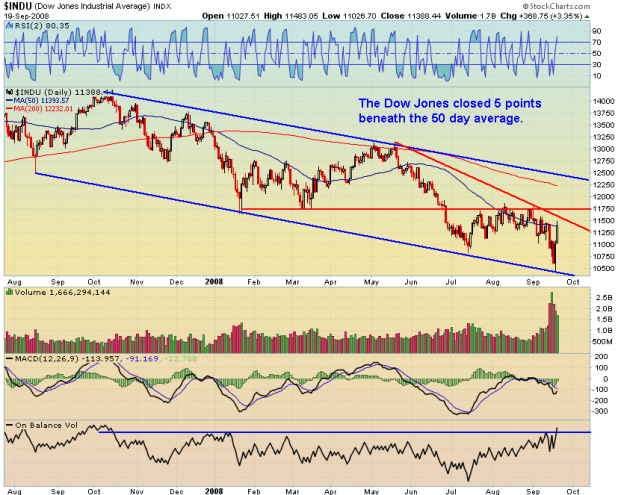
The Dow Jones is sitting beneath multiple areas of resistance: The January and March lows, the August highs, the recent downtrend line (in red), and the 50 day average. Should the Dow swiftly overtake these areas of resistance, the Bulls will have showed some conviction, and a run to the upper channel line is likely.

The Dow is clearly trading within a declining channel. While the swings should continue to be in play, I would not give the All Clear, All Bullish signal until the Dow can break above the upper channel line.

Note the OBV attempting a new 52 week high.
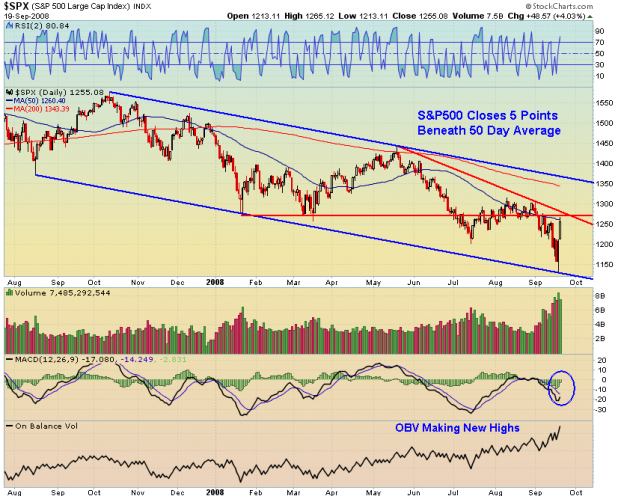
The chart of the S&P and the Dow Jones are very similar in terms of resistance.  It too trades within a declining channel.

Note the OBV making new highs. I’m not quite sure what to make of that.
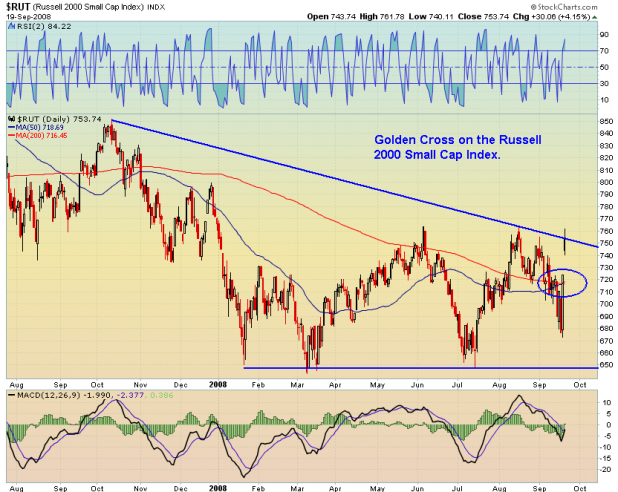
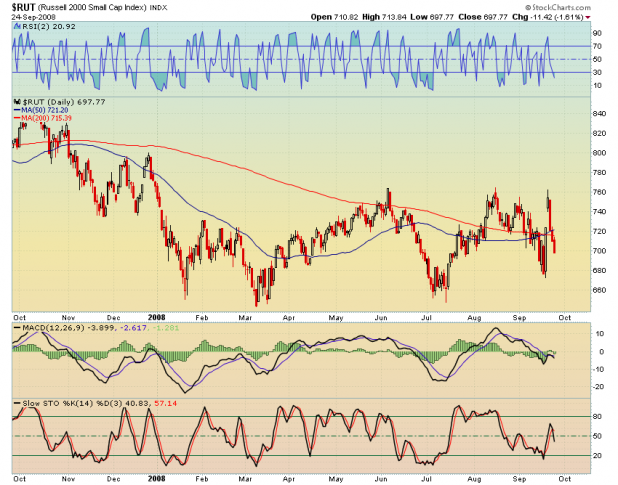
The Russell 2000 Small Cap Index is the best-looking of the group, although it too failed to make it above the level of 760, where it was also denied in June and August.

Note the Golden Cross.

The totality of the situation is that all the indexes have to stay strong, at this level. The MACD has not even crossed the 0 line, on any of the indexes. All the indexes are closer to overbought than oversold, on a short-term basis, although they can certainly move up another day or two before I’d consider them overbought. Because of this, I’m expecting some attempt at follow through on Monday and a pullback Tuesday with some stabilization the rest of the week.

This is do or die time. While I expect some weakness and pullbacks, the indexes must overcome resistance  quickly, or I expect that the Armageddon Trade will be jump-started. Save for an interest rate cut, the government is absolutely out of bullets. The indexes have a lot of important work to do, as should they begin heading for the recent lows, it will absolutely be a catastrophe, and I will not be surprised to see a 10-20% move lower.

Comments »