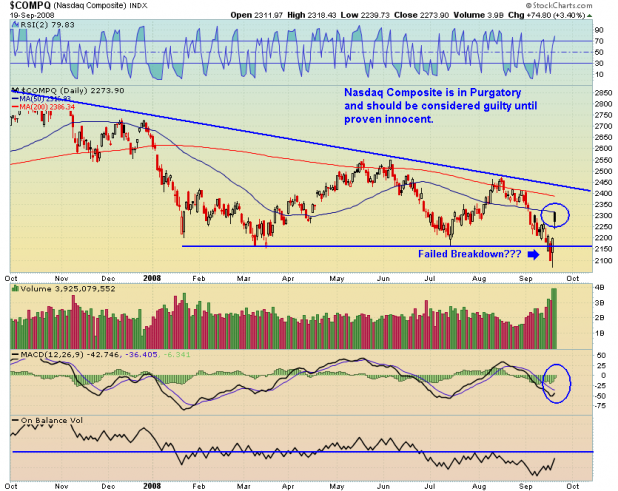
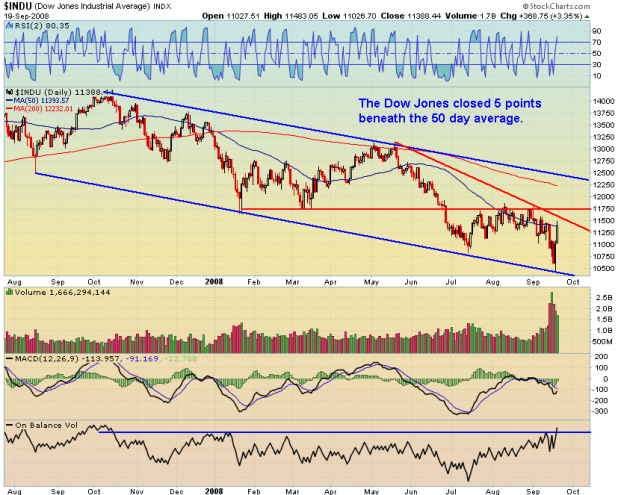
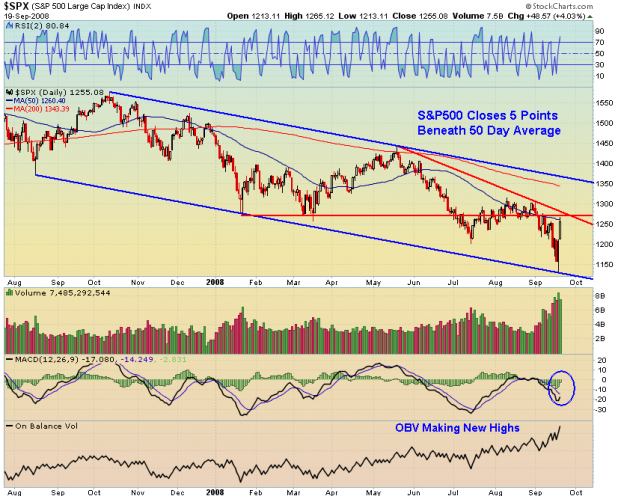
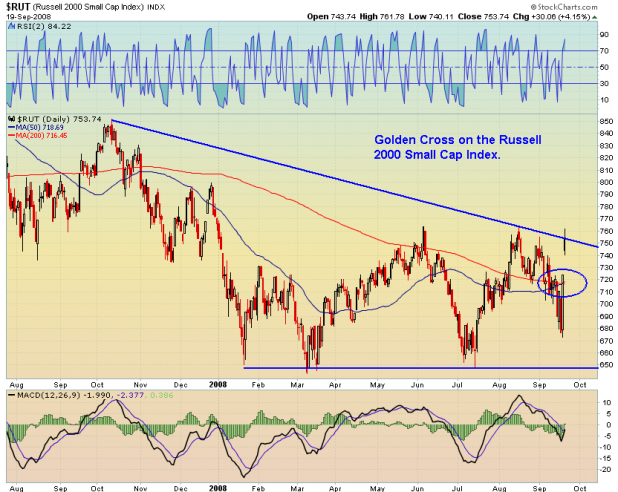
While I’m bullish on the next few weeks, the indexes should be considered guilty until proven innocent, as they are trading beneath heavy resistance and are still within the confines of a year-long declining ranges and channels.
The Nasdaq hit hard underneath the 50 day average and closed lower. Only the recent intervention saved the index from breaking down out of a descending triangle. Despite Gov’t intervention, January, March, and July lows are still support, and should not be breached. Should these low get broken, the Armageddon Trade will again be in play.
The Dow Jones is sitting beneath multiple areas of resistance: The January and March lows, the August highs, the recent downtrend line (in red), and the 50 day average. Should the Dow swiftly overtake these areas of resistance, the Bulls will have showed some conviction, and a run to the upper channel line is likely.
The Dow is clearly trading within a declining channel. While the swings should continue to be in play, I would not give the All Clear, All Bullish signal until the Dow can break above the upper channel line.
Note the OBV attempting a new 52 week high.
The chart of the S&P and the Dow Jones are very similar in terms of resistance. It too trades within a declining channel.
Note the OBV making new highs. I’m not quite sure what to make of that.
The Russell 2000 Small Cap Index is the best-looking of the group, although it too failed to make it above the level of 760, where it was also denied in June and August.
Note the Golden Cross.
The totality of the situation is that all the indexes have to stay strong, at this level. The MACD has not even crossed the 0 line, on any of the indexes. All the indexes are closer to overbought than oversold, on a short-term basis, although they can certainly move up another day or two before I’d consider them overbought. Because of this, I’m expecting some attempt at follow through on Monday and a pullback Tuesday with some stabilization the rest of the week.
This is do or die time. While I expect some weakness and pullbacks, the indexes must overcome resistance quickly, or I expect that the Armageddon Trade will be jump-started. Save for an interest rate cut, the government is absolutely out of bullets. The indexes have a lot of important work to do, as should they begin heading for the recent lows, it will absolutely be a catastrophe, and I will not be surprised to see a 10-20% move lower.


OEW Weekend Report:
“Continuing with our long term forecast of an ABC five year bear market. We had anticipated that Primary wave A would last about one year. This would be followed by a major retracement of that decline, Primary wave B, and it would last about 6 months or so. Only to be followed by a prolonged three year decline into the eventual Cycle wave II bottom. Since Primary wave A appears complete at SPX 1134, we can now project a multi wave rally that should retrace about 61.8% of the entire decline thus far. Applying Fibonacci: the 1576 high minus the 1134 low equals 442 points; and 0.618 times 442 equals 273 points; then 273 plus 1134 equals SPX 1407. Since we have an OEW pivot at 1410 that should be the target for Primary wave B. As noted, Primary wave B should take about six months or more to unfold. It should also advance in a three wave structure, but these waves should be of a Major wave degree. All we await now is OEW confirmation of the new uptrend.
Thanks 8.
continued:
“some estimates for the waves of Primary B. Since Primary wave A bottomed at 1134, adding the 170-180 range gets us near to the 1316 OEW pivot. Since the market has already rallied 131 points in one day, that target may be a bit shortsighted. Next we would be adding the 240-250 range to 1134, and that gets us near the 1383 OEW pivot. This would suggest a double top type of formation for Primary wave B, if it is to conclude at SPX 1410. Therefore for now, SPX 1316 should be our target for this uptrend, with a possibility of SPX 1383.”
“On friday the SPX gapped right over the 1219 and 1240 pivots at the open, then ran into resisitance at the 1261 pivot. On both pullbacks it found support at the 1240 pivot. Typically during a kickoff like this short term momentum should get extremely overbought before any substantial pullback occurs.”
Some numbers for you to monitor Wood …. thanks for your reports!
Have to agree with Fly that the $1 trillion is an event that changes everything …. we may retest but for now we go higher.