iBankCoin
Joined Nov 11, 2007
1,458 Blog Posts

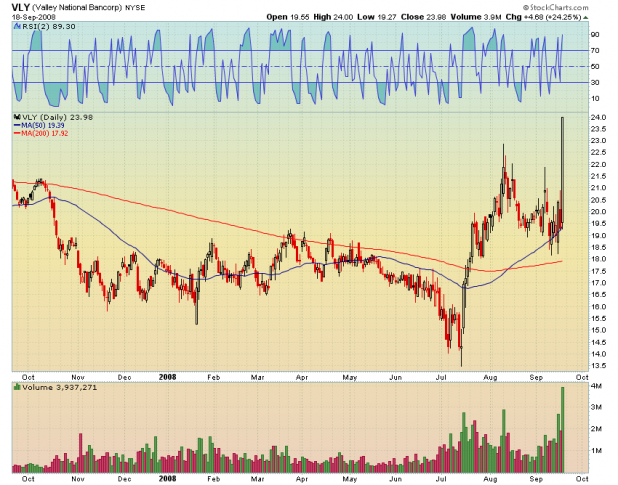
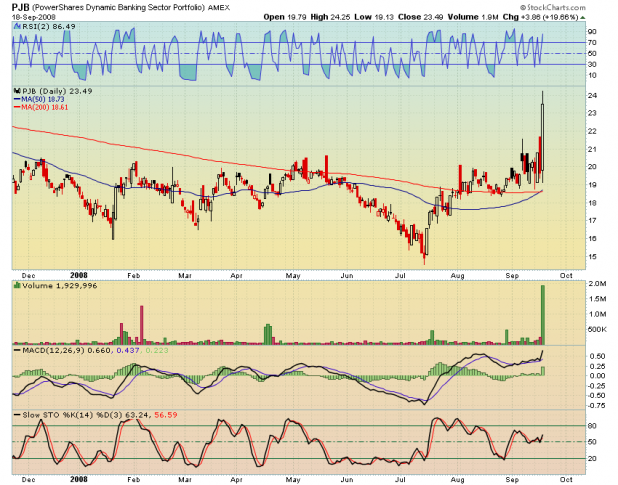
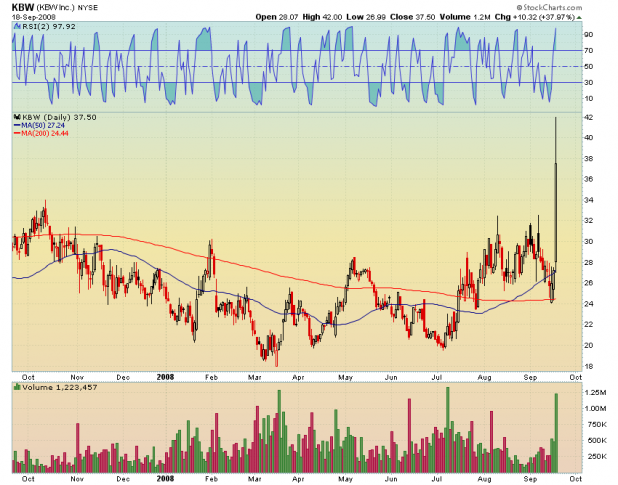
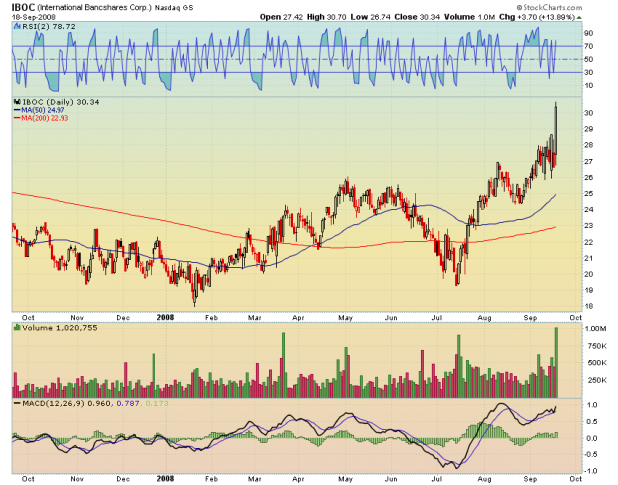
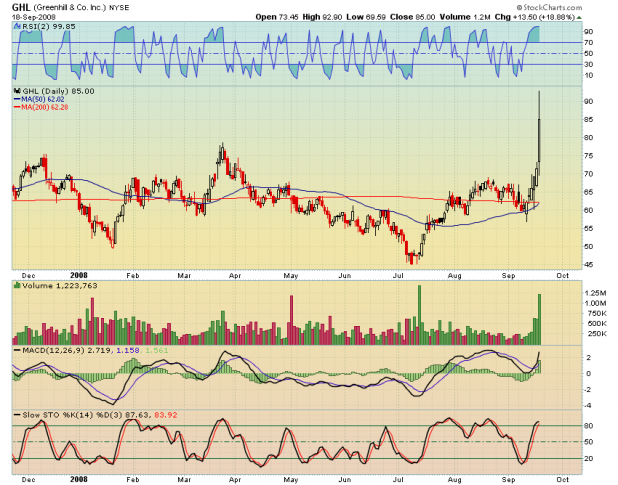
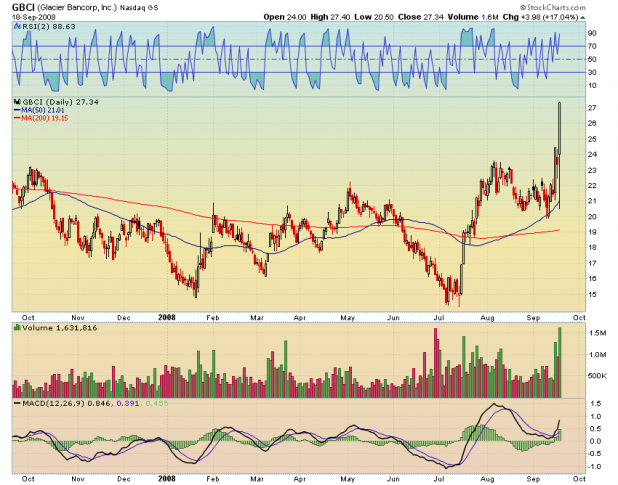
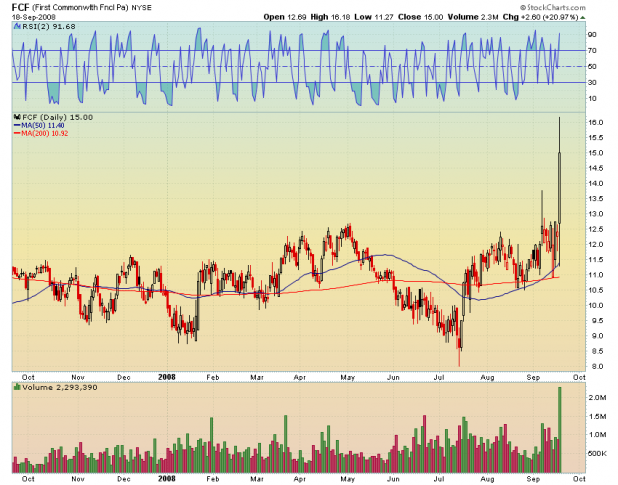
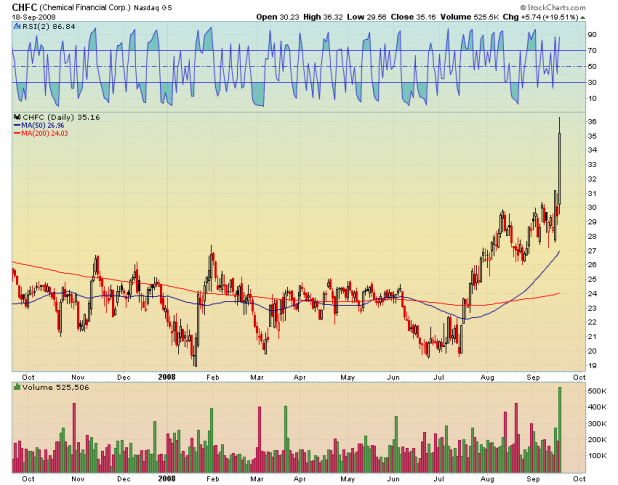
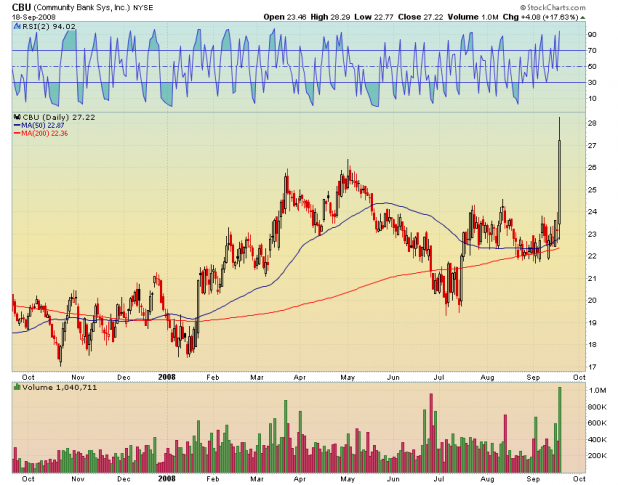
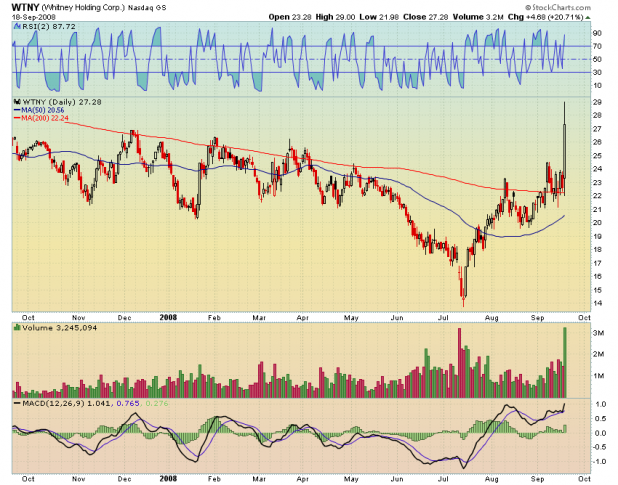
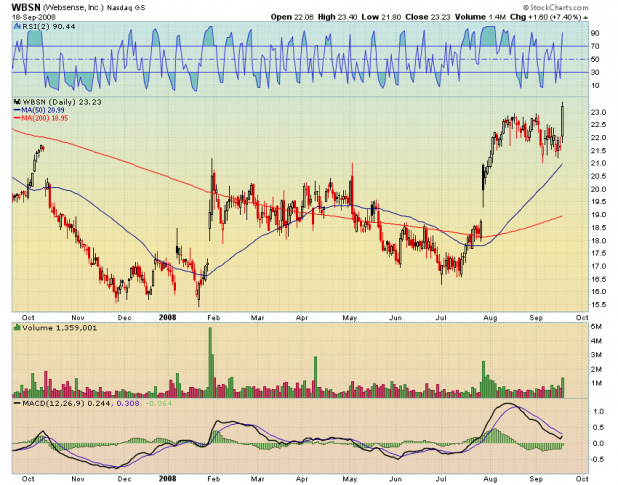
12 Huge Breakouts On Volume

Most of these are financials that you’ve likely never heard of. I think there is the potential for short term gains in these, provided you get your profit on within a couple of days, and honor tight stops beneath the entry price.

Valley National Bancorp [[VLY]]

[[PJB]]

KBW, Inc. [[KBW]]

International Bancshares Corporation [[IBOC]]

Greenhill & Co., Inc. [[GHL]]

Glacier Bancorp, Inc. [[GBCI]]

First Commonwealth Financial [[FCF]]

Chemical Financial Corporation [[CHFC]]

Community Bank System, Inc. [[CBU]]

Whitney Holding Corp. [[WTNY]]

Websense Inc. [[WBSN]]

Northwest Natural Gas [[NWN]]

Comments »

Breadth Indicator Still Not Bottoming

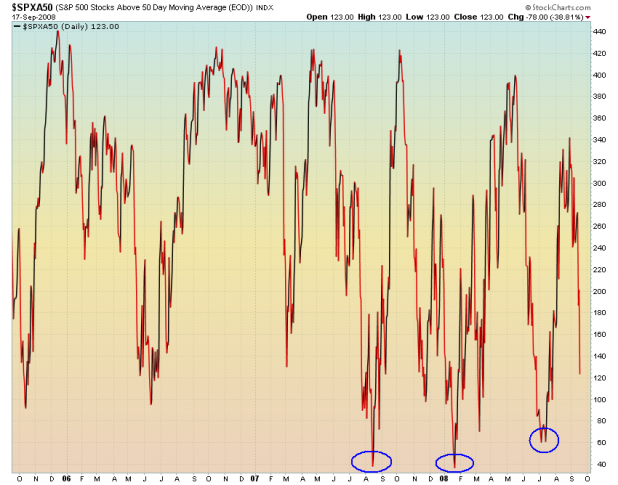
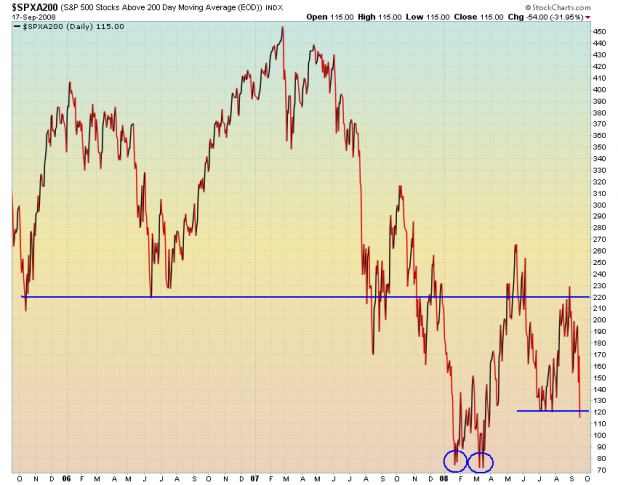
Last night, as I was in the middle of my analysis, I pulled up two charts: Number of SPX stocks trading above their 50 day averages, and number of SPX stocks trading above their 200 day averages. What I found was confusing and unsettling: Neither chart showed breadth to be even close to a bottom.

Keep in mind that Danny’s Legend of Vance Bagger indicator is derived in part from the number of stocks trading above or below their 50 day averages. It should make sense why Danny has almost been screaming that the bottom is not yet near.

It would have been very wise for me to delve into the unsettling feeling these charts gave me last night, as I would have likely postponed my “This Is A Tradeable Bottom” post ’til a later date. Alas, humility is good for the soul, but not as good for the account balance.

The chart above shows that 78 stocks on the S&P500 dropped from above their 50 day average to beneath the average. Should a similar number of stocks move below the 50 day tomorrow, this breadth indicator will register a level that existed during the August 07, January 08, and July 08 bounces. This is circled on the chart.

This chart is the number of stocks on the S&P500 trading above their 200 day moving averages. Last night it closed with near 150 stocks still trading above the 200 day, which was good enough for August 07, but not good enough for September 08. Today, the S&P500 had 54 stocks kicked beneath the bear market average. While this Summer found this breadth indicator reversing at today’s level, It appears to me that another 60 stocks need to get knocked down for this indicator to be near the January and March bounce levels, which are circled.

I do not currently have data for previous bear markets, for these two measures of breadth. They may have ventured lower than where they bounced in January, during previous bear markets.

Comments »

NO Tradeable Bottom

I was dead wrong. Fly was right, as usual.

I made my first discretionary trades in over a month today. I was able to get out of work to come home and watch the action. I ended up buying [[DXD]] and [[SDS]] .

The market is very sick. Fed action is likely. I feel the likelihood of a crash is very high.

More analysis to come later this evening.

Comments »

Update to Stretched VIX Strategy

I posted the Stretched VIX strategy last night. Frankly, I made an error as I accidentally selected the wrong version of the VIX, for data. What can I say? I clicked on the wrong symbol on the list when setting up the strategy. While the study is valid, I have now updated it using the VIX data that we have all come to know and love.

The updated study has better results, and has more data points.

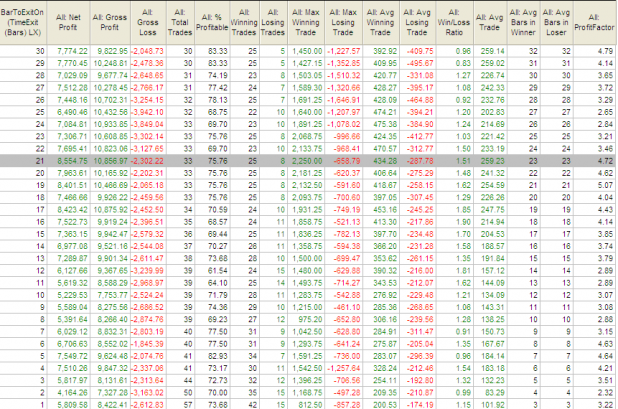
First, look at the above spreadsheet and note that the edge exists for a few weeks after the entry signal.

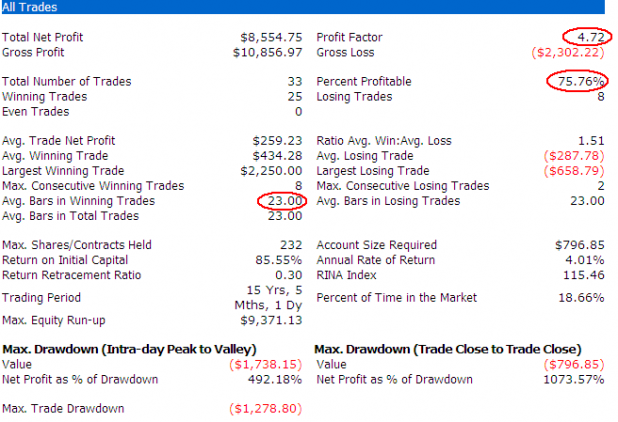
And below are the system statistics. Assume 10K per trade, with 10K starting equity.

I think the statistics are acceptable for a simple system with an entry edge and a very simple time exit.

Now the data reflects twice the trades, with the first trade triggering in 1994. It is certainly closer to robust than what I posted yesterday.

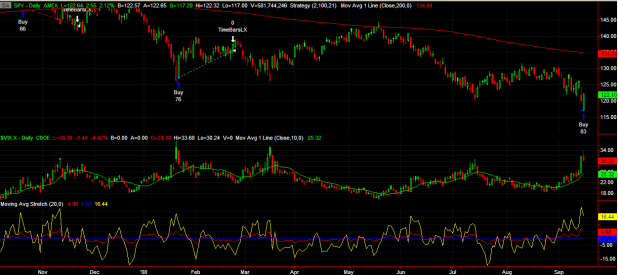
And finally, a look at a previous trade from start to finish, as well as today’s entry.

My simultaneous thanks and apologies to Rob Hanna from Quantifiable Edges for borrowing his preferred report format for these studies.


Comments »

This Is A Tradeable Bottom

In between now and the next crisis, before the street begins to see how the slowdown in consumer spending and the crash in commodities will affect earnings, there is going to be a rally. I believe that today was the first day of it, and that tomorrow will follow-through in stupid celebration of the 85 billion dollar insurance policy the gov’t just bought on American International Group, Inc. [[AIG]] .

I published a strategy last night, Stretched VIX Strategy Signals Buy the Spy, that showed that yesterday’s level of fear tends to result in a tradeable bounce. The edge from this strategy tends to diminish after 12 days.

I figure we have a week or two of rallying as investors celebrate cheating death. In other words, and with respect to Jake Gint, “Party like its Weimar!”

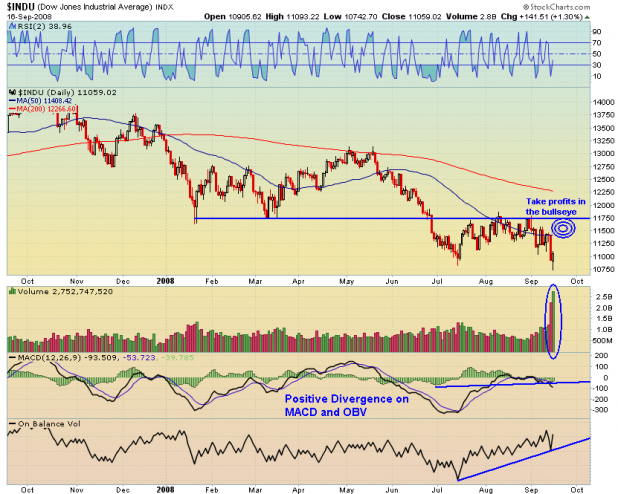
Looking at the chart of the Dow Jones, the volume surge cannot be ignored. A surge of volume on a key reversal day is a signal of capitulation. I cannot emphasize enough how important this surge of volume is for judging capitulation. Also, IBankCoin had one of the best days ever in terms of traffic, yesterday. Anecdotally, this also signals a bottom.

Also note the positive divergences in the MACD and the OBV.

Here is a quick note from investopedia on OBV: A method used in technical analysis to detect momentum, the calculation of which relates to volume to price change. OBV provides a running total of volume and shows whether this volume is flowing in or out of a given security. OBV attempts to detect when a financial instrument is being accumulated by a large number of buyers or sold by many sellers.

This suggests that since the July low, there has been continued accumulation of Dow components. Whether or not you find that believable, the divergence is very clear.

I want to be long until the Dow meets the 50 day average. By the time it meets the top of its recent range at 11,750, I want to be in cash, or building shorts.
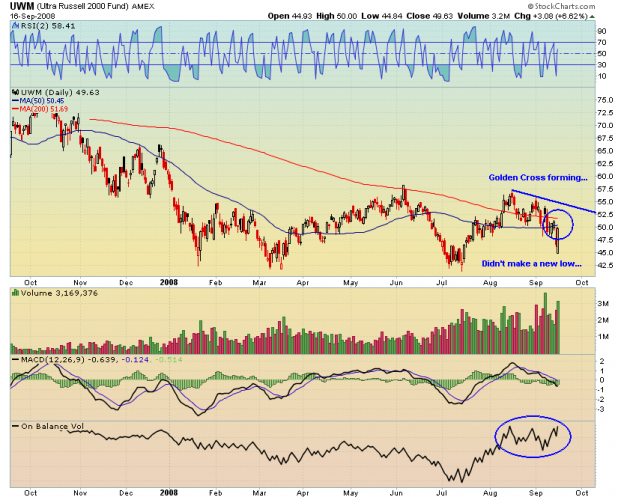
On [[UWM]] , a Golden Cross is forming and the OBV is getting ready to make new highs.
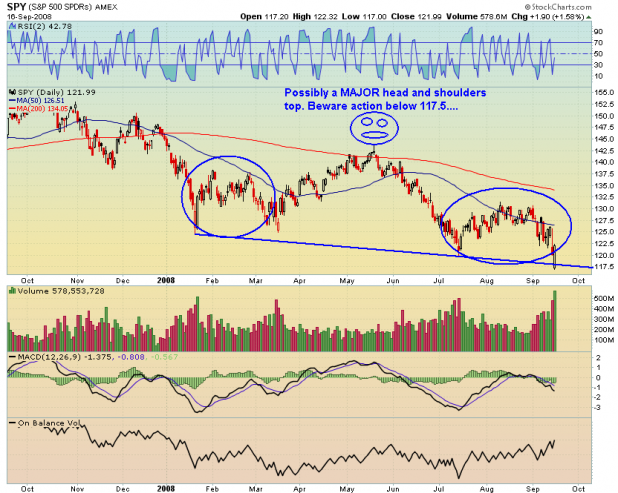
Note the volume on [[SPY]] as well as the new high in OBV. Also note the huge and scary head and shoulders. I would not be long past 127.50, nor would I be if we break 117.50.

Establish a range for profits, and stick with it. One should not be leaning too heavily in one direction as the indexes approach the boundaries of their recent ranges.

It should be very interesting from a technical perspective too see how this plays out.


Comments »

Circuit Breakers and Other Market Volatility Procedures

The major stock and commodities exchanges have instituted procedures to limit mass or panic selling in times of serious market declines and volatility. These mechanisms are known as Circuit Breakers, the Collar Rule, and Price Limits. Circuit Breakers establish whether trading will be halted temporarily or stopped entirely. The Collar Rule and Price Limits affect the way trading in the securities and futures markets takes place. Here’s a description of each one:

Circuit Breakers

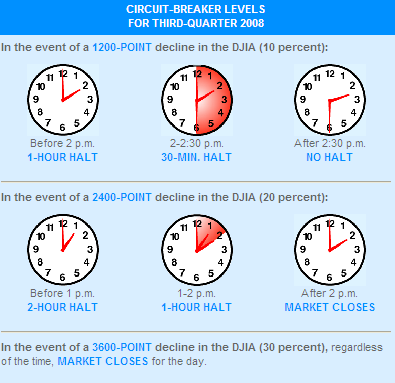
The securities and futures markets have circuit breakers that provide for brief, coordinated, cross-market trading halts during a severe market decline as measured by a single day decrease in the Dow Jones Industrial Average (DJIA). There are three circuit breaker thresholds—10%, 20%, and 30%—set by the markets at point levels that are calculated at the beginning of each quarter. The formulas for these thresholds are set forth in the New York Stock Exchange (NYSE) Rule 80B.

For example, on April 1, 2007, the average value for the DJIA for the preceding month (March 2007) was used to calculate point levels (rounded to the nearest 50 points). This resulted in the Level One (10%) circuit breaker set at 1,250 points, Level Two (20%) circuit breaker set at 2,450 points, and the Level Three (30%) circuit breaker set at 3,700 points.

Collar Rule

Under NYSE Rule 80A, if the DJIA moves up or down two percent (2%) from the previous closing value, program trading orders to buy or sell the Standard & Poor’s 500 stocks as part of index arbitrage strategies must be entered with directions to have the order executions effected in a manner that stabilizes share prices. The collar restrictions are lifted if the DJIA returns to or within one percent (1%) of its previous closing value.

The 2% collar rule threshold is set by the NYSE at a point level that is calculated at the beginning of each quarter. For example, on April 1, 2007, the average value for the DJIA for the preceding month (March 2007) was used to calculate a point level (rounded to the nearest 10 points). This resulted in the 2% collar rule threshold being set at 180 points.

Price Limits

The futures exchanges set the price limits that aim to lessen sharp price swings in contracts, such as stock index futures. A price limit does not stop trading in the futures, but prohibits trading at prices below the pre-set limit during a price decline. Intra-day price limits are removed at pre-set times during the trading session, such as ten minutes after the thresholds are reached or at 3:30 p.m. (all times are Eastern), whichever is earlier. Daily price limits remain in effect for the entire trading session. Specific price limits are set by the exchanges for each stock index futures contract. There are no price limits for U.S. stock index options, equity options, or stocks.

* * * * *

from: http://www.sec.gov/answers/circuit.htm

Trivia: The only time these triggers have been hit was on October 27, 1997.

Comments »