iBankCoin
Joined Nov 11, 2007
1,458 Blog Posts

Stretched VIX Strategy Signals Buy the SPY

With all the talk of the VIX lately, I wanted to test what would happen if one bought the SPY after a large move in the VIX.

For this strategy to signal an entry on the SPY, the VIX had to close 20% or more above its 10 day moving average. For example, today’s close on the VIX was $31.70. The 10 day moving average is $24.49. To test if this is true, we perform this calculation: (24.49)*1.2 = $29.38

The entry:

If the above condition is true, then a buy of the SPY is signaled for the next open. (This type of strategy has been referred to as a moving average stretch since the close of the VIX is essentially stretched above its moving average).

The exits:

First, a simple time exit, where one buys the SPY on day 1, holds it for 7 more days, and sells it the open of the 9th day. The 8-day hold time was arrived at through optimization, although the system works with fewer or more days held.

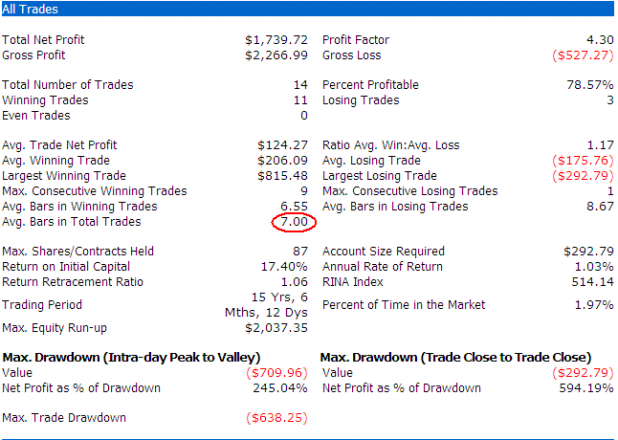
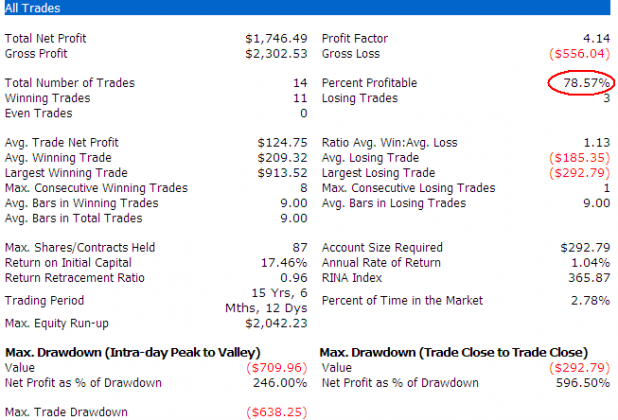
Note that the strategy doesn’t earn a huge sum of money, but with 10,000 per trade, the average trade net profit is 1.2%.

Perhaps the best way to use these results is to consider this: The first trade generated was in April of 2005. Since then, when this setup has occurred, the market has typically been higher a week or so later.

Consider that this trade is difficult to make and a quick exit may be desirable for the squeamish. Adding an exit that triggers if RSI(2) > 80 lessens the average hold time by 2 days. The results are below.

Adding the RSI(2) exit can be an effective way of keeping returns consistent while catching an earlier exit for some of the trades.

Caveats:

The first trade initiated in April of 2005. Although the report shows a 15 year trading period, the system has actually only been trading for just over 3 years. Keep that in mind when considering annual rate of return.

The number of trades is small and so this study likely does not have enough data to prove significance.

The Requisite Charts:

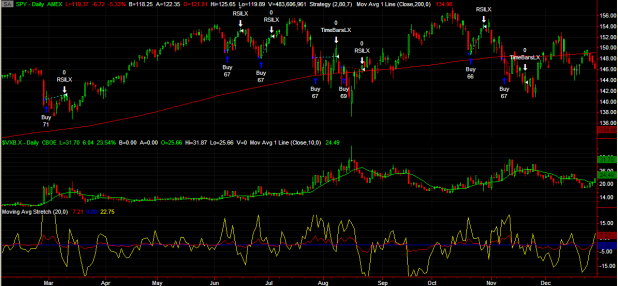
The above chart shows the [[SPY]] in the top pane, the VIX in the middle pane, and an indicator I created to show the measure of the moving average stretch. This is from 2007, which was an active time for the strategy. The VIX has the 10 day moving average charted in green.  When the yellow indicator spikes, the VIX has stretched above its moving average. A buy is then generated on the dip in the SPY.

Comments »
Don’t Get Defensive

I have a filter I use that I call the Momo Filter. For the most part, I use the filter  to identify what is working. Also, when a certain sector is working, many of the stocks in that sector will show up on the filter, making it easier to catch sector rotation. 

Many of the names in tonight’s screen are defensive plays, as one might expect. So honestly, the title of this post is a little misleading. There are some other interesting plays the screen uncovered, so I thought it was worthwhile to take a look at those too.

All in all, 135 symbols made the screen tonight. So there are stocks that are working, even in this terribly challenging environment.

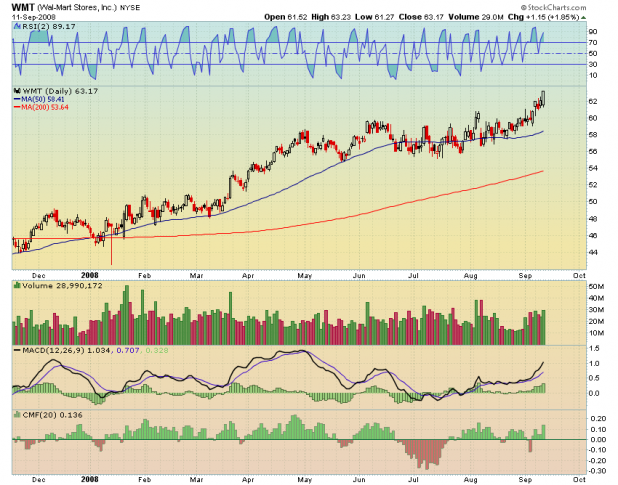
Wal-Mart Stores, Inc. [[WMT]] I posted this chart when it broke out in August. Still a beautiful breakout.

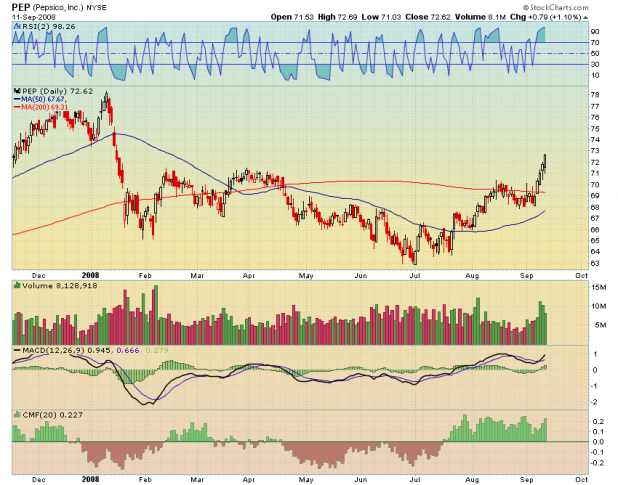
PepsiCo, Inc. [[PEP]]

The Procter & Gamble Company The Procter & Gamble Company [[PG]]

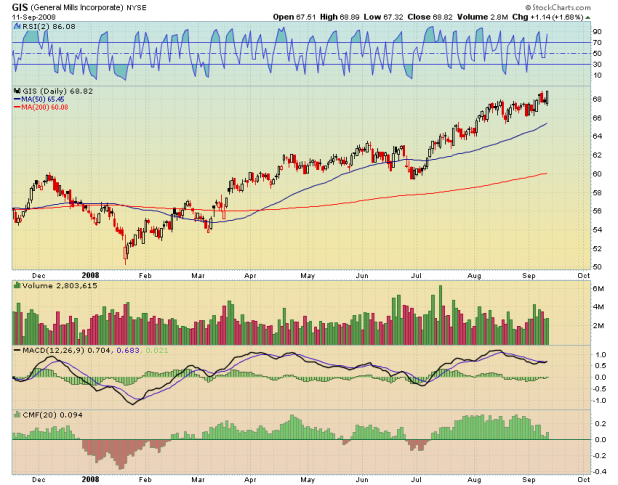
General Mills, Inc. [[GIS]] Very nice uptrend.

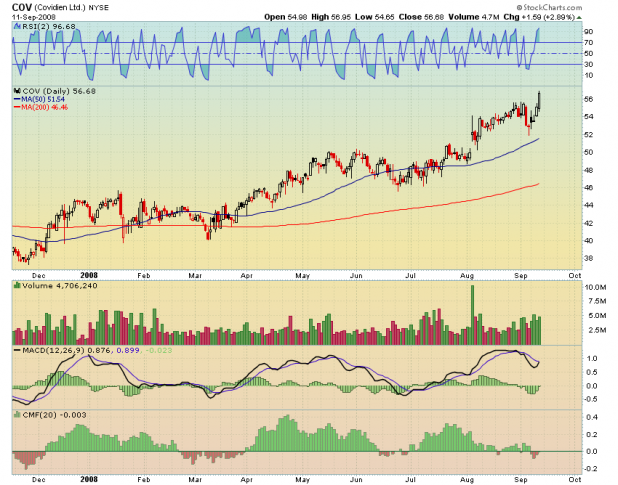
Covidien Ltd. [[COV]] Volume looks good on this one, but the MACD and CMF are both diverging.

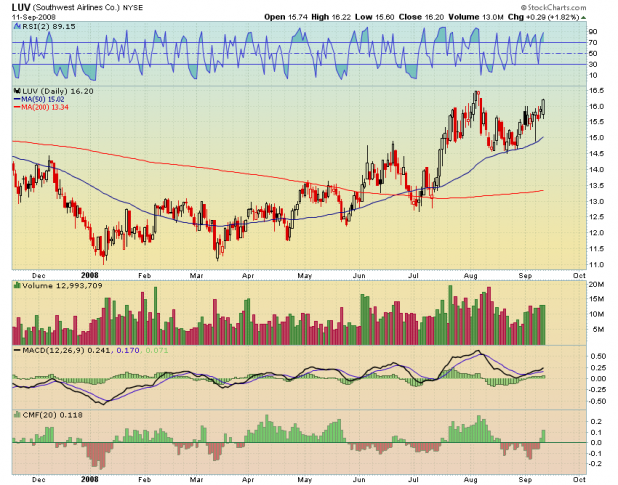
Southwest Airlines Co. [[LUV]] This one might be a good hedge for those who are long oil.

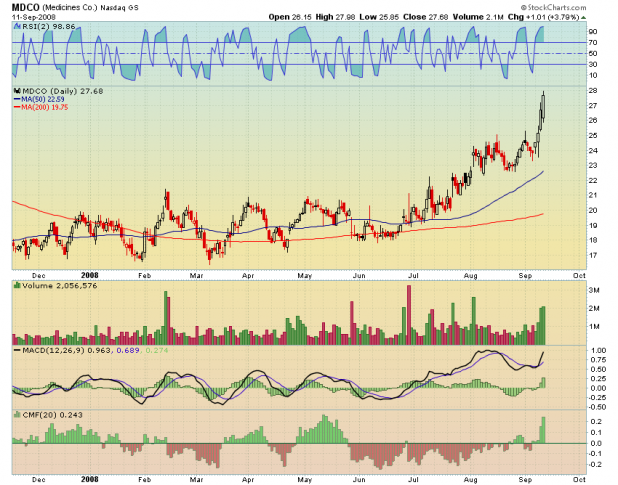
The Medicines Company [[MDCO]]

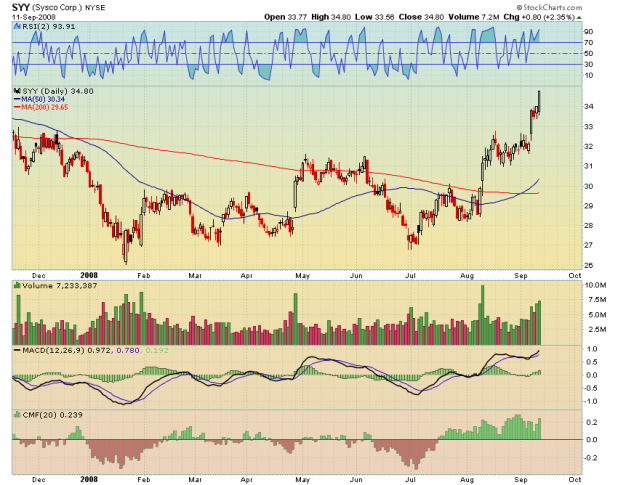
SYSCO Corporation [[SYY]] Serious accumulation here…

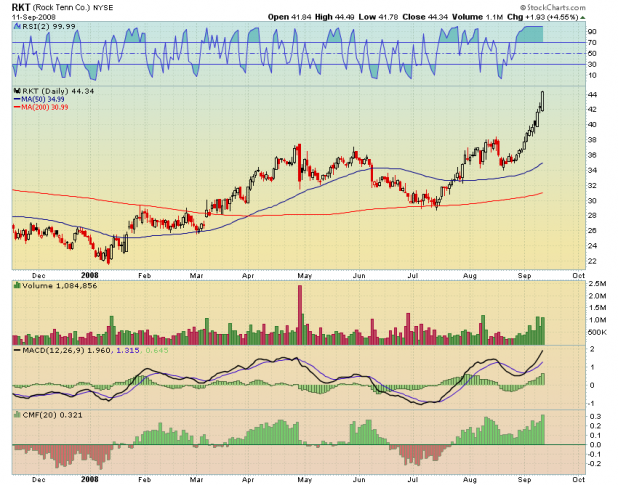
Rock-Tenn Company [[RKT]] Whoa!

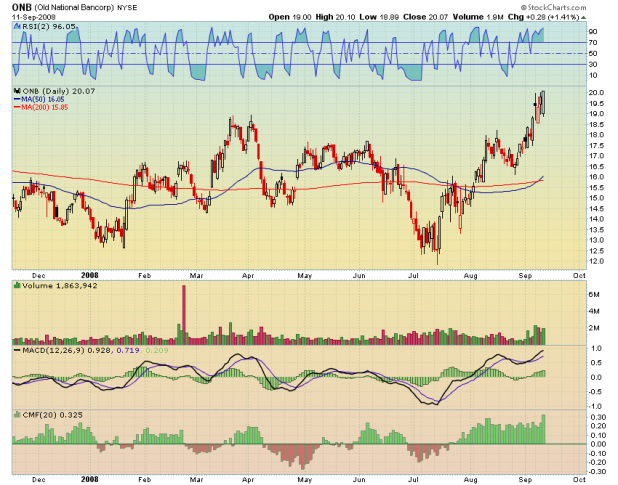
Old National Bancorp [[ONB]] I posted this one for The Fly, who left it out of his “banker’s rant” from earlier today. For some reason the name and symbol make me think of Old Nasty Bancorp, which I find highly amusing.


Comments »

Do You Want to Trade, or Get Rich?

The two can be mutually exclusive.

I have been bored lately. Simply put, I have had very few trades to make, for over a week. There just have not been any setups. Since a large part of what I trade are mean-reversion strategies, the fact that there have not been many reliable setups should have told me that the market might be in for another rough slide, a la January. Since my profits come from trading bounces and spikes, I should be in 100% cash when the market is sliding downward. I have no edge in these situations.

Still, how boring.

It was all I could do not to buy up some [[QLD]] this morning. Yes, there is a slight edge in that trade, but there are much larger edges, just around the corner. I am glad that I was able to talk myself out of creating some excitement, through trading. Had I succumbed, I would have taken one step backward away from my goal of being filthy rich. And so I don’t want to trade; I want to get rich. Or rather, I want to be sure that my trading is not getting in the way of my getting rich.

Enough self-analysis, more technical analysis.

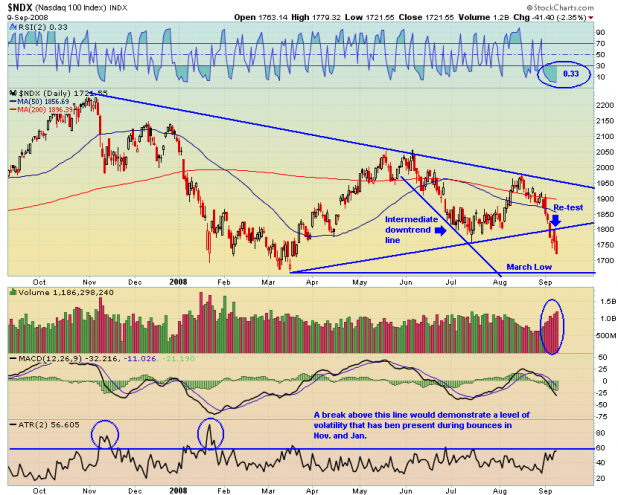
I thought it was a fairly significant technical break when I wrote about the NDX (The Nasdaq 100) breaking down from the triangle patterns. After a quick re-test of the triangle on Monday morning, the NDX reversed hard on the Fannie Mae [[FNM]] Freddie Mac [[FRE]] bailout by Comrade Pinky Paulson, and the momentum continued to the downside today.

The index is oversold on multiple daily measures including RSI(2) and number of down days in a row. The failure of the NDX to muster a bounce here should not be ignored. The weekly chart is not quite oversold which suggests there is more room to move to the downside. 

To make matters worse, the VIX is approaching a level which has seen reversals occur. If a bounce, even a 2-3 day bounce/stabilization does not take place very soon, the market could reach a level of fear which may precipitate a capitulation-style event. In simple terms, everyone realizes there will be no bounce, and selling takes over.

Note that I have added the 2-Period Average True Range. ATR(2) is a very simple yet effective measure of very short-term volatility. If volatility is a proxy for risk and fear, the NDX is approaching a level that has coincided with stabilization and bounces, since February. Should the ATR(2) on the NDX break above 57 without a bounce occurring, we will likely be experiencing a capitulation-style event.

A capitulation is not a 100% guarantee of a bottom, but it is usually associated with a counter-trend move.

Where is Support?

Of course, the March lows will be tested. The MACD shows a strong trend has developed. I see no reason why it will not carry through to the previous lows. The March lows are trenches where Bulls will likely put up some resistance. If the market blows through the lows, well, what that means should be obvious.

If the March lows are broken, start looking at Fibonacci extensions and prior lows for support. The chart shows how well the downtrend line has served as resistance (can you imagine getting short last October and having the courage to add to your position every time it bumped the line?) and so I think it makes sense to continue using trendlines to gauge support. Using the intermediate trend line, I would look for some support around 1570.

The Market Wants to Bounce

Remember, the market wants to bounce. Most investors and money managers do not actively short equities. The good managers may hedge, while not having a short-bias, but the short-biased managers are few and far between. Most of the financial world is looking high and low for a tourniquet, to stop the bleeding. The money managers who are short-biased and skillful have long since built their positions, up near that trend line I talked about. 

Its times like these when rallies can materialize out of nowhere.

Comments »

Buy Oil, Sell the Dollar?

Now, I’m no fundamental analyst. I stick with the charts and simple things such as volume and support and resistance. However, I still pay attention to what is going on around me. What I’ve been hearing is that the Middle-Eastern oil countries have been quietly discussing their falling oil revenue, and are wondering when they should cut supply. I’m also seeing that Ike looks like he could be heading towards the oil rigs in the Gulf.

I would suspect, since I’m not hearing a lot of chatter about buying Oil or Natty prior to Ike’s destruction, that the long oil / hurricane trade will likely stand a lot better chance of working than it did during Gustav.

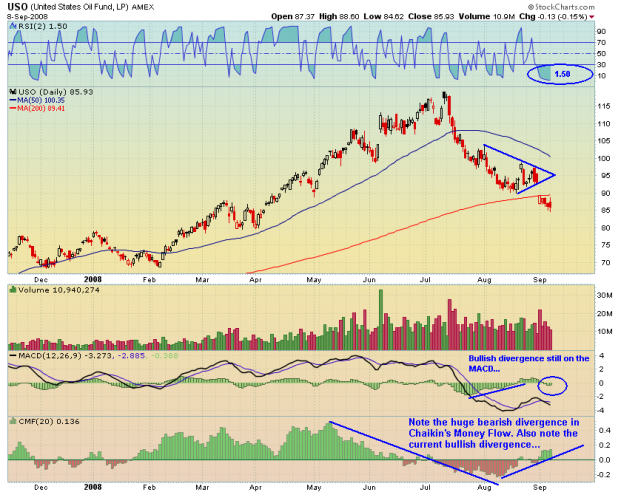
Technically speaking,  Oil is very oversold, and is showing some bullish divergences on both the MACD and Chaikin’s Money Flow. RSI(2) shows a bounce should be imminent.

Do not misconstrue my point. I’m not an Oil bull. I do not generally take the hurricane setups. I’m just saying that oil is technically due for a bounce, and with OPEC and Ike, it may come soon. A break above $90 should not be ignored.

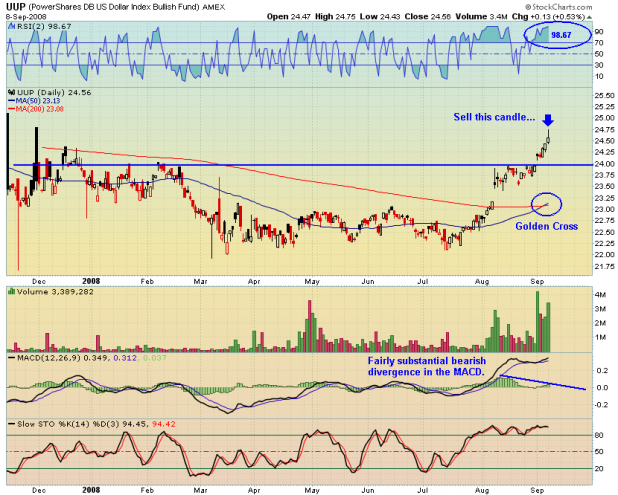
Above is the chart of [[UUP]] the long dollar ETF. It is not very difficult to see that Oil and the Dollar have been inversely correlated.

If Oil catches a bid, I expect that the Oil/Dollar relationship will continue. Currently, UUP has a quite a bearish divergence on the MACD, although volume has been outstanding. Today’s candle hints at a reversal. RSI(2) is very overbought. A trip back to $24 would not hurt anybody, and would probably be healthy.

One can get short the dollar via [[UDN]] .

Comments »

Will McCain or Obama’s Tax Policy Be Better For Your Family?

The Tax Policy Center has recently updated the Presidential Candidates’ Tax Policies. I encourage you to read the entire report:

A Updated Analysis of the 2008 Presidential Candidates’ Tax Plans: Executive Summary – August 28, 2008

The summary report is only 6 pages long and contains some helpful graphs.

For the lazy, and to aid in initiation of debate and discussion, I will parse out what I feel to be some of the more essential elements of the report.

________________________________________________________________________________________________

Both John McCain and Barack Obama have proposed tax plans that would substantially increase the national debt over the next ten years, according to a newly updated analysis by the nonpartisan Tax Policy Center.

Neither candidate’s plan would significantly increase economic growth unless offset by spending cuts or tax increases that the campaigns have not specified.

Compared to current law, TPC estimates the Obama plan would cut taxes by $2.9 trillion from 2009-2018. McCain would reduce taxes by nearly $4.2 trillion. These projections assume the 2001 and 2003 tax cuts expire in 2010 and that the Alternative Minimum Tax is fully effective with 2008 exemptions.

Both candidates prefer to compare their plans to the “current policy” baseline, which would extend the 2001 and 2003 tax cuts and indefinitely extend an indexed AMT “patch”–and collect nearly 3.6 trillion less than under current law over the coming decade, while McCain would lose $600 billion. But choice of baseline doesn’t change how the proposals would affect the budget picture; without substantial cuts in government spending, both plans would sharply increase the national debt. Including interest costs, Obama’s tax plan would boost the debt by $3.5 trillion by 2018. McCain’s plan would increase the debt by $5 trillion.

The Obama plan would reduce taxes for low- and moderate income families, but raise them significantly for high-bracket taxpayers. By 2012, middle-income taxpayers would see their after-tax income rise by about 5 percent, or nearly 2,220 annually. Those in the top 1 percent would face a $19,000 average tax increase–a 1.5 percent reduction in after-tax income.

McCain would lift after-tax incomes an average of about 3 percent, or $1,400 annually, for middle income taxpayers by 2012. But, in sharp contrast to Obama, he would cut taxes for those in the top 1% by more than $125,000, raising their after-tax income an average of 9.5 percent.

These projections are built on descriptions of the candidates’ plans provided by senior McCain and Obama staff. However, TPC has also projected costs based upon what candidates have actually said on the campaign trail, and those promises paint a quite different picture.

  •  TPC estimates that one version of McCain’s proposal to create an optional simplified individual income tax system would increase the cost of his plan by more than $1 trillion over 10 years.
  • Obama has proposed raising the payroll tax for those earning over $250,000. Again, he has not provided details, but TPC assumes this would be a 2 percent income tax surcharge on adjusted gross income. . .Such a plan would increase taxes on high-income workers by nearly $400 billion over a decade.

What About Healthcare?

In the July 23 update of its analysis, TPC added a preliminary estimate of the candidates’ health care proposals. Because the campaigns did not provide complete plans, TPC assumed certain details.

We conclude that the McCain plan, which would replace the current exclusion for employer-paid premiums with a refundable income tax credit of up to $5,000 for anyone purchasing of health insurance and make other changes to the healthcare system, would increase the deficit by $1.3 trillion over 10 years and modestly trim the number of uninsured.

The Obama plan, which would make relatively low-cost insurance available to everyone through non-group pools and subsidize premiums for low- and moderate-income households, would cost $1.6 trillion, but would also cover virtually all children and many currently uninsured adults.

TPC projects the McCAin plan would trim the uninsured by 1 million in 2009 and nearly 5 million by 2013, although their numbers would slowly rise thereafter because the tax credit would fail to keep pace with premiums. Obama would reduce the uninsured by 18 million in 2009 and 34 million by 2018. Even under the Obama plan, however, 34 million Americans would still lack insurance in 2018.

Comments »