iBankCoin
Joined Nov 11, 2007
1,458 Blog Posts

Equity Curve, Drawdown, and Trade Distributions for New ETF Trading System

Trade Distributions

It will probably be helpful to cross reference these graphs with the trade statistics published in the previous post. To make that easy, here is the link: Trade Statistics from the New ETF Trading System.

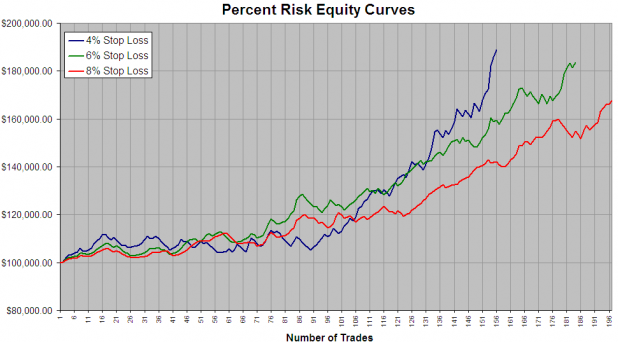
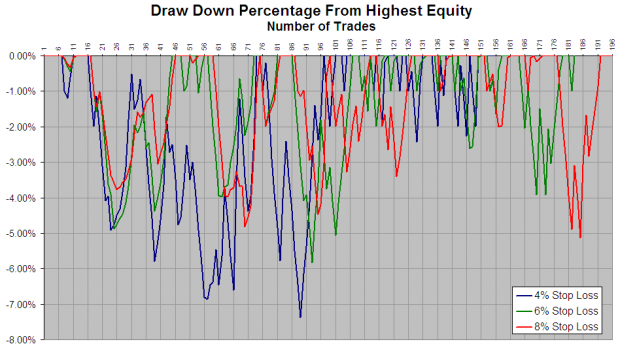
I think everything here is fairly straightforward. The equity curve does a good job of showing how the system stayed flat for over the first year we tested. Trading the strategy with a 6% stop and 1% risk may be a good way to get outsized gains with minimal drawdowns. The 4% stop is obviously the way to trade this if one can stomach larger drawdowns and is looking for absolute returns.

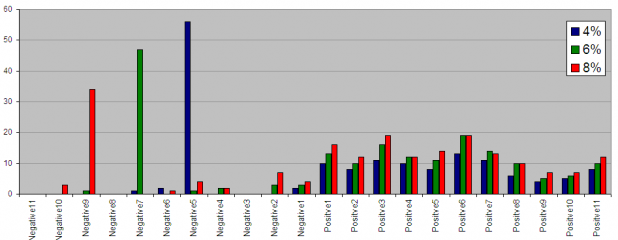
To interpret the trade distributions, “Positve 1” covers from 0 – 1%; “Positive 2” covers from 1.01- 2.00%

Feel free to ask any questions in the comments section. I hope the statistics and graphs I’m posting are demonstrating a more deliberate method for analyzing one’s trading, even if it is a discretionary system.

Comments »

Trade Statistics from the New ETF Trading System

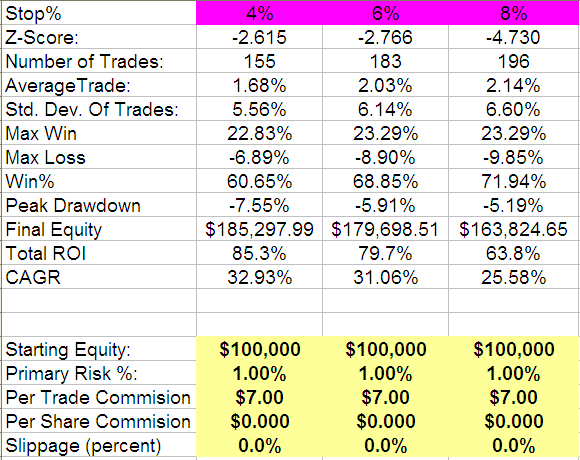
Before I give some explanation of how to interpret the above numbers, I want to give a huge thanks to BHH from IBD Index. Due to his help and expertise, my understanding of system trading and backtesting has increased tremendously.  He has been a co-developer of this current system (and others), and is responsible for all of the very cool Excel reports and charts that I will be posting. His blog has not recently had any of his fantastic reports on system testing and backtesting (probably due to how busy we’ve been working on systems), but the archives are must-reads.

The above report shows the statistics for trading this system using variable stop levels and variable percent risk, with commission and slippage included. (Actually, I didn’t add in any slippage). The dates of the testing run from July 15, 2006 to October 3rd, 2008.

To be clear, here is how the position sizing works for this system. Assume a starting equity of $100,000.

4% Stops

  • Maximum of 4 positions means each position is allotted 25% of equity. The first positions would then start at 25K
  • Maximum of 2 new entries per day.
  • This ensures only 1% per position is at risk as $25,000*.04 = $1,000

6% Stops

  • Maximum of 6 positions means each position is allotted 16.66% of equity. The first positions would then start at 16.6K
  • Maximum of 3 new entries per day.
  • This ensures only 1% per position is at risk as $16,666*.06 = $1,000

8% Stops

  • Maximum of 8 positions means each position is allotted 12.5% of equity. The first positions would then start at 12.5K
  • Maximum of 4 new entries per day.
  • This ensures only 1% per position is at risk as $12,500*.08 = $1,000

Position sizing / money management will have a huge effect on any system and should be the top priority for testing, after the entry and exits. Viewing the system in these terms allows the trader to decide the optimum level of risk so that he may meet his goals while still being able to adhere rigidly to the rules. A system with huge profits and huge drawdowns may be just as bad as a system that does not generate high enough returns.

Z-Score: Read a primer on Z-Score here: Profiting from the Z Score, and here: Z Score

As this system has a Z-Score ranging between -2.615 and -4.730, we can assume with a high degree of certainty (at a confidence level of greater than 99%) that streaks longer than would be expected in a random distribution may occur while trading this system. This includes winning and losing streaks, but the Win% shows that the winning streaks are longer than the losers. To be clear, once this system starts hitting winning trades, it will continue to win. Similarly, once a losing trade or two happens, we know that it is more likely to continue losing than it is to start a new winning streak. This is why proper position sizing is of the utmost importance. I like 1% risk because that allows me to weather 10 losing trades in a row with only a ~10% drawdown.

Peak Drawdown: The peak drawdown on this system is currently very small.

CAGR: Compound Annual Growth Rate on this system is promising. The system stayed near flat for more than the first year of testing (equity curve to follow in another post). It should be noted that the YTD CAGR on the 4% stop system is currently running at ~95%.

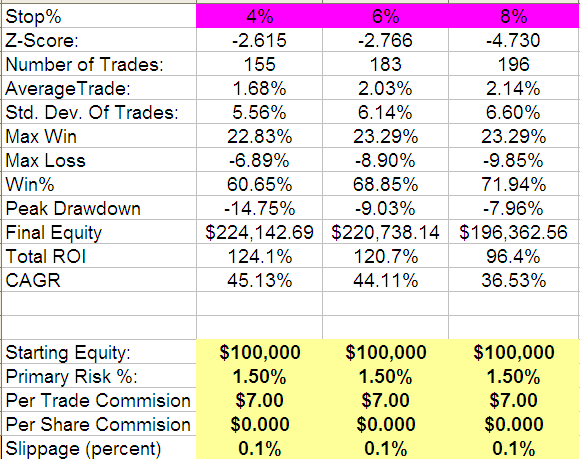
Now let’s assume we want to trade this system more aggressively, using 1.5% risk ($1,500) per trade. Keep in mind that if 10 trades stop out in a row, the draw down will now be at least 15%.

Here are the results:

Note that I added .10% of slippage per trade, as well as increasing the percent risked per trade. CAGR is now a very respectable 45.13% on the 4% system.

Also note that the peak drawdown is now -14.75% (and since the future is often very different from the past, we should assume the next drawdown will be even larger).

A Final Note about Adapting the System to Market Conditions

If we know the system is prone to long winning and losing streaks, what if percent risk were increased with each winning trade, and then reduced on each successive loser? Sure, the first losing trade after a long streak of winners would be for a large loss, but that might be mitigated by the pyramid of profits before that loser hit. And then, each loser would get successively smaller, until another winner occurs.

We have done some preliminary studies on this topic, but have not yet developed a robust method for applying this strategy of adjustable percent-at-risk.

Up Next:

More really cool graphs, including equity curves of each stop level, trade distributions, and a chart of the drawdowns.

Comments »

New ETF System Has Killer First Week

Up 7.65% for the week, with only 4% of equity at risk (2% if stops were adjusted for gaps), and an average cash balance of around 43% of starting equity.

This morning, [[DUG]] was sold at the open. As discussed last night, [[SDS]] was left open since the position closed just shy of its required exit signal.

I cautioned last night that it would be easy to close out SDS early to take fat profits, but noted it would be a modification to the system. Sticking to the rules was of course the right decision to make, as SDS initially dipped hard, but ended up closing with a gain of 2.64%.

SDS closed today with an RSI(2) of 84.68, and will therefore be closed Monday on the open.

The spreadsheet above has SDS marked to market as of Friday’s close (that is why it is highlighted in yellow). The sheet will be adjusted Monday with the actual exit price.

Ignore the Equity amount (also in yellow) as it cannot be updated correctly while there are open trades. The total equity is now $53,825.13 In four trades, the system has generated a return on investment of 28.82%, although these figures will obviously change when the actual price for SDS is booked on Monday’s open.

I have lots of cool statistics and equity curves, for a variety of levels of risk and position sizing, for this system. I will post them tonight or this weekend. If you are interested in system trading, you will not want to miss what I’m going to show you.

No new entry signals for Monday.

Comments »

New ETF System: Sell DUG at Friday’s Open

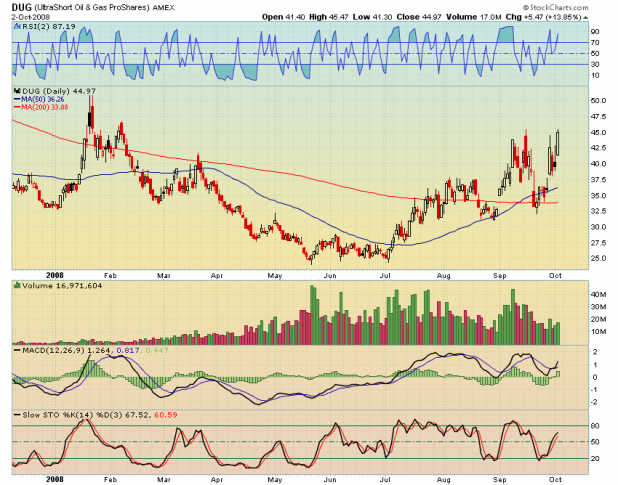
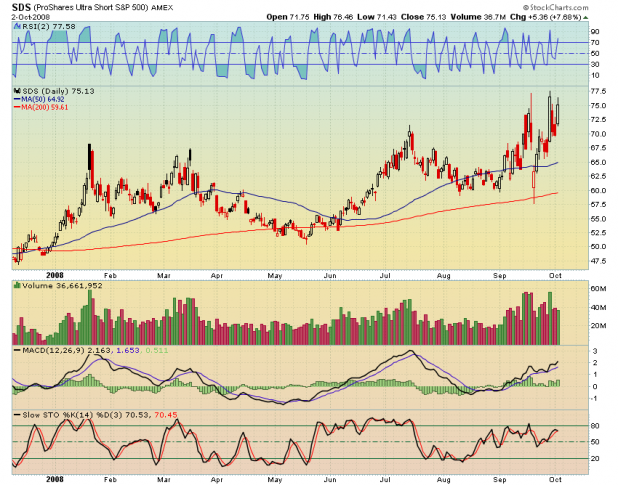
Both signals from yesterday evening, [[SDS]] and [[DUG]] did very well.

RSI(2) on DUG closed over 80, triggering a sell of the position on Friday’s open.

RSI(2) on SDS did not quite make it to 80. It closed at 77.58, to be exact. If one follows the rules, then this position should be held. This is where the psychology of system trading begins to have an impact. It is this very type of situation that I intend to highlight in these posts.

If I had this position on, it would be very hard for me not to sell SDS in the morning. RSI(2) is so close to 80. With the bailout bill up for vote tomorrow, my suspicions are that the indexes firm up, or even rally.

However, what if the indexes do not rally, and SDS is sold in the morning, and the trade sacrifices another 4% gain? Based on the backtesting, this trade would be allowed to either stop out, or get sold with RSI(2) greater than 80. Not allowing this trade to be closed out according to the identified strategy is a modification of the strategy. Will this tiny modification improve, or weaken the performance of the system? How many tiny modifications does a system trader have to make before the expected results are not similar to the backtested results? And finally, isn’t mechanical system trading supposed to remove this sort of psycho-analytical self-talk, and make trading more easy?

This is all food for thought.

This trade will be left to run its natural course.

No new entry signals for tomorrow.

Comments »

New ETF System Signals 2 Entries for Thursday

The entries for Thursday are highlighted in green.

There were more than 2 total signals generated. Here they are, in order of greatest to least volume, [[TWM]] , [[FXP]] , [[MZZ]] , [[EFU]] , [[SDD]] , [[SSG]] .

As explained, the system will only enter 2 trades a day, and will select the ETFs with the greatest volume. I will eventually test taking the diETFs that have the lowest RSI(2), instead of the greatest volume, as theoretically those will have more room to run. I’m confident that selection by volume will be the best selection method, but will post results of differing selection methods, in the future. After all, one of my goals is to help flesh out the issues that arise when developing a system, and entry selection, when there are more entries than allowed, can have a significant effect on performance.

I want to discuss setting stops when system trading. As evident in the spreadsheet, the stops have already been calculated so they can be placed when the order is entered. What happens though if these diETFs gap down a few percent on the open? If we have set a 4% stop, then it is likely to get hit. The best way to counteract a gap down scenario is to have the platform/brokerage set the stop after the entry is made. On Tradestation, this is called the “Stop Offset from Primary,” with “Primary” being the actual entry, and the “Offset” being the stop level in percentage terms. For this system, the stop offset is -.04

I will discuss how to handle gap-ups in a future post.

I received an email this evening from the co-developer. He states this about this system: “The good news is this thing is kicking ass now.  The bad news is it sucked before the first of the year.”

One issue we will have to figure out is what is different about 2008 that has allowed this system to generate huge returns? During the end of 2006 and all of 2007, the system did not do much of anything (I will post the equity curve in the future). Figuring these sorts of things out can lead to the development of adaptive strategies (strategies that adjust with market conditions), although the answer may be simply that there was not enough participation (volume) in these diETFs early in their lives to permit this strategy to work.


Comments »

New ETF Trading System: Part II and Closed Trades

While I explained in the previous post my intentions to track this system on iBC, I did not explain very much about the system itself.

The System Highlights:

Entry is secret but is not based on volume or RSI.

Exit rule is very simple: If RSI(2) closes above 80, sell at the next open.

This system has been backtested only as far back as Jan 1, 2008. Since the system trades only diETFs (double and inverse ETFs), and many of these diETFs are less than 2 years old, it is impossible to test back much more than 2 years. This should cause concern. However, I have tested this system on the SPY, DIA, and QQQQs, on all available data, and it is profitable. Still, that does not mean that the system will work the same on the diETFs. I am working on this system with another trader, who may or may not choose to remain nameless, and he will probably have tested this system back across all available data for the diETFs, within a week or so.

Here are the statistics, since January 1, 2008:

Trade Statistics
There were 80 total stocks entered. Of those, 80 or 100.00% were complete and or 0.00% were open.
Of the 80 completed trades, 49 trades or 61.25%resulted in a net gain.
Your average net change for completed trades was: 2.60%.
The average draw down of your approach was: -3.25%.
The average max profit of your approach was: 5.88%
The Reward/Risk ratio for this approach is: 2.63
Annualized Return on Investment (ROI): 268.02%, the ROI of ^IXIC was: -28.53%.
Exit Statistics
Stop Loss was triggered 31 times or 38.75% of the time.An exit trigger was executed 49 times or 61.25% of the time.An exit trigger was executed 49 times or 61.25% of the time.

Remember, this system will hold a maximum of 4 diETFs, and will take only 2 new entries per day. Therefore, more trades were generated during the time period tested, but these trades were not taken due to the aforementioned rules. For example, If 4 diETFs are signalled for entry, the system will only take the 2 with the greatest volume.

This method of 2 new per day with 4 max positions is a variable that may need adjustment in the future. More testing needs to be done on this variable.

Spreadsheet and Trade Accounting:

I want to explain this spreadsheet. I’ve set it up to make it easy to figure out position-sizing, so orders can be set in the evening before bed. All I do is enter the close amount and the sheet figures my 4% risk/stop, and size.

  • “Close” = the value on the day the signal is generated. Used for purposes of position-sizing.
  • “4% Risk” = the dollar amount per share risked with a 4% stop
  • “Stop” = stop market price to be entered when entry order is placed
  • “Size” = number of shares
  • “Entry” = actual entry price
  • “RealRisk” = this calculation takes into account any opening gap above the previous close. Since the stop level is derived from the previous close, any opening gap will increase the actual risk.
  • “Cost” = cost with $14 in commissions, to equal a round trip.
  • “% Return” = the Return on Investment in each trade
  • “Run % Ret” = sum of the % Return of all trades
  • “Run P/L” = a running total of the profits and lossesd

Once more trades are made, the system will generate more interesting statistics, and an equity curve will be plotted.

Gain of 3.79%, Not Bad for the First Day

No Entry Signals for Tomorrow

Comments »

A New ETF Trading System: Will Track and Trade on iBC

For a long time, I’ve been wanting to track and paper trade a system here on iBC.

I have not done so yet, as I do not want to disclose the specifics of systems that I am trading. There is, however, a system I’ve been watching that I think will be perfect for iBC for several reasons, with the 2 most important reasons being that I’m not trading the system (yet), and the ETFs it trades should be liquid enough to allow participation by others without creating large slippage.

I will not divulge the entry criteria, but I will be posting the signals nightly, in order to give plenty of time to be acted upon at the next open (I’m not recommending that you trade this system).

To whet any appetites, this system is up a whopping 71.6% this year.

Introduction to the New ETF System.

One of the pitfalls of trading a system is that one can easily start trading the system and find that he has begun trading it at the absolute worst time. This might mean starting a system and suffering through a drawdown before the system starts to generate profits. If one is lucky, he might find that the first trades are huge winners. The system trader will then have nice profit cushions, to absorb future drawdowns.

With that in mind (profit cushions) I want to start tracking this system, as of today, September 29th, 2008. The system trades only the double long and double inverse ETFs.

The three signals generated on Friday’s close were [[MZZ]] , [[EFU]] , and [[SCC]] . However, this system will only take 2 trades per day, maximum. And it will hold only a maximum of 4 ETFs. When provided more opportunities than the system will allow, the system chooses the ETFs with the most volume. Therefore, this morning, this system bought [[MZZ]] and [[EFU]] . It is very important to note that the system also generated a sell-signal, as of tonight’s close, so these ETFs will be sold at the open Tuesday.

Position Sizing

The importance of calculating position sizes is crucial to the success of any system. Here is how this system will calculate position sizes:

  • Initial Equity is $50,000.
  • Risk on each trade will be 1% of equity.
  • A 4% protective stop will be used on every trade.

Caveat: Position sizes set before the open can be troublesome because if a 4% stop is set based on the close, and the ETF gaps 2% on the open, the trade will actually move 6% before the stop is hit.

MZZ was purchased at the opening price of $64.39 The stop was set at $59.80, or 4% of the Friday’s close. As mentioned in the caveat, MZZ gapped up over 2 points.

The system will risk 1% of equity, which means this trade will risk $500.00 Therefore, 201 shares of MZZ were purchased. For the purpose of clarity, lets do the numbers so everyone understands the position sizing.

Since we are calculating our order the night before, we must use that evening’s closing price. MZZ closed at $62.29 Using the close, we figure the stop of 4%, which equals $59.80, or a risk of $2.49 To calculate the number of shares, we divide the 1% of equity by the amount risked. The formula is below:

$500.00 / $62.29*.04 = 201

So now, we are long 201 shares of MZZ, but we purchased them at $64.39 (due to this morning’s gap). This means our actual risk is now $922.59, or almost 2% of equity. Uh Oh!!! This could be a real problem, in real-time, if the trade turns against us. If one were able to monitor the open, position sizing could be adjusted as it became evident that the ETF would gap. However, I devise systems to be traded by those who work, and can’t trade while working. Lucky for us, these trades went deep into the money, and quick.

On to EFU. Based on the position sizing above, 112 shares of EFU were purchased. I won’t bore you with the stop details as you can calculate those, and besides, the stop will never be hit.

After the first day of trading the system, this is how the numbers look:

Symbol     Cost             Value at Close     Unrealized Gains

MZZ         $12,947.39     $14,319.24        $1371.85

EFU          $13,160.38     $15,232.00        $2071.62

Cash        $23,892.23

Not to shabby for the first day!

Each evening I will continue to post on this system, and flesh out all of the intracies, including more fancy accounting and statistics. I hope that this process will be very helpful for everyone as we begin to understand the process of mechanical system trading.

For Tuesday, we will sell MZZ and EFU on the open (the exit criteria will be covered in the future). There are no new entry signals for Tuesday.

Stay tuned…

All posts will be housed under the category of *New ETF Trading System, at least until it gets a formal name.

Comments »