
Joined Nov 11, 2007
1,458 Blog Posts
Developing an Edge from Window Dressing
The following article is lifted from Trading Markets. I think it is very interesting and could definitely provide an edge.
Here is the link: When Do Money Managers Like to Buy Stocks?Â
Do money managers pile into the stocks at the end of the month in anticipation of 401k and savings money coming in? Well it looks like they do…big time!
In 1999, Kevin Haggerty wrote about this phenomenon on the TradingMarkets site. Kevin had just retired as the head of trading for Fidelity Capital Markets, and he discussed the “end-of-the month” phenomena. Up until that time, I had not heard about it nor had seen anyone else write about this.
Since Kevin first mentioned it, I and others have observed it time after time, especially when a stock was rising (meaning above its 200-day moving average).
Recently we decided to look further into this. We decided to see if we could quantify and potentially profit from the behavior. The findings were a bit eye-opening, and I’ll share them with you today.
We looked at over seven million trades going back to January 1995*. We then broke these trades down to the day of the month, meaning we asked “if we bought every stock today, how would we have done over the next 5 trading days?”
We did this for every day of the month for every stock that was trading in a longer-term uptrend, meaning above its 200-day moving average.
Here are the some notes of our findings:
- The average gain for all days (meaning you randomly bought a stock and held it for five days) when it was above its 200-day MA from January 1995-September 2006 was 0.27%.
 - Now, let’s look at what happens as we start approaching month end. The average gains rise…significantly. On the 23rd day of the month, the average gain for these stocks more than doubles. On the 24th it triples. On the 25th it almost quadruples! And this type of behavior holds through the end of the month (see table below).
 - Let’s go further. Let’s look what happens at the early part of the next month. In spite of a strong upward move in stock prices over the past 11 3/4 years, stocks on average have “lost money” for the six consecutive days from the 3rd through the 8th. Money spent is money spent, and it looks like the fund managers spent their money near the end of the previous month.
 - And now let’s go even further and look at something which is even more eye-opening. Let’s look at what happens after a stock drops the previous day. The returns for those stocks go up even more near months-end. And if the stock has dropped two days in a row, the gains become extreme. On the 25th and the 26th, the stocks which have dropped two days in a row have risen more than 1.5% on average over the next 5 trading days. Annualize that out. One can make a heck of a living with returns like this.
 - More to number 4. After a stock has dropped two days in a row going into the 25th, 26th and 27th day of the month, more than 60% of the stocks have closed higher five trading days later. Markets are efficient…uh huh.
Kevin was right. And considering his position in the trading world, he certainly had the opportunity of seeing this behavior first-hand. Over the past 11 3/4 years, stocks have been much stronger near months-end than they have been any other time of the month. And, stocks which have dropped a day or two near the end of the month, have out-performed even more (think about what happened this past Tuesday morning after many stocks dropped two days in a row). The fund managers like to buy near months end. And it looks like they especially like to buy stocks as cheap as possible near months end.
Baseline Days of the Month, Above 200-Day MA, 5-Day HoldDays which have outperformed by a 2:1 margin or greater are in green.

1 or More Down Closes, Above 200-Day MA, 5-Day HoldDays which have outperformed by a 2:1 margin or greater are in green.

2 or More Down Closes, Above 200-Day MA, 5-Day HoldDays which have outperformed by a 2:1 margin or greater are in green.

This research can go much further. The size of the drop, ETF and futures trading, short selling, pairs trading, combining PowerRatings with the day of the month, further intra-day drops, etc. are all there for a deeper look.
In the coming weeks I’ll share some of this research with you here on the TradingMarkets site.
Have a great week trading!
Larry Connors
* Our research looked at 7,050,517 trades since Jan 1, 1995. We applied a price and liquidity filter that required all stocks be priced above $5 and have a 100-day moving average of volume greater than 250,000 shares.
Larry Connors is CEO and Founder of TradingMarkets.com.
Comments »Reader Request: XHB–The Homies
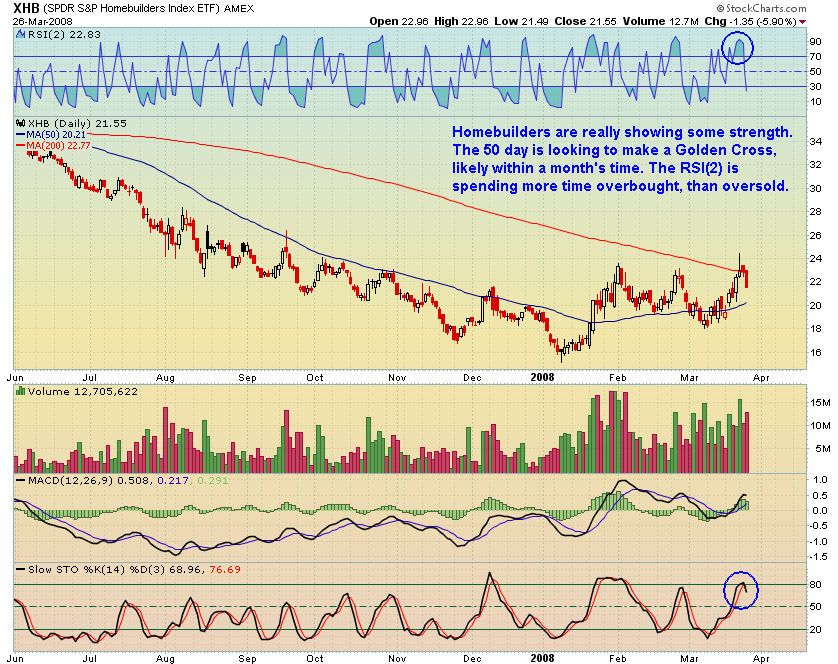
I believe it was Cubs Rock that asked me to put up a chart and give an opinion on [[XHB]].
Since January, the etf has spent more time overbought than oversold. The 50 day average has turned up and is tracking to cross back above the 200 day average. A new uptrend has begun, evidenced by the higher highs and higher lows. A close beneath $18.00 would break this trend.
In the near term, XHB has pulled back from an overbought condition. Volume on the pullback has been large. Support in the area of $20.00 is probable. If one is considering a position, I suggest waiting until the RSI(2) becomes oversold before buying. This could happen within a day or two.Â
Personally, I find this chart compelling. I do not know fundamentally why one would buy the homies here, as I do not think the industry will fully recover for several years or more. However, the technicals show a recovery in process. This could very well be due to short covering and speculation.
Comments »RSI(2) Suggests Pullback is Imminent
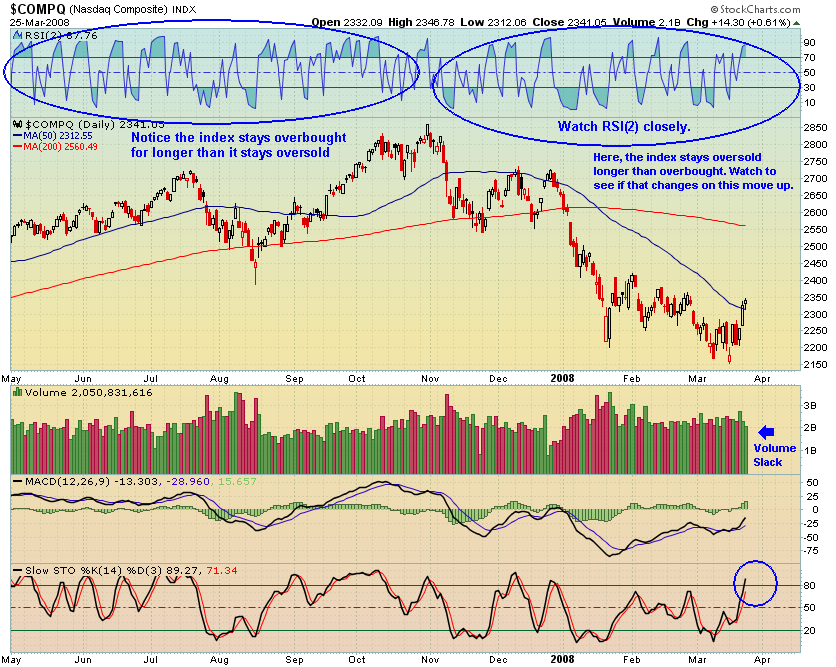
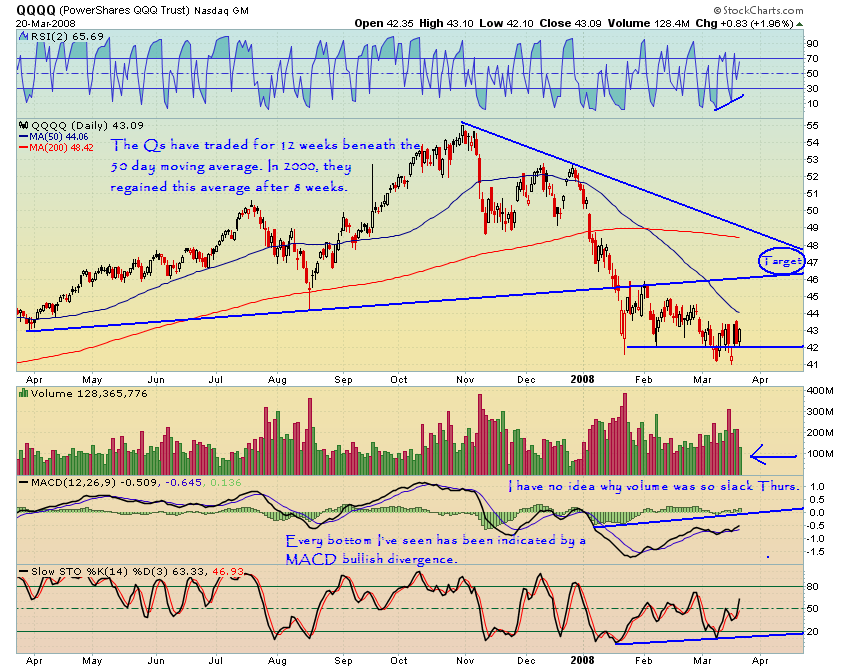
The RSI(2) is painting a clear picture of one difference between an uptrend and a downtrend. During the uptrend, RSI(2) will stay overbought longer than oversold. During a downtrend, it is just the opposite. This Nasdaq chart clearly shows this. What we want to watch for is a change in this behavior. If the indexes start staying overbought for longer than oversold, we will watch for a new uptrend.
Until that happens, all indications point to a pullback.

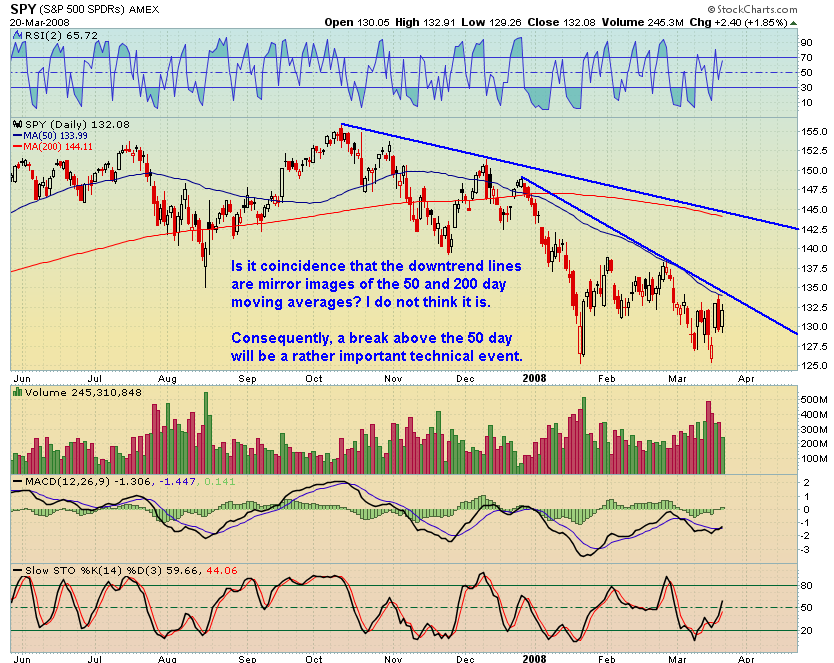
 The SPY has about 12 more points of RSI(2) before it will hit areas of recent ceilings. Therefore, the pullback may be quick, with 1 or 1.5 strong days to follow, which will allow the indicator to reach the highs necessary for a turning point. If the SPY rolls over here without hitting in the 90s (as I’m somewhat expecting it to do), the run up will be proved weak, according to the RSI(2).

I will be really, really surprised if the Dow Jones does not have a pullback here. I will look to see the 12325 area on any pullback, or about a 200 point drop from today’s close. Should the Dow Jones hold this level on a pullback, I will be a buyer.
I still have not made any major buys after proclaiming a bullish bias here. In fact, I doubled my short of [[LEH]], and bought [[QID]] and [[DXD]] near their lows today. I think the momentum is wearing off this recent push, although I am still bullish on the indexes as long as they hold above the 50 day average.
Should any test of the 50 day average be successful, I will start charting more breakouts and other bullish patterns.
Comments »The Bulls are like Drunken Teenagers
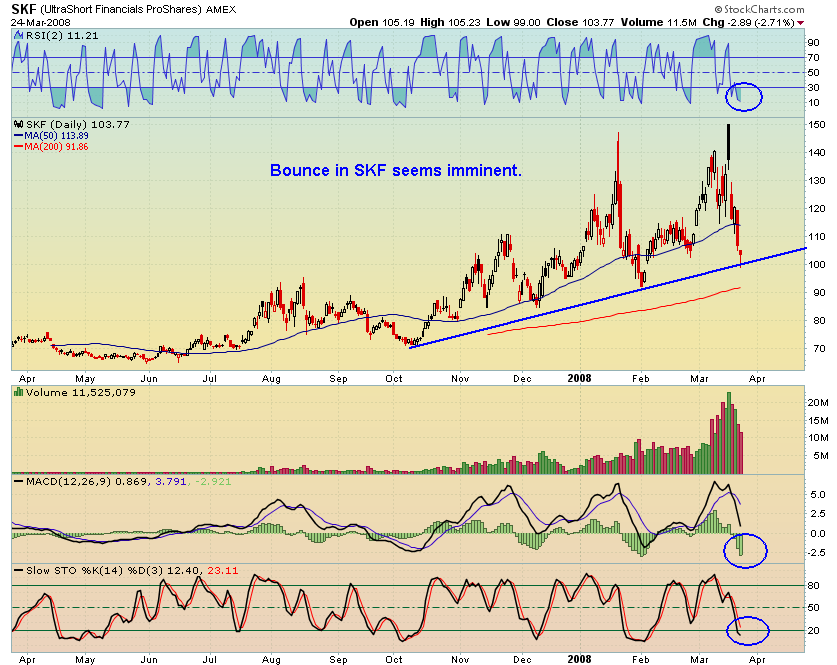
I had every intention of getting long today. I did not really consider that the Nasdaq and Dow might be up over 70 and 200 points by the close. It seemed to me that after Thursday, we would be up, but not this drunken teenager rally. I waited all morning for a dip. The indexes kept making higher highs, and higher lows. After lunch, I gave up trying to buy, deciding the rally was overdone, and went out and played baseball with my son. When we came back in before the close, I was watching what I believe to be distribution. So instead of getting long, I actually sold short [[LEH]] and nibbled on a little [[SKF]]. I did have a limit order that filled for a small amount of [[MBRK]]. I’m also short the ag name, [[CNH]].
Plainly, I’m not buying after two big rally days in a row. Instead, I’d rather have a few shorts grillin’, while I wait on a pullback.
My plan has been for months to buy the indexes after a successful test of the 50 day average. With the Dow, Nasdaq, and S&P all above the average, I have a strong feeling that the test will come, shortly.
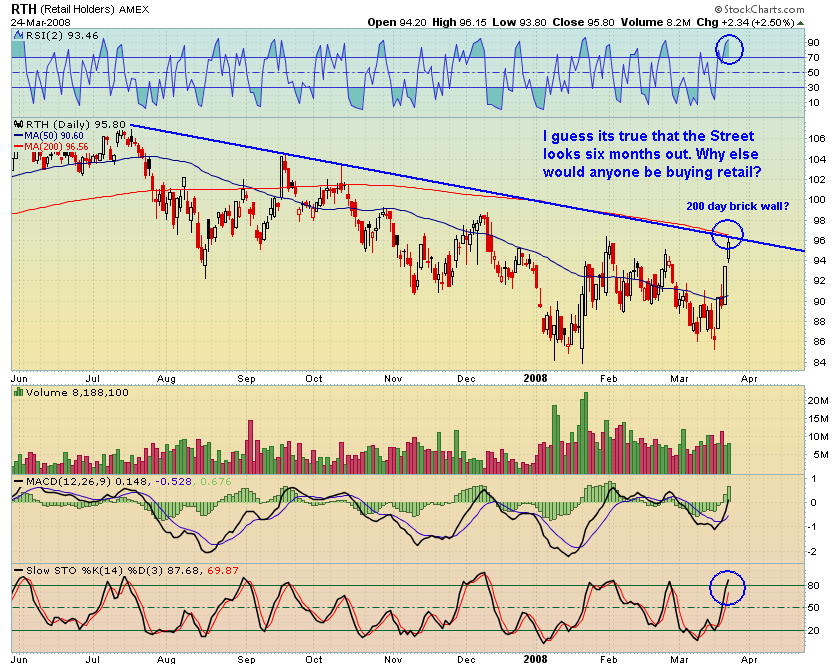
The Retail Holders….[[RTH]] This looks like a nice short setup. I can’t imagine that this move has been anything beyond short covering.

As for the Homebuilders, [[XHB]] it looks like money (whether it was dumb or smart remains to be seen) sold into the strength today. Watch the 200 day average, just like in the Retail Holders, to guide short sales.
All in all, it appears the Bulls have stampeded for the clitoris, bypassing all that is good and holy, in their rush for satisfaction. I’m concerned the party will be over before it really gets started. Therefore, it looks like a pullback will be in order. Let’s see if the indexes can hold the 50 day average.
Comments »I Am Getting Bullish
In the near term, specifically over the next few weeks, I cannot help but be bullish. Therefore, I am officially changing my bias from short to long. Mr. Jeremy will hopefully see fit to remove the Bearshitter from my banner, given my near-term sentiment change.
Will the market go up or down, over the next month? I suspect up, but that is just a hunch or an intution; some might even consider it a guess. The odds of such a move are probably no better than 50/50. However, the reward/risk for trading a possible move up can be better than 2:1, using current support levels as a stop area.
Regular readers may remember my calls a couple of weeks ago that the Nasdaq would see 2000 and the Dow 11,000. I still think that is probable. However, I think we will move up first. Let me explain why.
First of all, I feel very strongly that we will remain in a protracted bear market. I do not think that earnings or the economy will recover in the 2nd half of 2008. But, as I’ve said before, I’m a technical analyst, not an economist or a fundamental analyst. The technicals show that the indexes could experience a significant rally, and still not break the primary downtrend. Such a development will be bullish short term, but will not violate my principle belief that we are in a bear market.
In 2000, it took approximately 9 weeks for the Nasdaq Composite to regain its 50 day moving average. It then traded above the average for the better part of 12 weeks, before again breaking below the 50 day. On the second break of the 50 day average, it proceeded to trade beneath this average for 19 weeks before again breaking above it. I expect a similar type of scenario to unfold over the coming weeks and months.

 We just witnessed the failure and implied bankruptcy of one the top five broker/dealers. What was the market’s reaction? Well, the crowd went mild. When we witness the destruction of a financial instution on the level of Bear Stearns, and the market does not follow through with a negative reaction, I am at a loss as to what could drive the markets to new lows, in the near-term. Long term, I see a dearth of consumer spending and weak earnings driving the indexes to new lows. However, it will be a while before there is enough data for that scenario to become reality.
There will be constant risks for the bullish, such as the failure of another financial institution. I do believe that the Fed’s recent action will be enough to stave on any more crises, for at least a few weeks.
The headline risks are also present. S&P downgrading [[LEH]] and [[GS]] comes to mind. But seriously, what the hell is a downgrade going to do that a bankruptcy could not? And who believes anything from the S&P? There is always going to be the opportunity for negative economic reports, such as the GDP on Thursday. In the near term, I feel that any bad news will be treated as good news, and we will hear plenty about events being “priced in” and “the market looking six months forward.”
 Â
Â
I plan on scaling in to [[DIA]], [[SPY]], and [[QQQQ]]. I will use support under each index as a guide for stop placement. As my thesis is that the indexes are finished retesting lows for now, I do not want my stops placed beneath the lows. Rather, I want them just under recent support, $120 for DIA, $42 for the Qs, and $129 for the SPY. If these levels are busted, the market is still wanting to test lows, which will invalidate my plan. With stops at these levels and purchases near Thursday’s closing prices, the reward to risk on these can be 2:1 or better.
If the indexes can regain and hold the 50 day, then I will add to the positions and move my stops up.
Let me reiterate that I’m still bearish long term. Technically speaking, the short term momentum is moving in favor of the bulls. If one looks at bear markets, there are always rallies. Those who do not see a rally in the near term should be asking themselves what exactly will keep the indexes from a rally?
Bonus Read: An interesting primer on Bear Markets from Schwab: A Bear of a MarketÂ
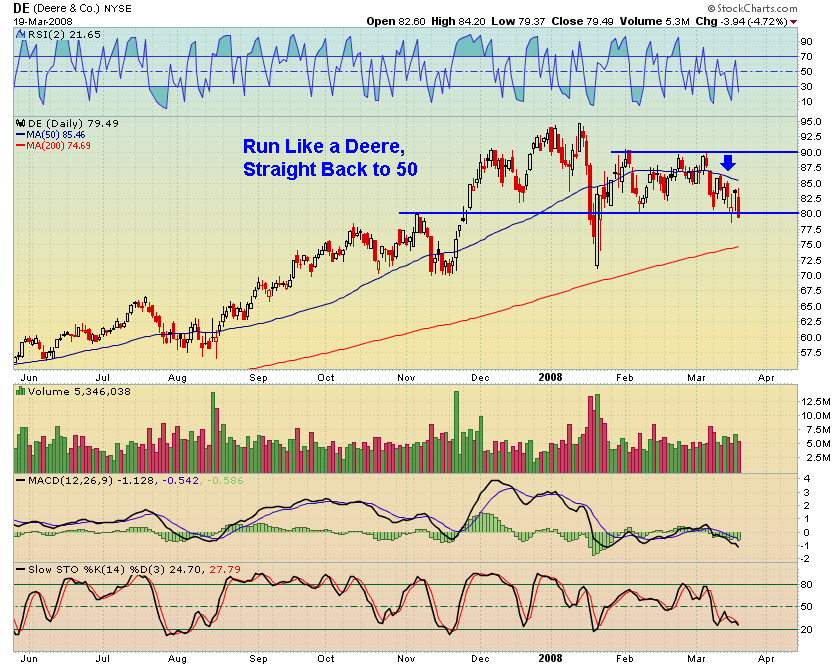
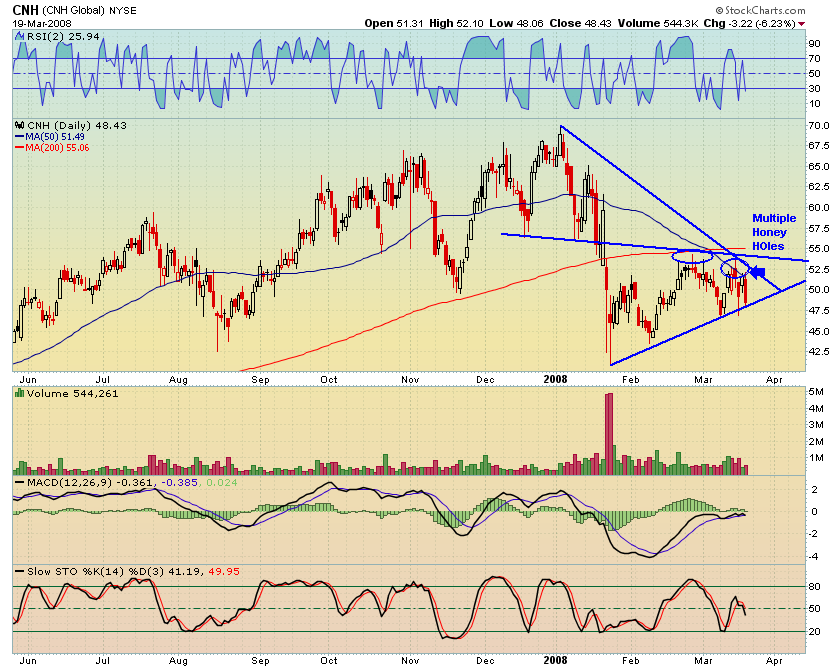
Comments »Short the Weak Agriculture Names
I told you there was top in Ag, in this post: I’m Calling a Top in Agriculture.
If you had shorted, the next morning, every stock charted in that post, every position would be in the money.
Today, [[MOS]] and [[POT]] closed just beneath their 50 day averages. I think there are still some asshole dip buyers out there. My recommendation is to wait to short those names. One of two things will happen. They will make a run towards highs again, or they will break down further. I’d like to see a breakdown, and then an oversold rally back to the 50 day, before getting a big short position in either stock. These big momo names will often “rage, rage against the dying of the light.” Better to let the “heros” put their accounts on the line. You want to wait until they are weak.
The following stocks are weaker ag. names and should be sold with a vengeance.

I would like to sell these tomorrow, but options expiration makes me a tad nervous. Any opinions on trading tomorrow vs. Monday?
Comments »