iBankCoin
Home / Tag Archives: $COMPQ (page 32)

Tag Archives: $COMPQ

Sell Flow Controlling The NASDAQ

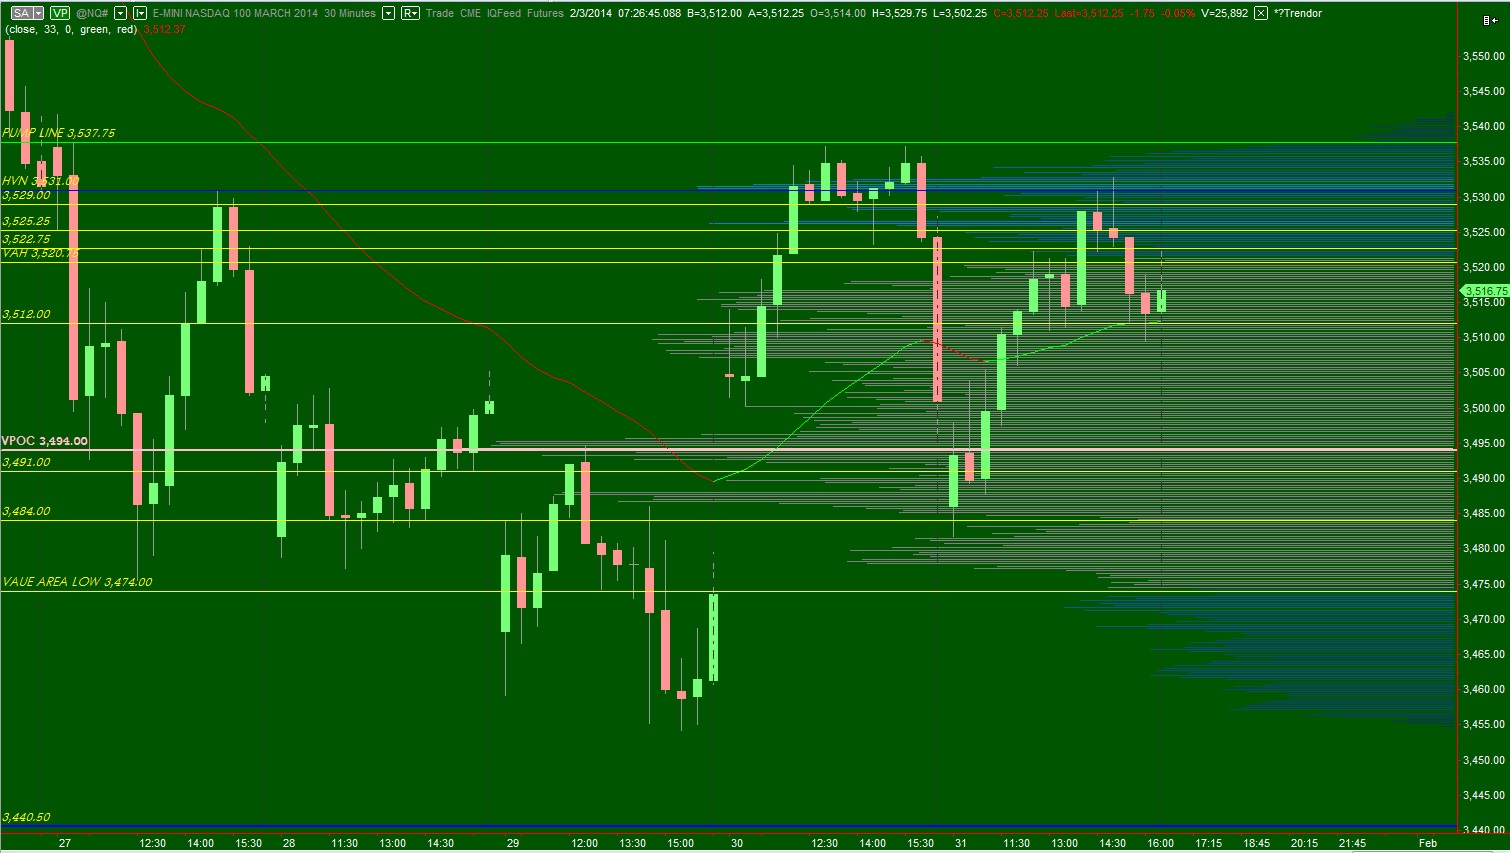
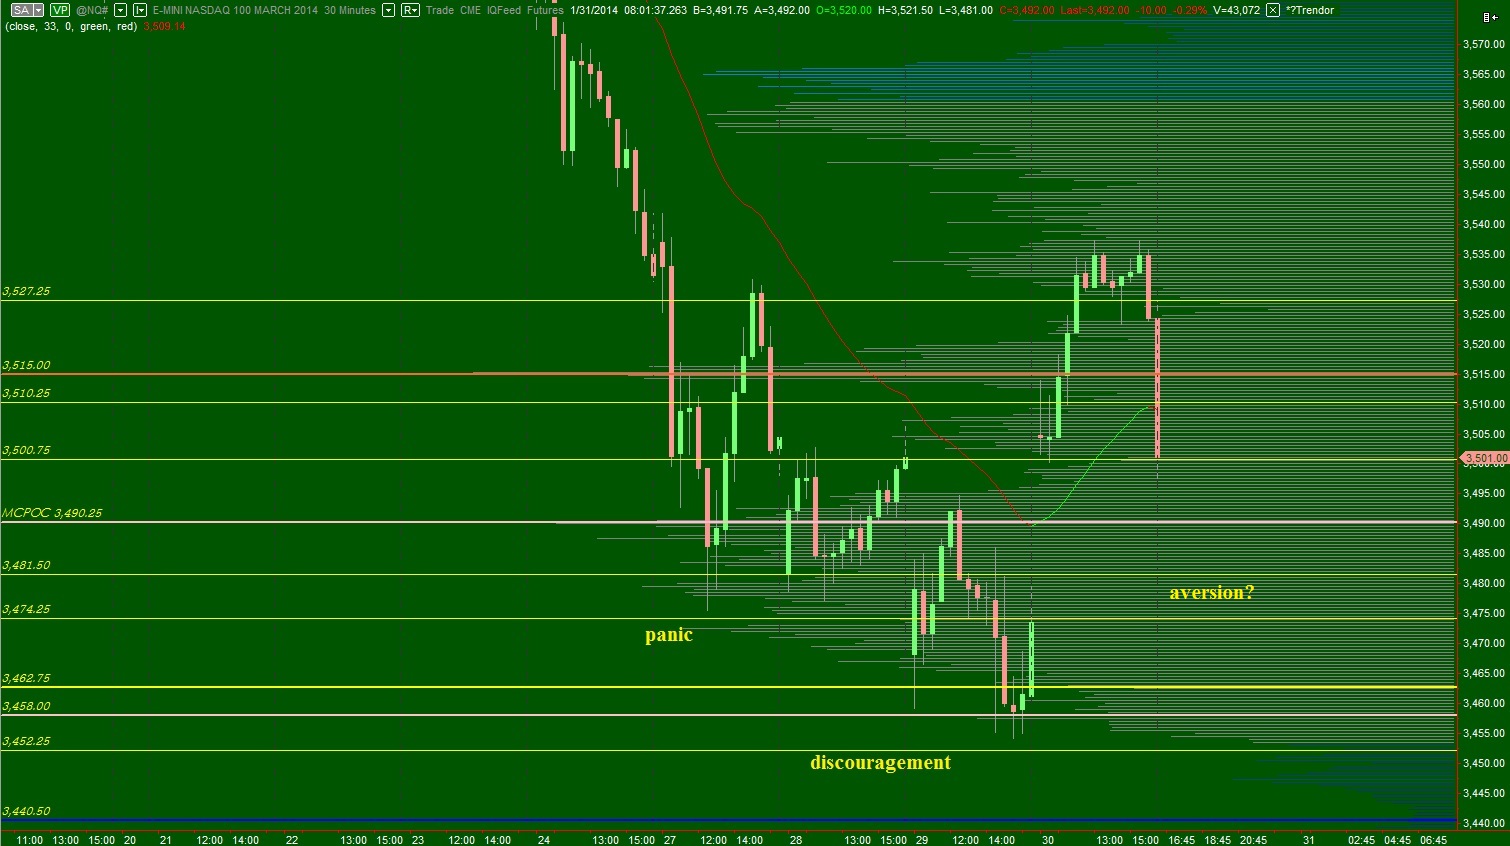
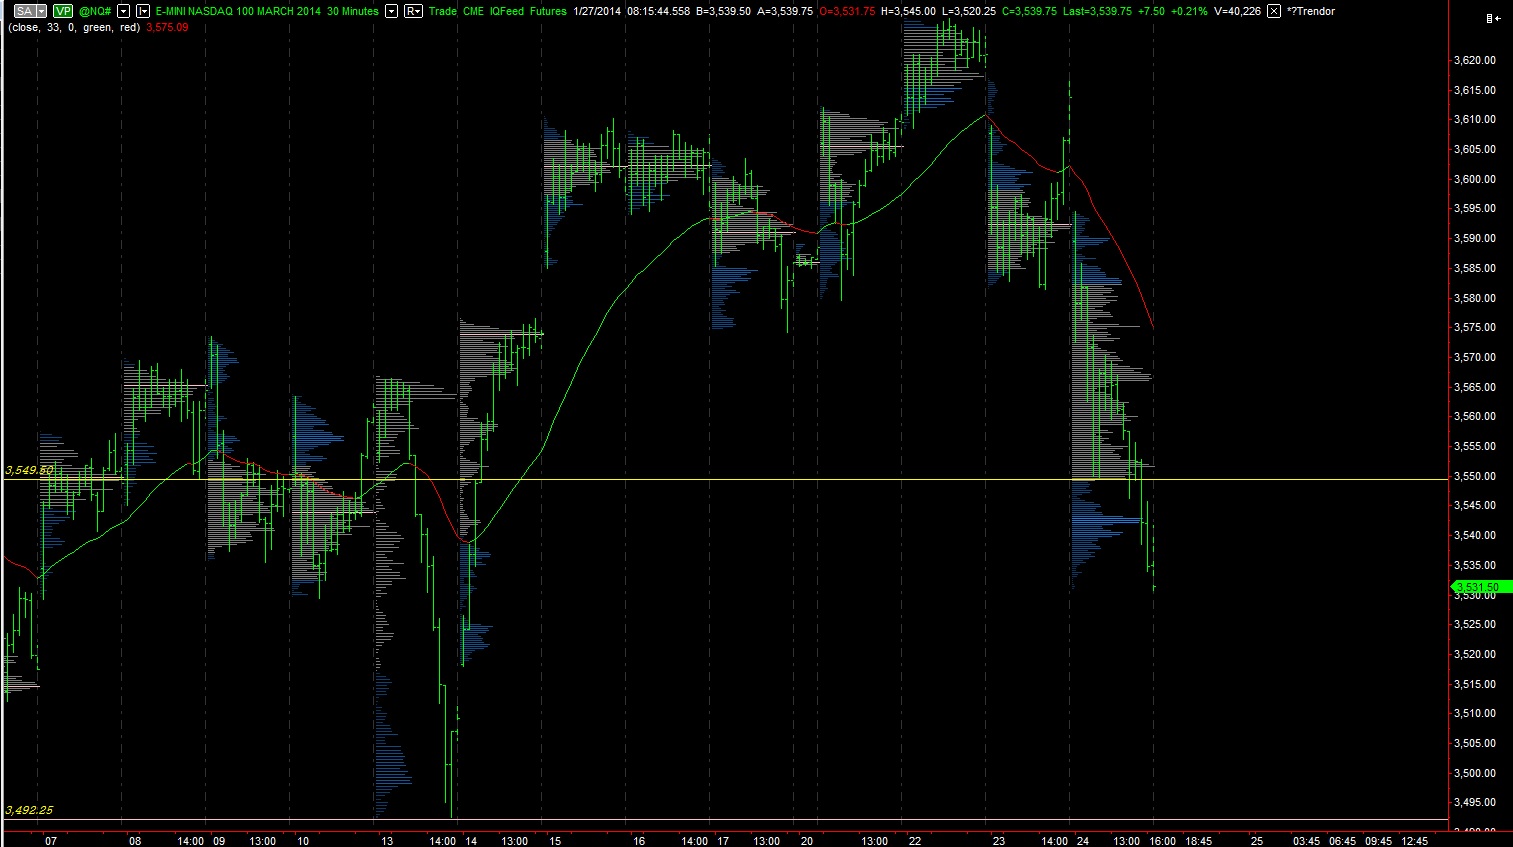
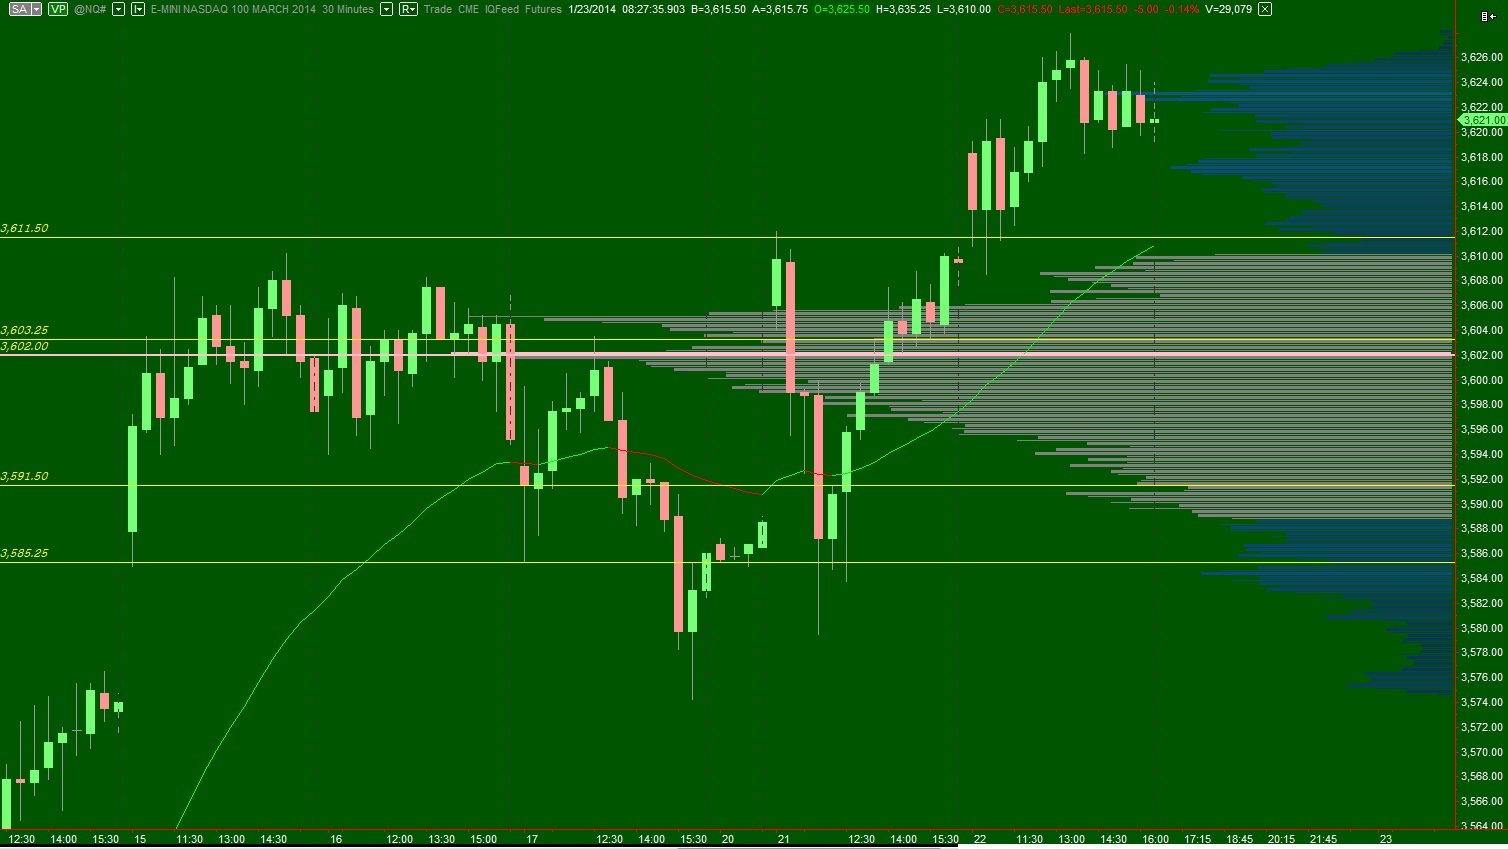
Trade was balanced overnight in the NASDAQ futures after prices worked a bit lower in the early pm hours. Price briefly took out yesterday’s low of the session before finding buyers and trading in balance.  As the US comes online, the sellers appear to be reasserting themselves with another rotation down thus they claim control of the overnight session.

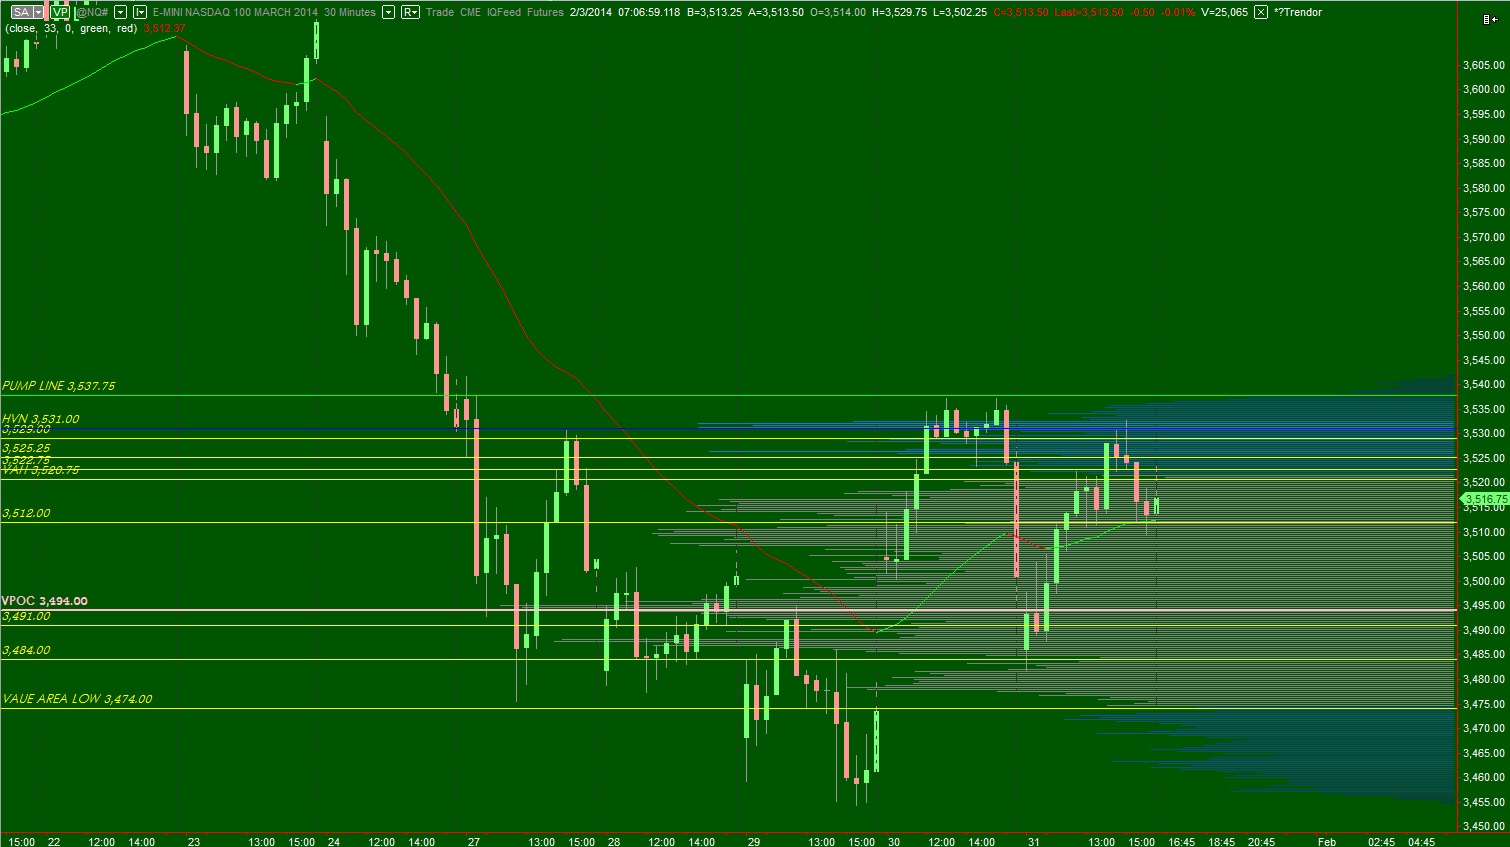
Yesterday prices traded higher, as did value, but the challenge was getting across the 33ema which held prices down all day.  Prices fell out of their upper value distribution in the afternoon but ultimately closed higher.  Buyers were in control during yesterday’s day session.

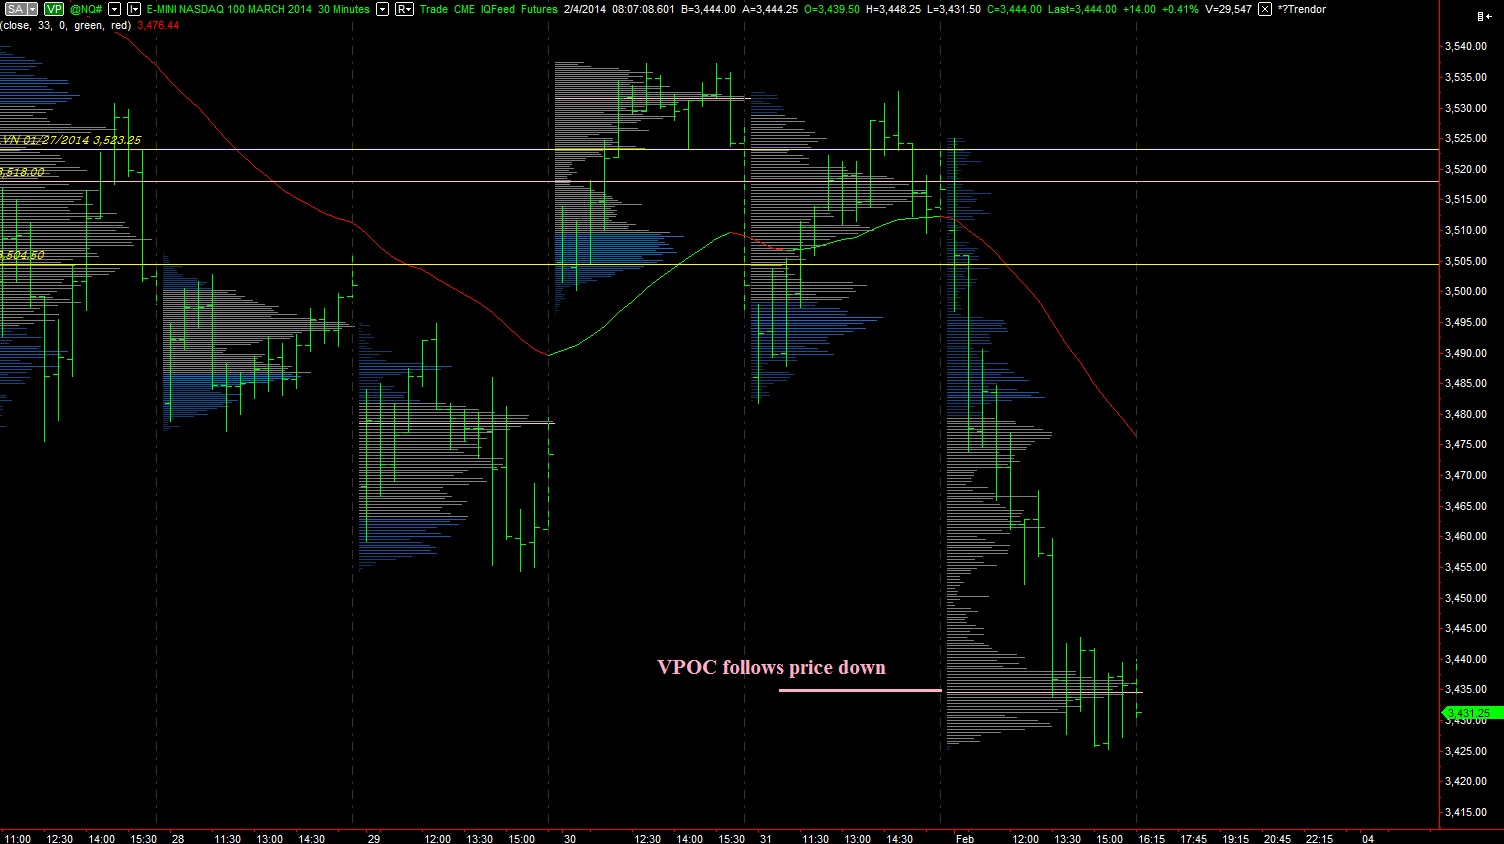
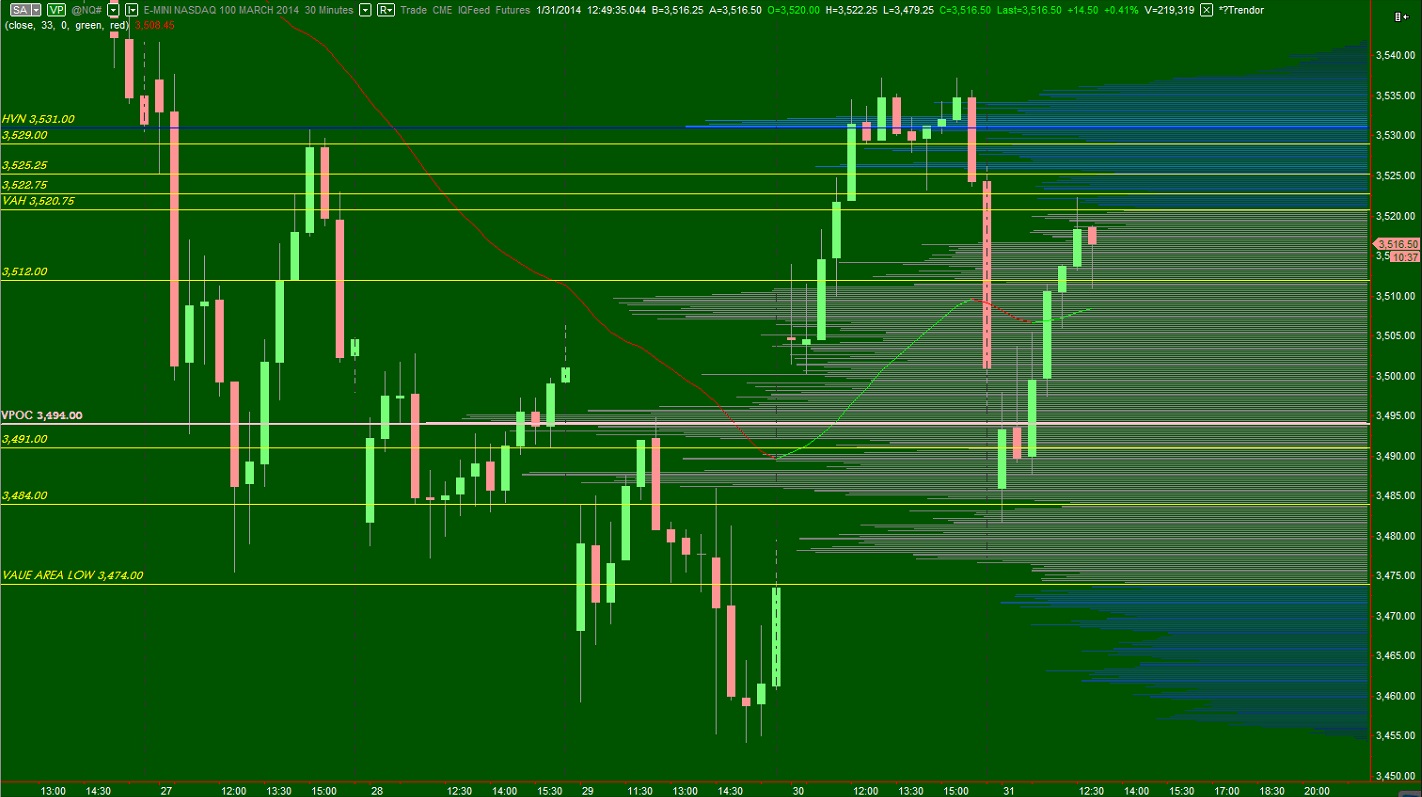
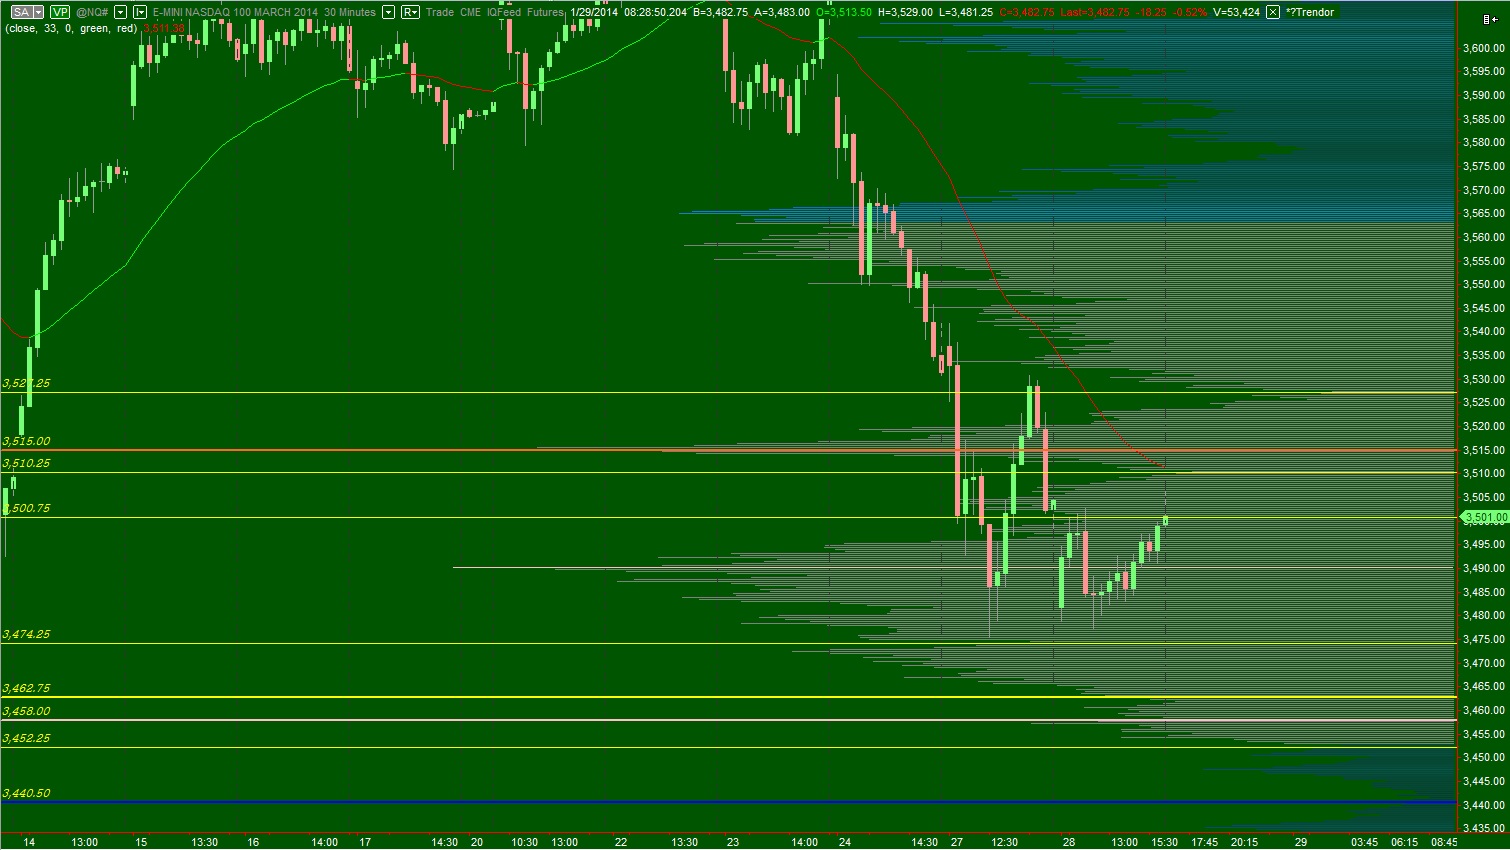
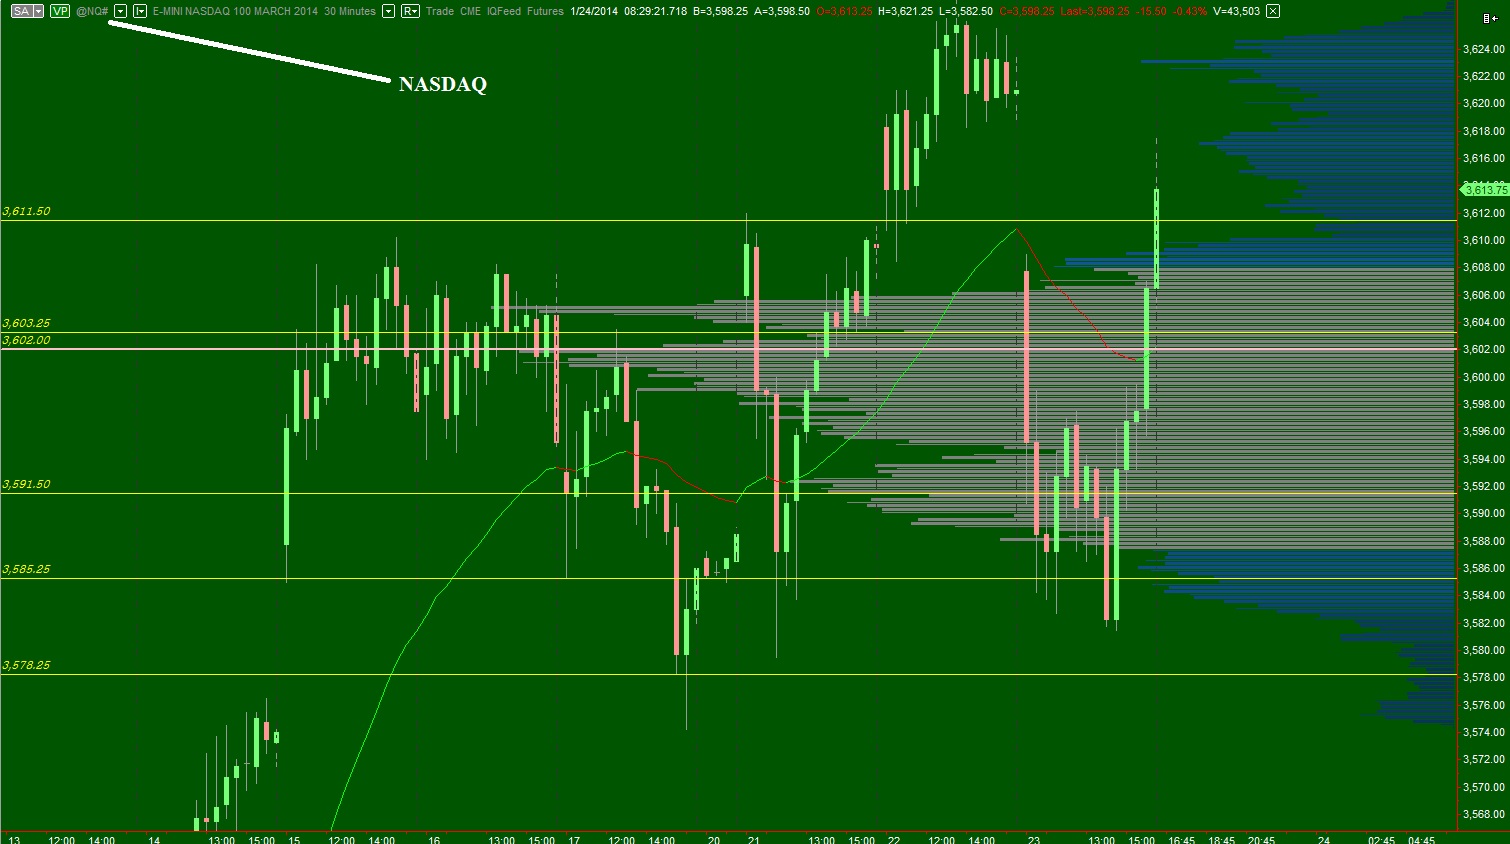
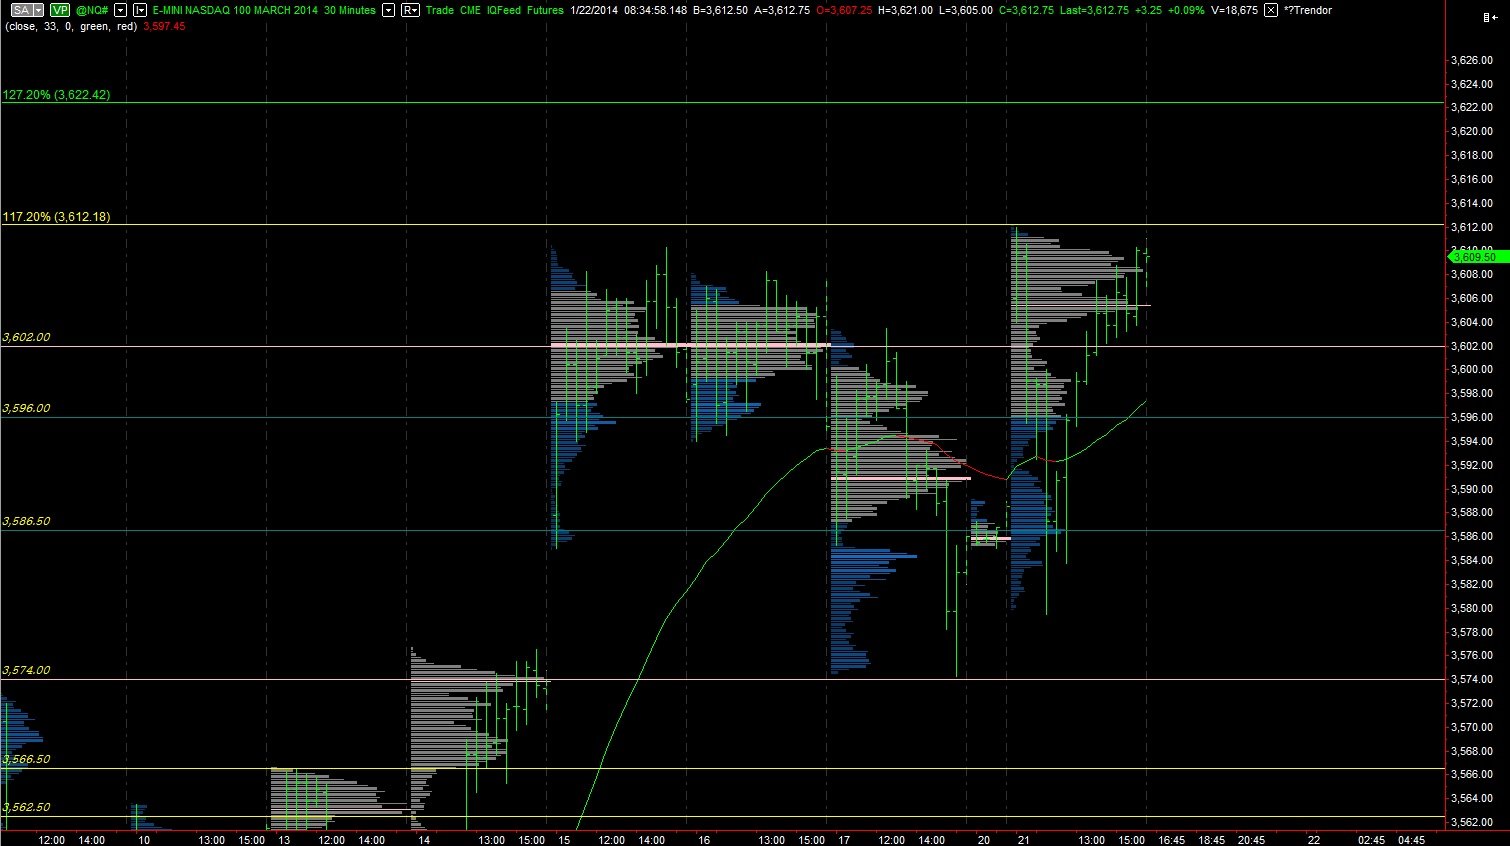
Intermediate term shows sellers in control also.  This can be seen as a series of lower highs and lower lows.  Their control of the intermediate term remains until we see the market put in a higher low.

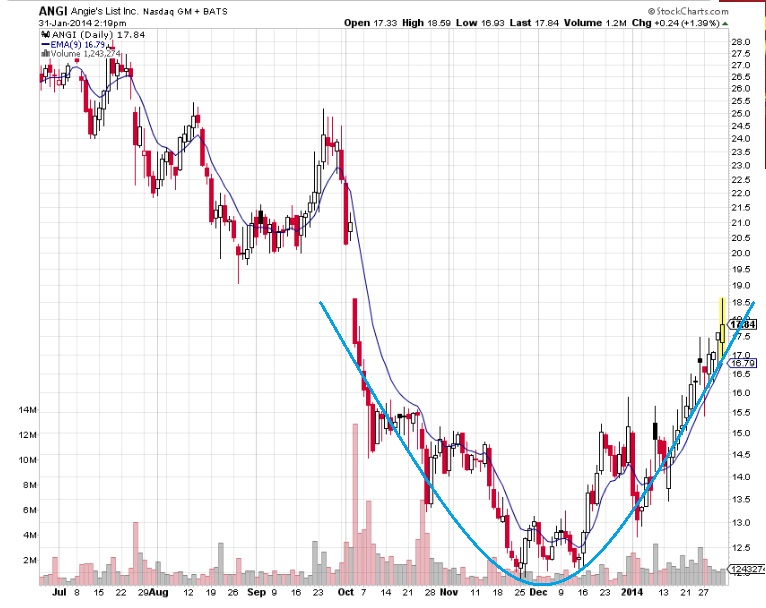
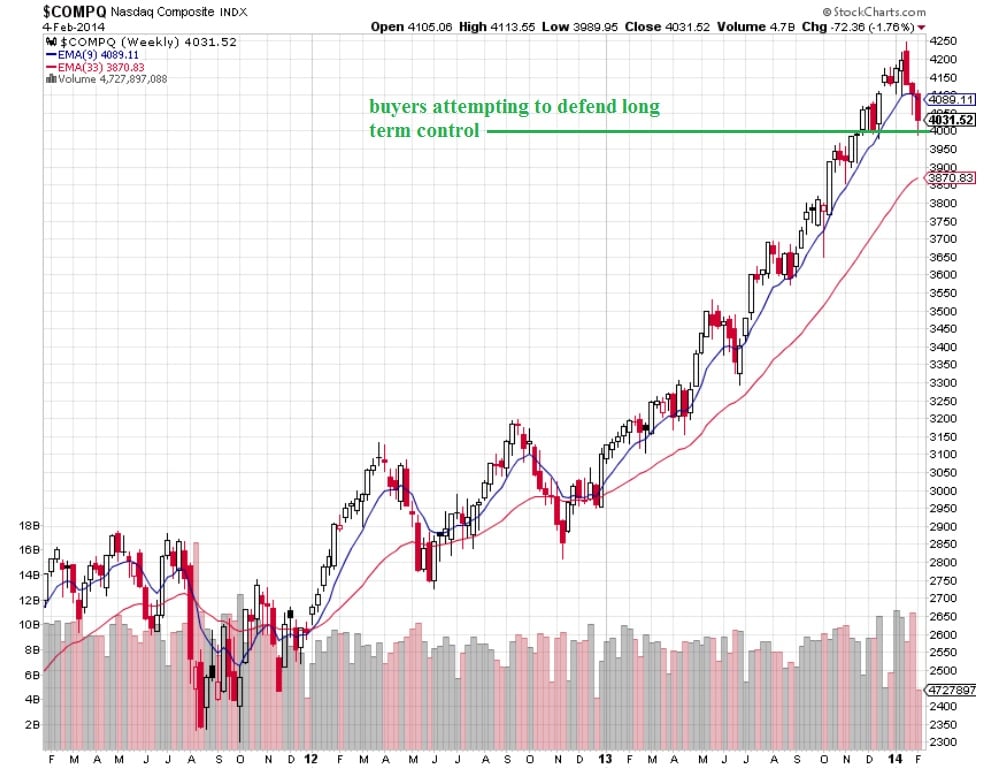
The long term control can still be seen as dominated by the buyers, where the weekly chart has made a series of higher highs and lows since the beginning of 2012.  However, the chart is trading below the weekly 9 period exponential moving average.  This creates a higher risk environment t where price can accelerate to the downside rather quickly.  The key level from the COMPQ appears to be 4000.  A weekly close below this level could open the door for a test of the 33ema down near 3870.  I have highlighted this action below:

COMPQ_WEEKLY_02052014

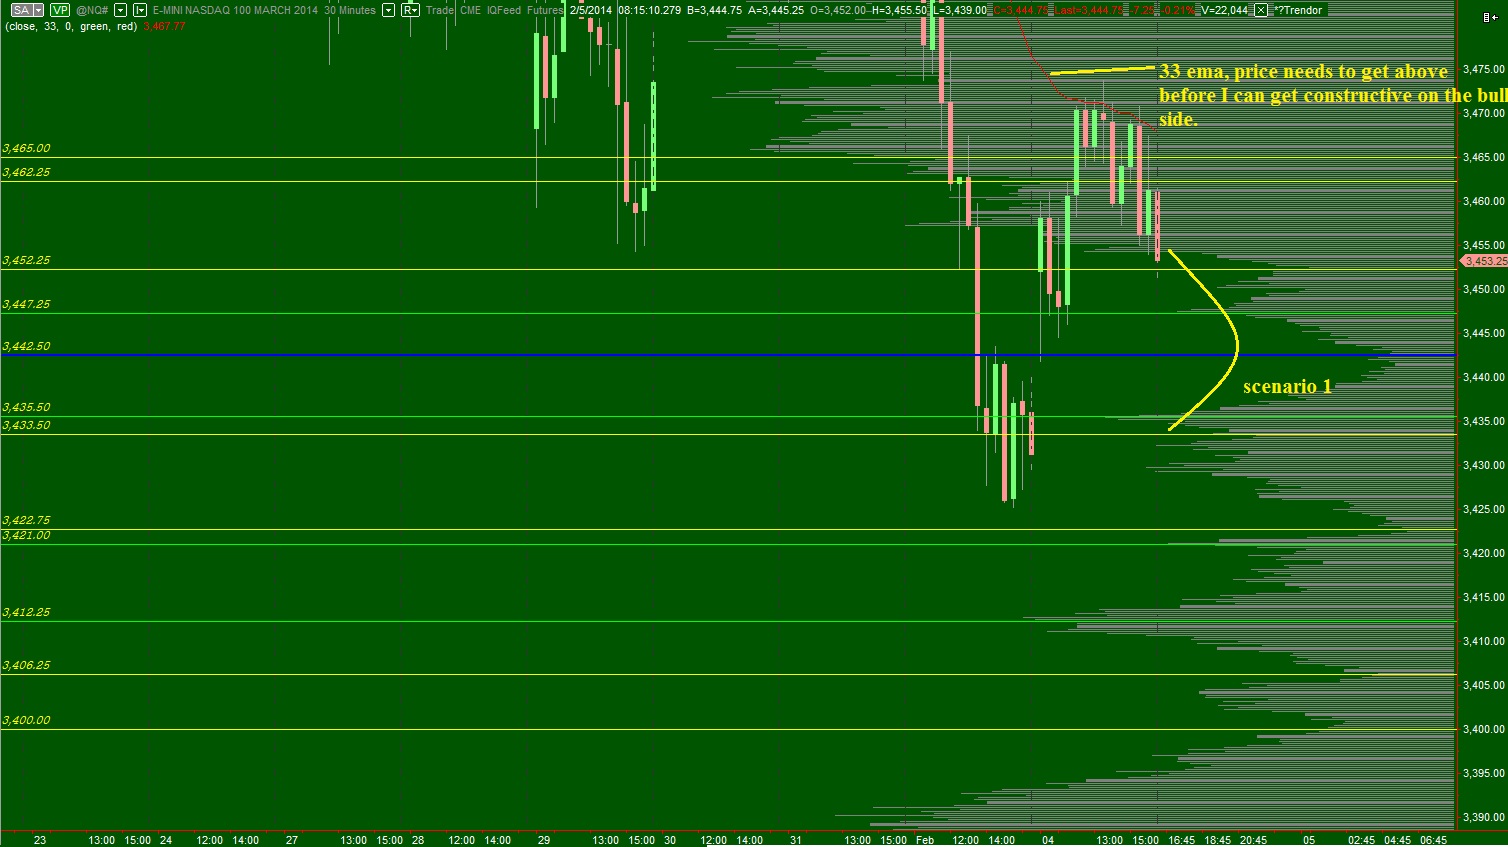
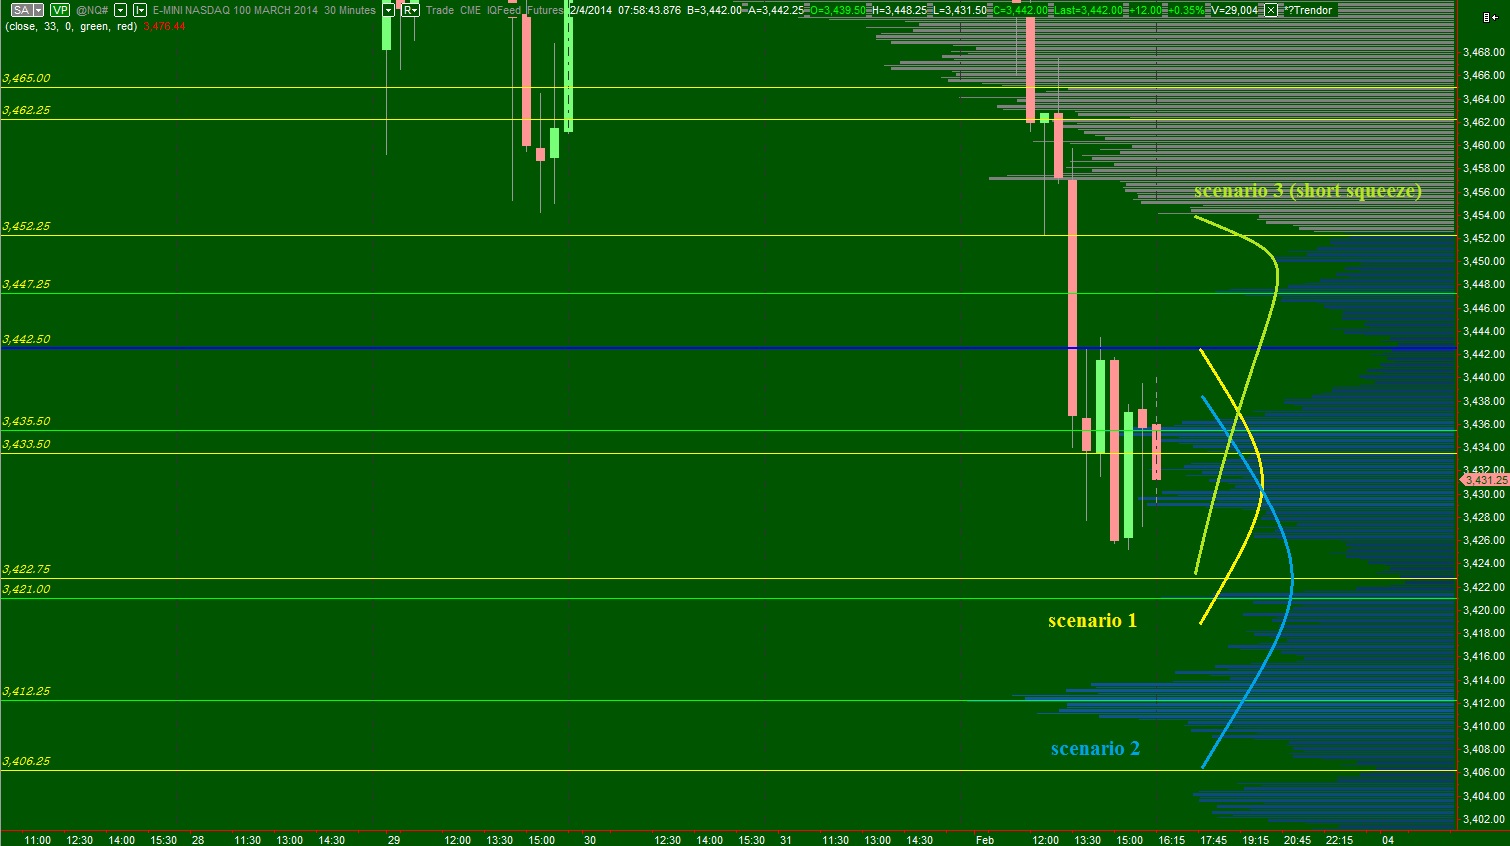
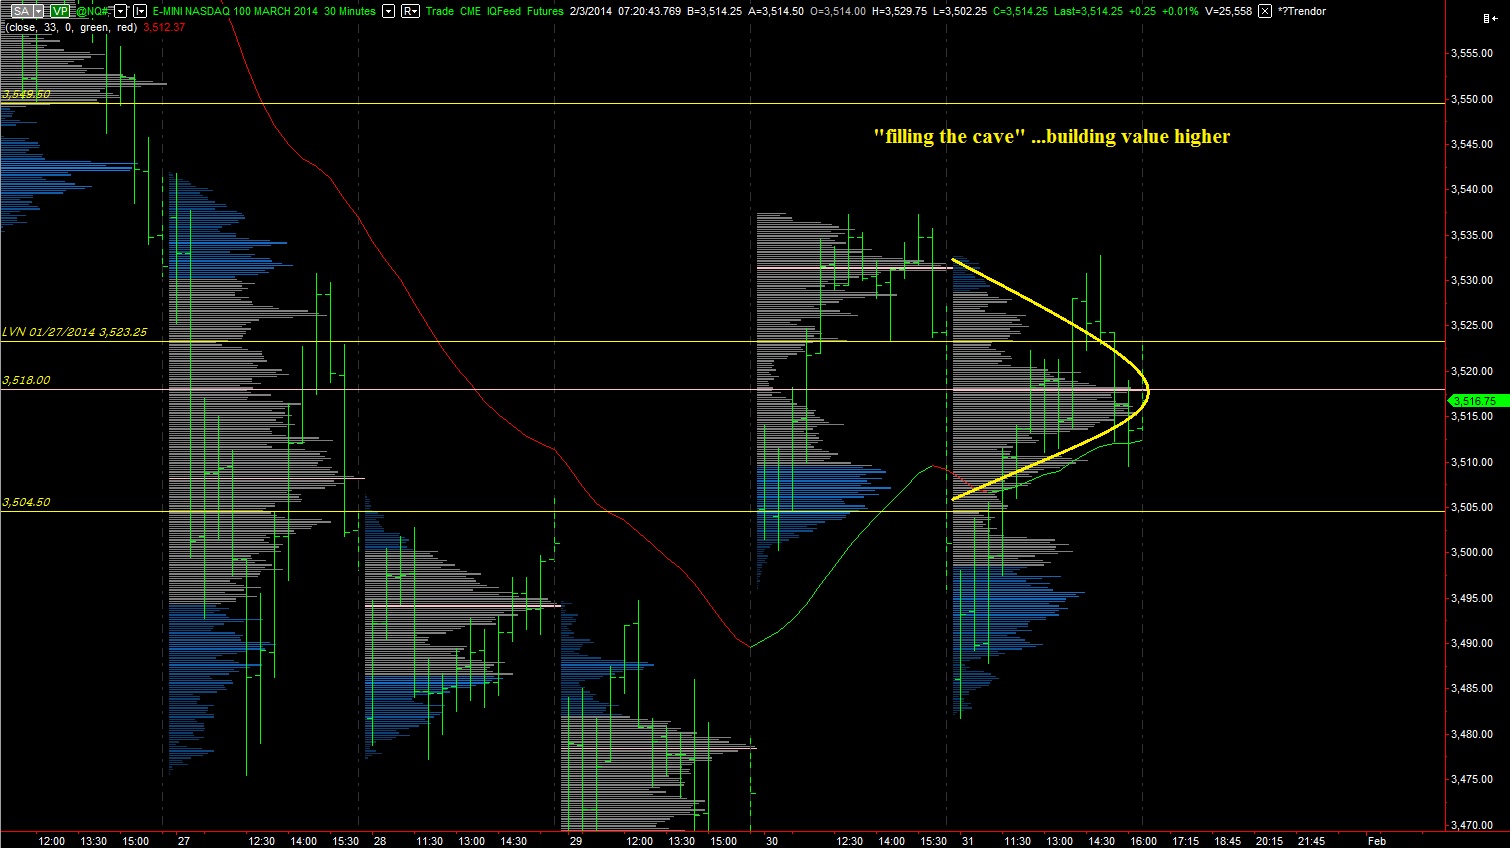
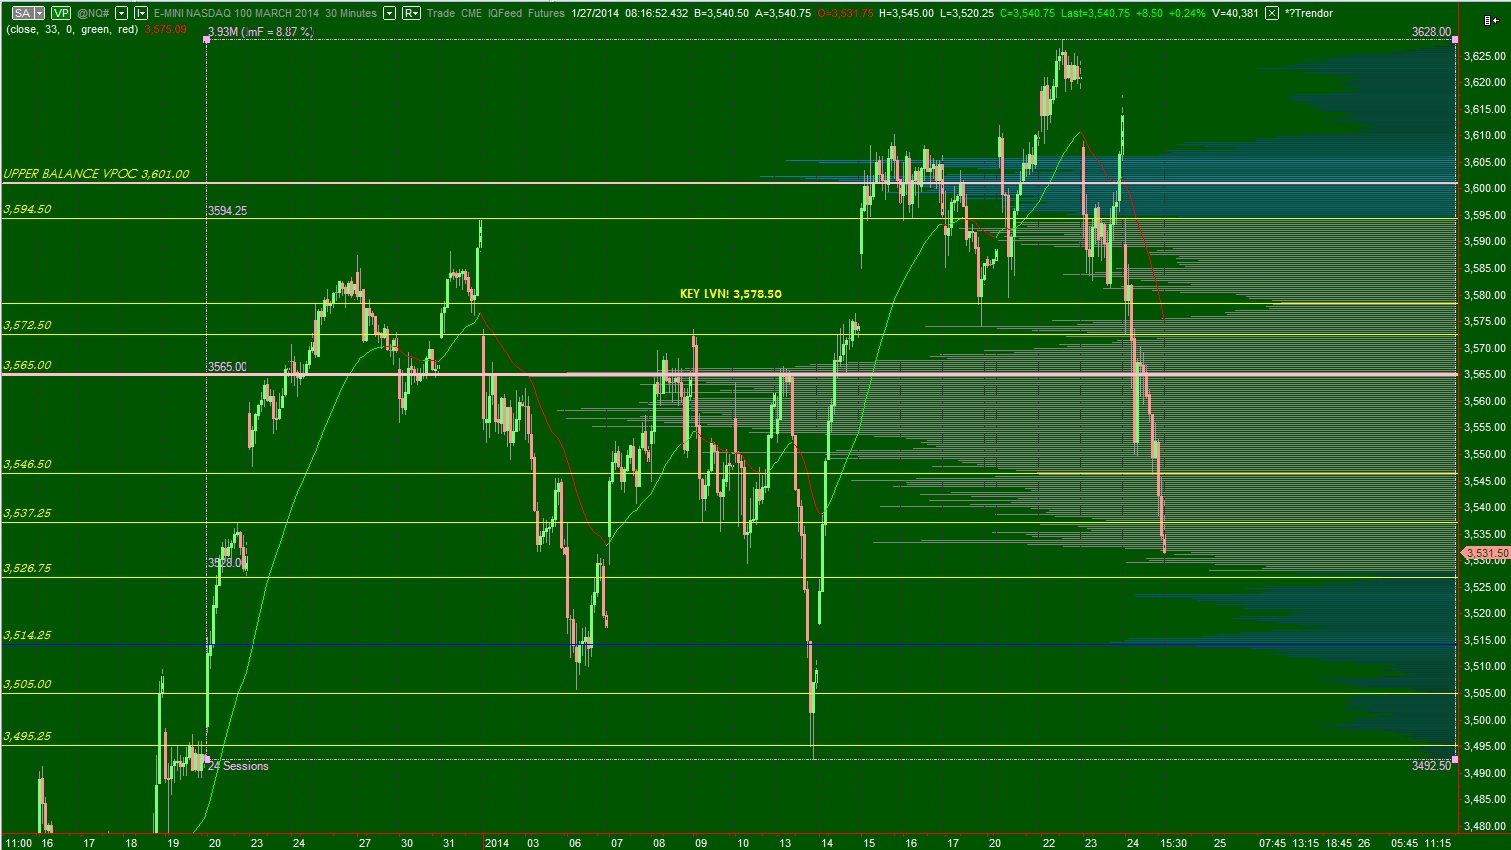
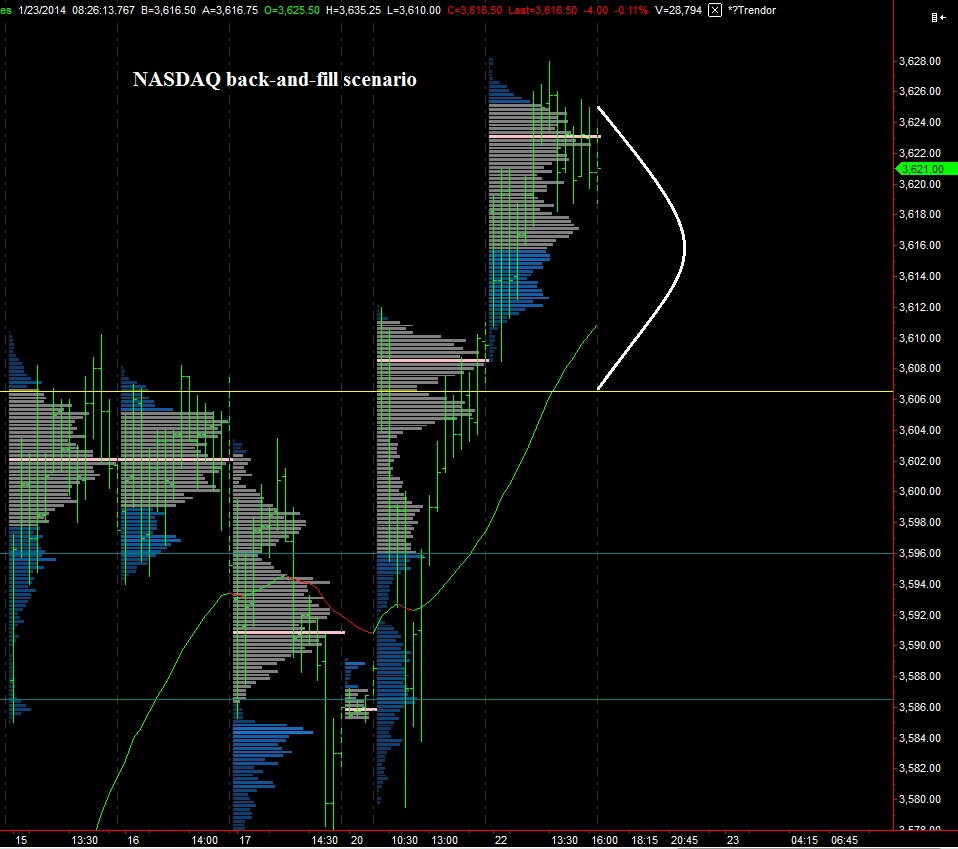
Taking to the composite, my expectation is for sellers the attempt another push early on.  My algorithmic target is from 3435.50 – 3433.50.  This level is near the Monday lows.  I would expect these levels to hold price initially.  This action would also shore up the gap left behind yesterday morning.  From there, I expect us to trade higher and work inside of the volume cave from 3447.25 to 3433.50.  I have highlighted these levels on the following composite profile:


NQ__VolumeProfile_02052014

Comments »

The Day After a Trend Day

In market profile theory, one of your goals is to detect trend days as early as possible and get on board the move.  One of the catalysts for a trend day is an opening drive.  The opening drive features one maybe two ticks in one direction, then a strong drive in the opposite with hardly any overlap in the TPOs (or 30 minute bars).

Yesterday we had a slightly different open, the open-rejection-reversal, but it indeed sparked a trend day.  It could be seen a few other ways, too.  The volume profile print showed no definitive value area all session.  Instead volume-at-price would form a modest node and then press lower again.  We ended the day with value hear the low as can been seen on the following volume profile chart:

NQ_02042014_trendday

The market profile theory says any entry in the direction of the trend day offers a low risk entry into the next session.  Thus, any short taken yesterday could be held overnight with anticipation of being able to buy the position back at lower prices.  With this idea in mind, I have highlighted a few scenarios and also the relevant price levels for today’s trade on the following composite chart:


NQ__VolumeProfile_02042014

Comments »

A Heaping Dose of NASDAQ Context to Start The Week

The futures were active overnight, albeit slightly quieter then we have seen in recently.  We do not have any major premarket news on tap, thus our early analysis should hold relevant into the opening print.

As the USA comes online, the equity futures are trading slightly lower with the NASDAQ down 1.5 and the S&P down 0.75.  For the duration of this post, I will be focusing on NASDAQ futures via the /NQ contract.

We came into last week on the tail of strong sell flow from the week prior.  A gap lower on Thursday the 01/23 resulted in an odd print because afternoon strength took prices to the high of the session at the close.  The next day we gapped lower and printed a trend day down.  This marked the beginning of sellers taking control of the intermediate term auction.  We continued lower on Monday before finding some responsive buyers in what I perceived as panic trade lower.  The rest of the week the market began balancing out, and by Friday the intermediate term control was back in balance.  I have pictured the above commentary on the following chart:

NQ__VolumeProfile_02032014_INTERMEDIATE_TERM

The trading has been framed within the context of the sentiment cycle chart option addict introduced and often referenced.  I have been under the impression that action quickly worked through discouragement and climbed the wall of worry before ultimately printing aversion on Friday morning where we bought the dip.  If this is the case, I want to see quiet market action over the next few days—denial taking hold.

The other possibility is we have not even begun to see panic.  If this is the case, the market should accelerate rapidly to the downside, soon, blowing through intermediate term and long term control.  This is very much a possibility and a would be remiss to ignore this possibility.  I have a line in the sand at 3440.50 but should price begin accelerating violently to the downside, I may begin reducing exposure well before then.  Let’s run through who controls the auctions on various timeframes:

Long term control: buyers—this can be seen as a series of higher highs and lows on a weekly chart.  However, the daily chart is not as pristine as it was from October to now because we have made a lower low verses late December-to-early-January

Intermediate term control: BALANCE—we have a near-perfect bell curve intermediate term.  It is 87.5 points in range with a VPOC at 3494, which is slightly below the midpoint at 3498.

Short term control: buyers—buyers were able to get price back above the 33ema and hold value within the higher print.  This can be seen on the following chart, where the last two days of market action migrated value higher:

NQ__VolumeProfile_02032014

Overnight control: BALANCE with a slight seller edge—we have printed a bell curve overnight.  The sellers had a slightly better rotation factor then buyers.

Net of all of this context, you can see there is a power struggle going on, with balance dominating the conversation.  Thus we must monitor intermediate term balance.  The open is key too. It can give us early cues of who is in control on the day.  Is it two-timeframe action, back and forth, or do we see a strong drive from the long term buyer control?  Or does the seller come in and drive lower for an hour, reasserting their control on the intermediate term?

The key, in my opinion, is velocity of price movement, and the following value and its relevant levels:

NQ__VolumeProfile_02032014_INTERMEDIATE_TERM-2


Comments »

UPDATED: Symmetrical Balance

balance

Often times we mistake (or rather misunderstand) the underlying physics of beauty.  Your brain loves symmetry, much like you brain likes simple pop music songs.  No matter the pop jingle, your subconscious knows the structure of the song and when to sing along.  When you get the cue, your brain releases chemicals that make you happy.  The same holds true for top models, they are symmetrical.

What does this all have to do with the markets?  The intermediate term control is now back in balance, after being dominated by sellers for nearly a week.  Look at this lovely Gaussian distribution.  Your move, mother market:

NQ_Balance_01312014


UPDATE: Look at ANGI showing some nice, round bottom symmetry:

ANGI

Comments »

High Volume Selling Overnight

Good morning, good morning, here we are, another month end.  Michigan is showing early signs of snapping its cold spell after setting an all time snow record in January.  Bravo, mother nature.

We have lower equity index prices overnight, ahead of some important premarket economic numbers.  I have very simple expectations for today, and should they occur, I will ride into the weekend full long, malted liquor in hand.  My expectation on the day is for a higher lower verses Wednesday.  If higher low, then press, else begin reducing exposure.  This last sentence is much like how I communicate with robots.

We are currently set to open out of value, out of range in the NASDAQ futures which printed over 40 handles of range on above average volume.  This creates a high risk/high reward environment which fits well into the context of our road map.

The month end framework fits well into our road map, too, because often you hear bears groan about “afternoon markup” on the last day.  A late day rally would put a bow on everything we have mapped out this week.

There is no decisive balance overnight, but value never managed to follow price down and is still set at 3510 on the overnight profile.

Price is coiling ahead of our 8:30am information leading me to believe the market finds the news to be important and is waiting before making its next move, thus some of what I write now may become void.

Thus, I will offer out my finest price levels, for your viewing pleasure, on the following intermediate term composite chart:

NQ__VolumeProfile_01312014_INTERMEDIATE_TERM

Comments »

Morning Scenarios

Index futures went for a ride overnight, with the S&P trading a 22 handle range and the NASDAQ trading over 45 points.  There were several macro influences affecting the action as the market was given plenty of information to digest in the overnight hours.  From the volume profile distribution that was printed, I can see there was no consensus reached.

Overnight, we are out of balance with sellers asserting control.

For traders, a market out of balance creates the greatest amount of opportunity.  However, this is a high risk/high reward environment where tight stops, although prudent, are vulnerable to random market noise.  The best strategy is often smaller position size with a larger profit target and stop loss.

Interestingly enough, we are currently set to open inside of yesterday’s value area which would typically mean we are in a low risk/reward environment.  Should we sustain trade between 3500 and 3486.50 on the NASDAQ, we may see a very aggressive chop-like trade.  This scenario would make sense, a violent waiting room ahead of the 2pm FOMC meeting announcement.

Another scenario would be for the intermediate term sell control to reassert itself early on and drive prices lower to 3474.25 then 3462.75 and ultimately to the naked VPOC at 3458.  This would fit into the discouragement framework noted yesterday morning.  If instead price continues to drive lower, cutting through 3452.25, then we are likely to see an acceleration of selling and may be entering the true panic phase of correction.  With the market movers at the FOMC on tap, this possibility becomes greater, however this is still scenario number two for the day.

A third scenario is the long term timeframe entering the market and driving higher. This would require sustaining trade above 3527.25.  I have highlighted these levels on the following intermediate term volume profile chart.  I have also attached a daily volume profile for insight into a possible chop trade.


NQ__VolumeProfile_01292014


NQ__VolumeProfile_01292014_dailydist

Comments »

All About The NASDAQ

Friday we experienced a trend day down in both the NASDAQ and the S&P, with equities trading as correlative instruments to other macro products.  This corrective-type trading was different in behavior from recent trade, and the selling pressure was dynamic enough to push the S&P out of intermediate term balance dating back to 12/20.  What I find interesting however, is that the NASDAQ futures have not been pressed outside of the intermediate term balance dating back to the same date.

There are a few other divergences.  The volume price of control for the NASDAQ never moved to its uppermost distribution.  Instead is stayed in the middle of the action at 3565.  I will be focusing on the NASDAQ as the market works though this correction, as it attempts to demonstrate relative strength.

First I have drawn out a volume distribution dating back 24 sessions to 12/20/13.  This set of trading days represents the intermediate term NASDAQ balance.  From it, I have highlighted the key high and low volume nodes to monitor:

NQ__VolumeProfile_01272014_INTERMEDIATE_TERM

If the NASDAQ is going to sustain trade within the intermediate term, prices need to hold 3495.25.  In the past, these lower regions have been the site of strong buying demand.  Should that not be the case this time around, we may need to rethink our market stance.

The buyers are still in control of the long term auction, which can be seen on the daily and weekly composite charts (not pictured).

The trend down from Friday followed through for a bit in the globex session Sunday evening and into the morning, but buyers came in overnight and auctioned us higher.  Their actions left a tail on the overnight volume distribution suggesting responsive buying took place.  Early on, I will be on watch for a gap trade back down to 3531.50.  This would close the weekly gap and also take us back to the scene of overnight responsive buying.

I have a current upside algorithmic buy stop target of 3549.50 which coincides with a low volume node on Friday’s profile and an area of support that was converted to resistance during the final afternoon panic selloff.

To recap sentimental control:

Long term – buyer

Intermediate term – balanced with selling pressure

Friday – sellers, overnight – buyers.

Finally, here are the RTH profiles on the NASDAQ.  Note the plunging 33ema.  Price always returns to the 33ema.  Will price revert to value, or will value catch up to price?  See below:

NQ__VolumeProfile_01272014

Comments »

Keep These Charts Close Today

More waves of selling rippled through the marketplace last night, as the afternoon bounce in both the S&P and NASDAQ were faded.  A bit of a risk divergence emerged from the move.  While the S&P was able to take out our low on yesterday’s session, the NASDAQ held.  Since reaching short-term oversold conditions on both indices, we are coming off the lows into the early USA hours.

With my really fancy futures data (FFD) I get to a clean look at exactly the ticks where events of interest have occurred.  I share these ticks with you, finest people of the interwebs, because we should all have this information available while making our educated guess on market behavior.

I will make one note and then present my intermediate term balances.  Yesterday the NASDAQ market profile print had a smack of long liquidation—a temporary market phenomenon driven by forcing participants to liquidate their positions.  It resembles a lowercase letter b.  These typically signal a strong initiative seller entered the market in the morning, but the force of selling was met by sufficient buy flow.  As a result, no further progress was made in the afternoon.  This is what may have sparked the afternoon ramp.  Be aware there are large timeframe traders here, aggressively battling for control of an intermediate term balance.  Try not to get too beat up in the waves they produce.

We are on the [very] low end of intermediate term balance.  I will be looking for signs of buyers. I have highlighted this intermediate term balance using the following two volume profiles:

NQ__VolumeProfile_01242014_INTERMEDIATE_TERM


ES__VolumeProfile_01242014_INTERMEDIATE_TERM

Comments »

Back and Fill

Sell flow worked though the markets last night after the buyers pressed a bit higher during the globex session.  The S&P continues to lag the NASDAQ and one must start to consider which one of these indices is telling the story here.

The /ES_F (S&P electronic future contract) is currently trading 5 points below yesterday’s close.  The gap trade will be in effect today, as buyers work to fill this overnight void.  I have envisioned more back-and-fill action for the S&P as it continues working through intermediate term balance.  Should we instead see an aggressive drive away from intermediate term balance, it would suggests a longer timeframe trader is acting upon the market.  The first chart is a scenario I envision, and the second highlights the intermediate term balance and key levels within it:

ES__VolumeProfile_01232014

ES__VolumeProfile_01232014_INTERMEDIATE_TERM


Turning our attention to the NASDAQ via the /NQ_F contract, we see prices made new swing high yesterday.  It will be interesting to see if these prices sustain.  Overnight the market found buyers at 3610, the intermediate term value area high, and quickly rotated higher.  I will be keen on this level today as a break likely brings a retest of the VPOC at 3602.  Here is the intermediate term balance in /NQ:

NQ__VolumeProfile_01232014_INTERMEDIATE_TERM

Finally our NASDAQ daily market profile is presented below.  You can see it printed a high VPOC suggesting value is migrating higher and perhaps beginning the process of discovery higher, in hunt of new value.  We are set to open inside range, inside value today.  Thus we are presented with a lower risk/reward environment intraday.  Keep in mind a strong drive (either direction) at the open could change this sentiment rather quickly.  Otherwise, my expectation is for price to work through a bit of back-and-fill along with the S&P.   I have presented a scenario below:

NQ__VolumeProfile_01232014


Comments »

Carving Out The Bullish Case

One of the subtle cues the market gave us yesterday during the selloff was the divergence between the NASDAQ and the S&P.  As prices in the S&P made lower lows verses Friday trade, the NASDAQ diverged.  This is a risk divergence and was the first catalyst to take out your shopping list and build some risk.

Sellers were able to sustain control in the S&P on the net session by extending the initial balance lower, taking out prior day lows, printing a lower high/lower low, and pushing value slightly lower.

The NASDAQ was not as clear in regard to control.  Sellers extended the initial balance lower but never took out Friday lows.  We printed a higher high /higher low and value moved to its highest level this year.

Turning our attention to the NASDAQ, overnight prices went to new swing highs at 3621 before finding sellers.  Since then price has bounced around a bit in a relatively balanced manner with a bit of a buying wick up top.  This gives us two bits of sentiment.  First, swing highs are rarely made outside of regular market hours, thus the overnight high is vulnerable.  Second, the overnight inventory is net long, thus we may see some sell flow early on.

We are trading slightly above yesterday’s close which presents a potential gap fill trade back to 3609.50.

Overnight control, buyers

Yesterday control, buyers

Intermediate term control, buyers

Long timeframe control, buyers

I have highlighted a few upside targets, as well as levels of support I will be watching on the following volume profile chart:

NQ_MarketProfile_01222014

Comments »