iBankCoin
Home / Tag Archives: $COMPQ (page 30)

Tag Archives: $COMPQ

Back in Balance

The buyers continue to flex their control of the long term timeframe in the NASDAQ composite.  When we observe the daily chart, we can see their control as a series of higher highs and lows on the daily and weekly chart.

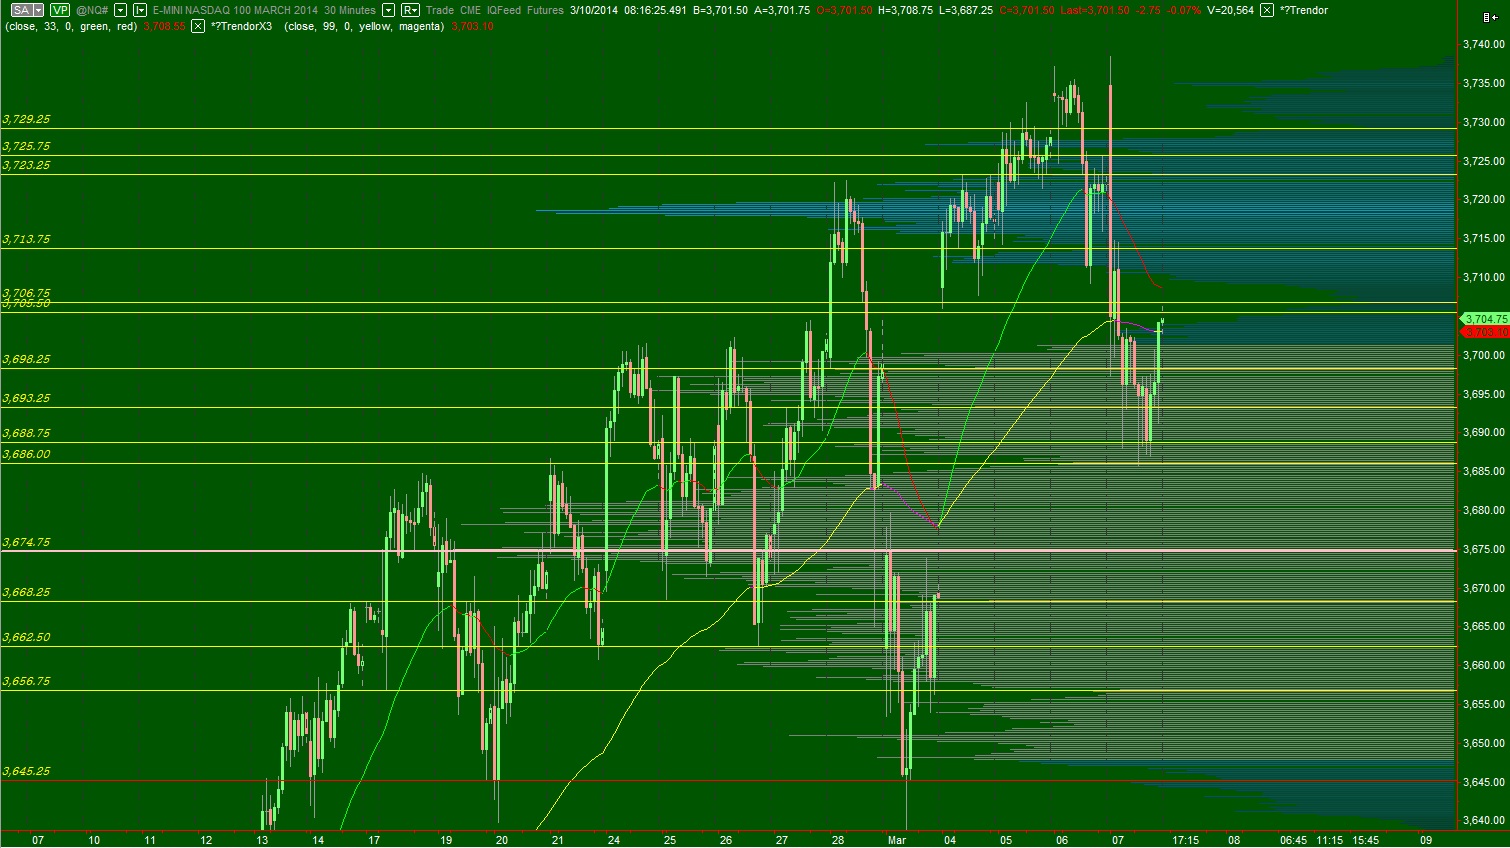
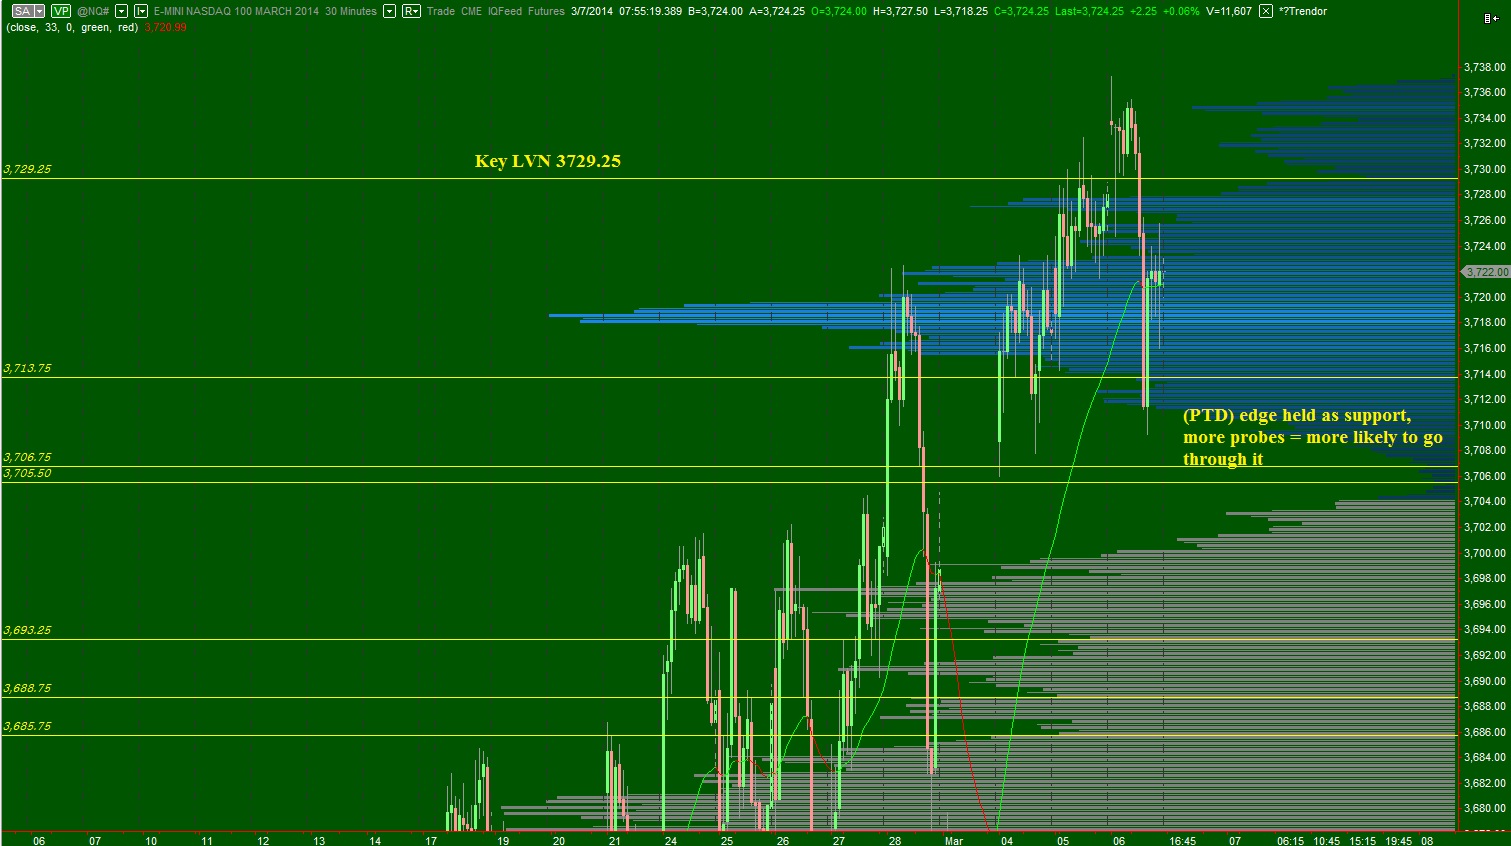
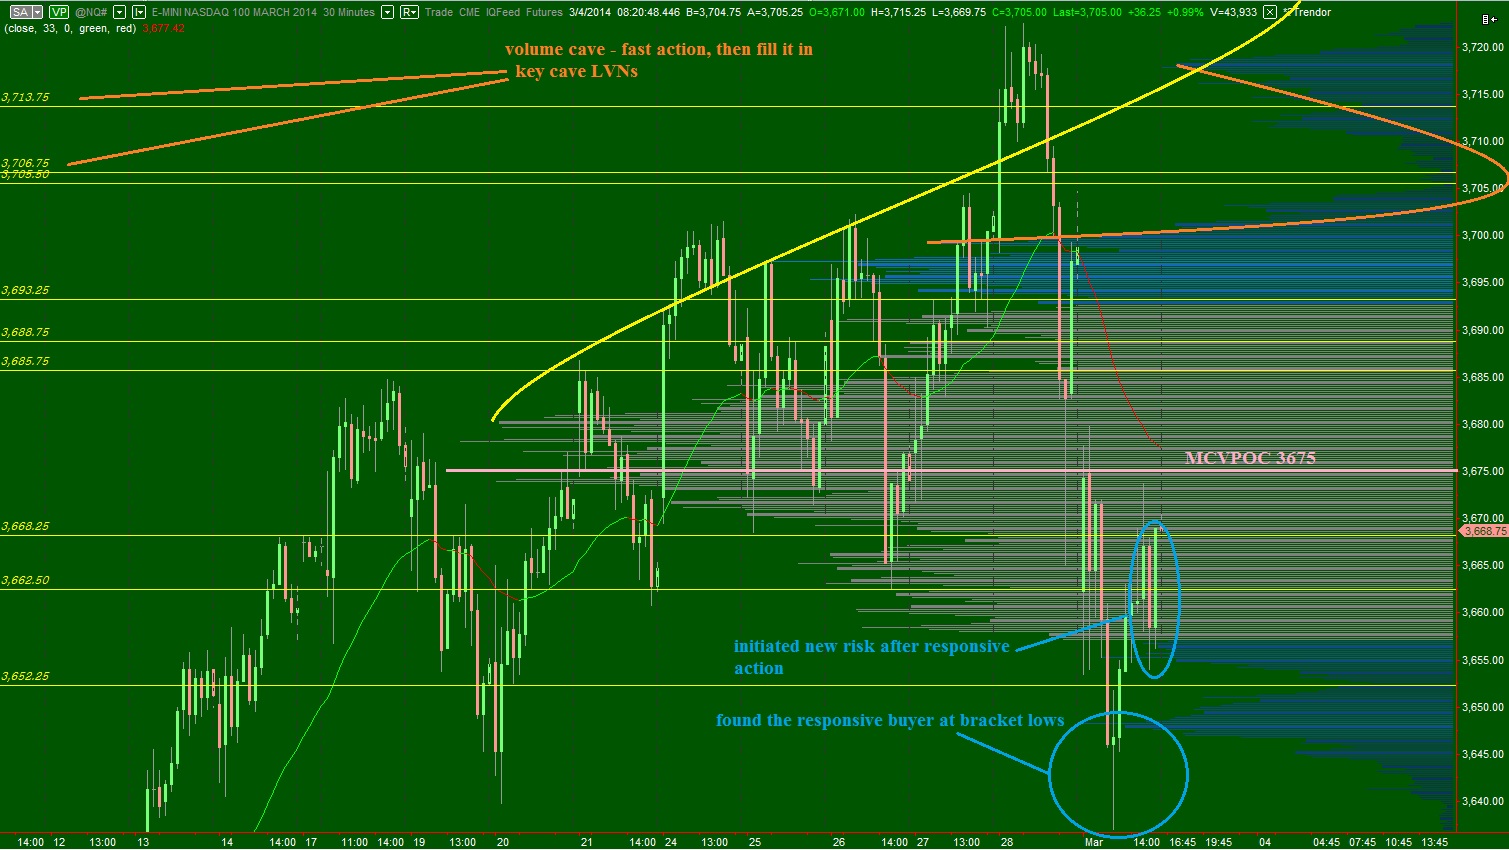
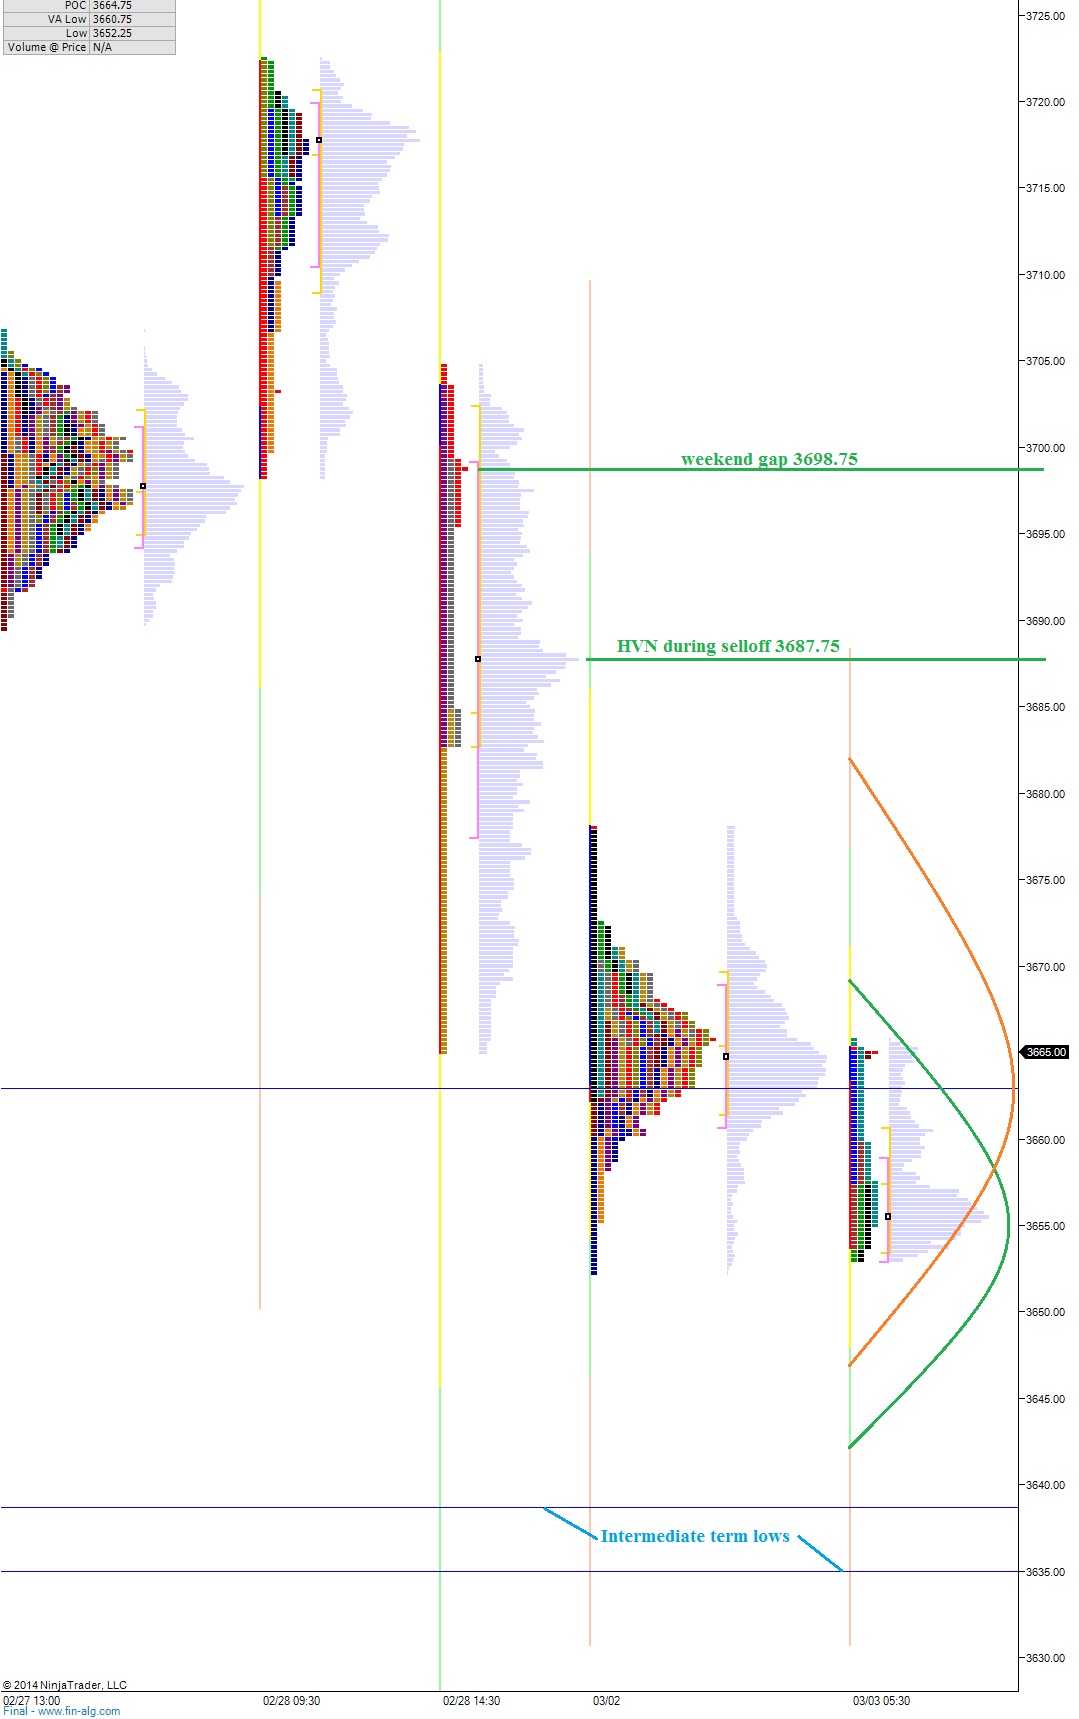
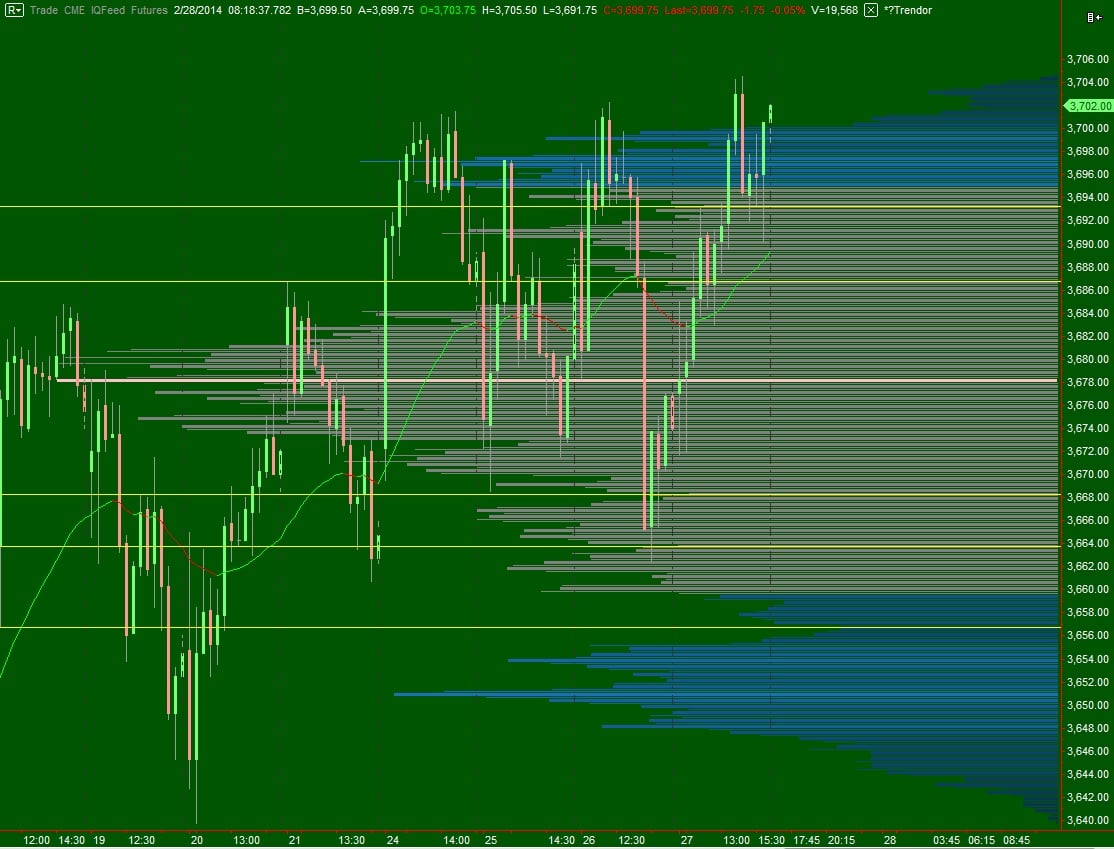
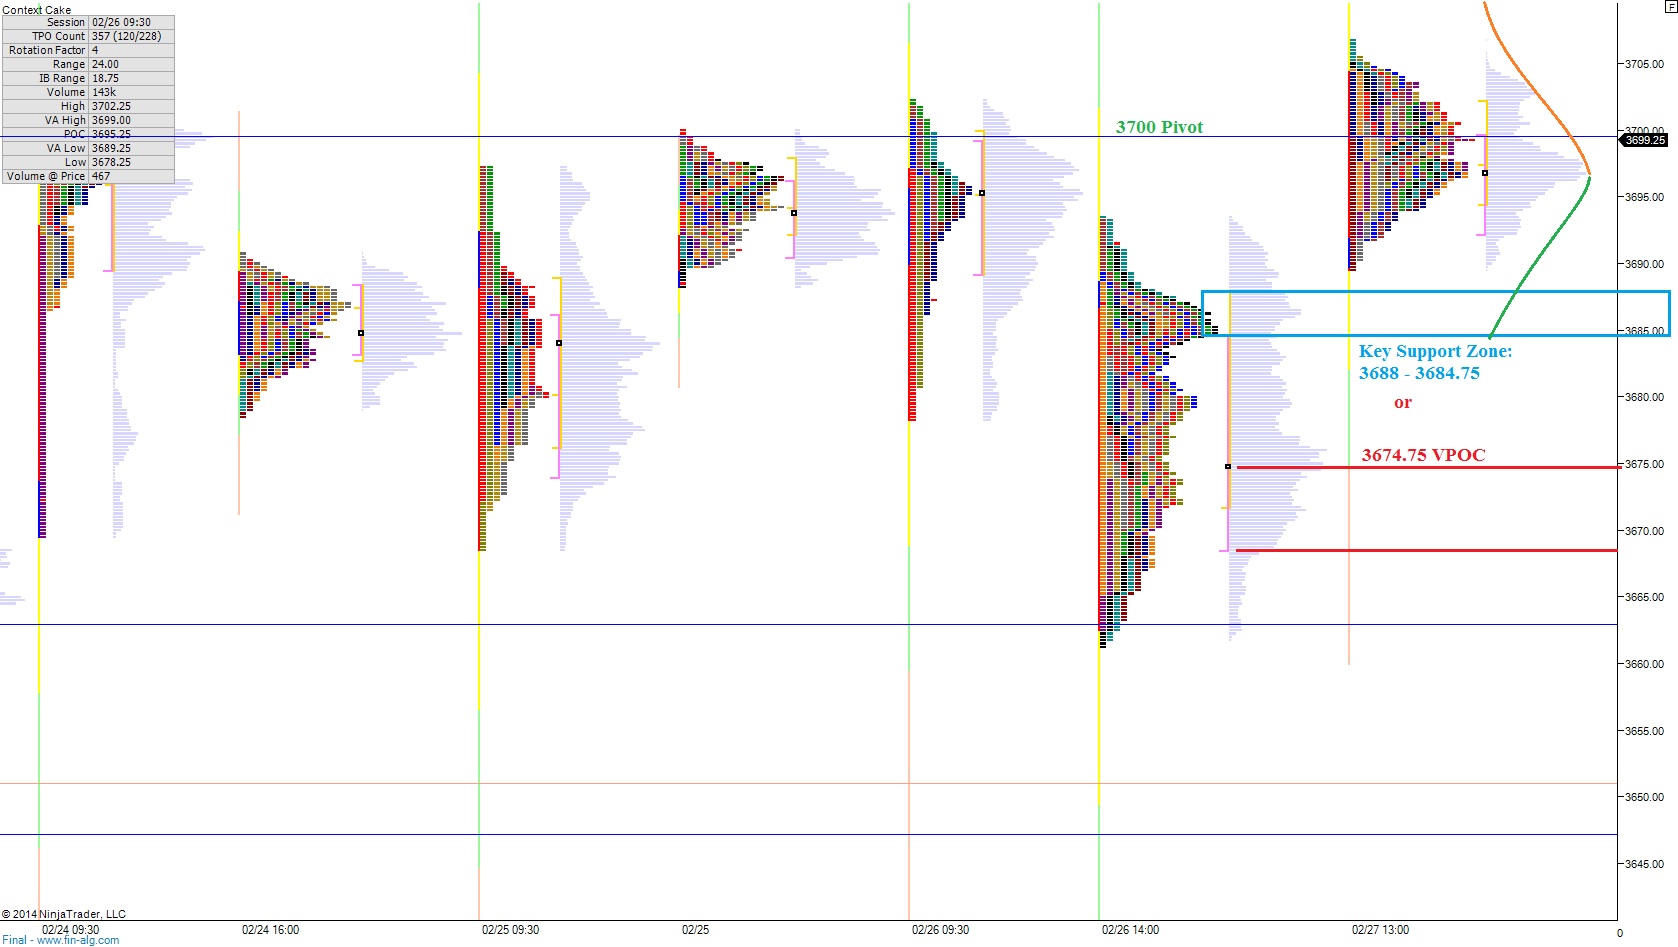
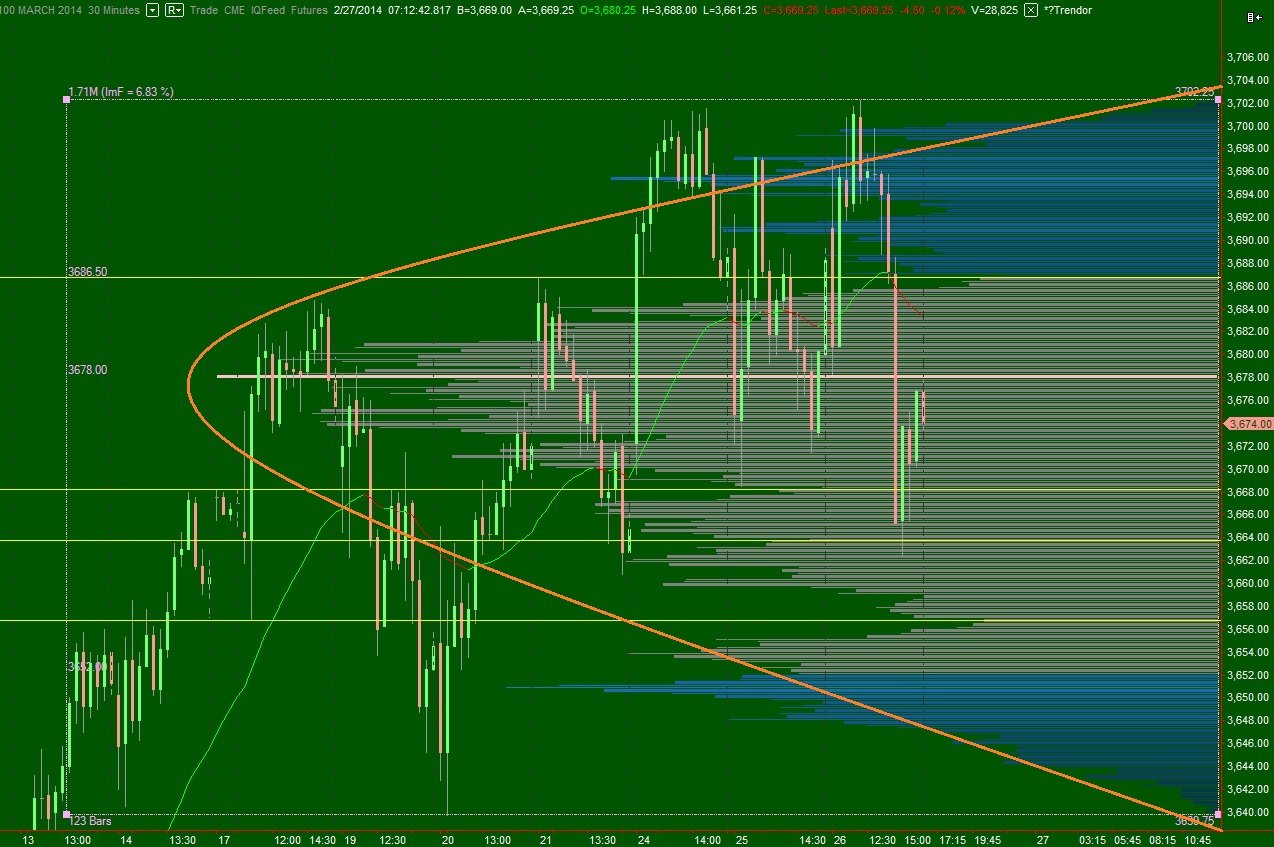
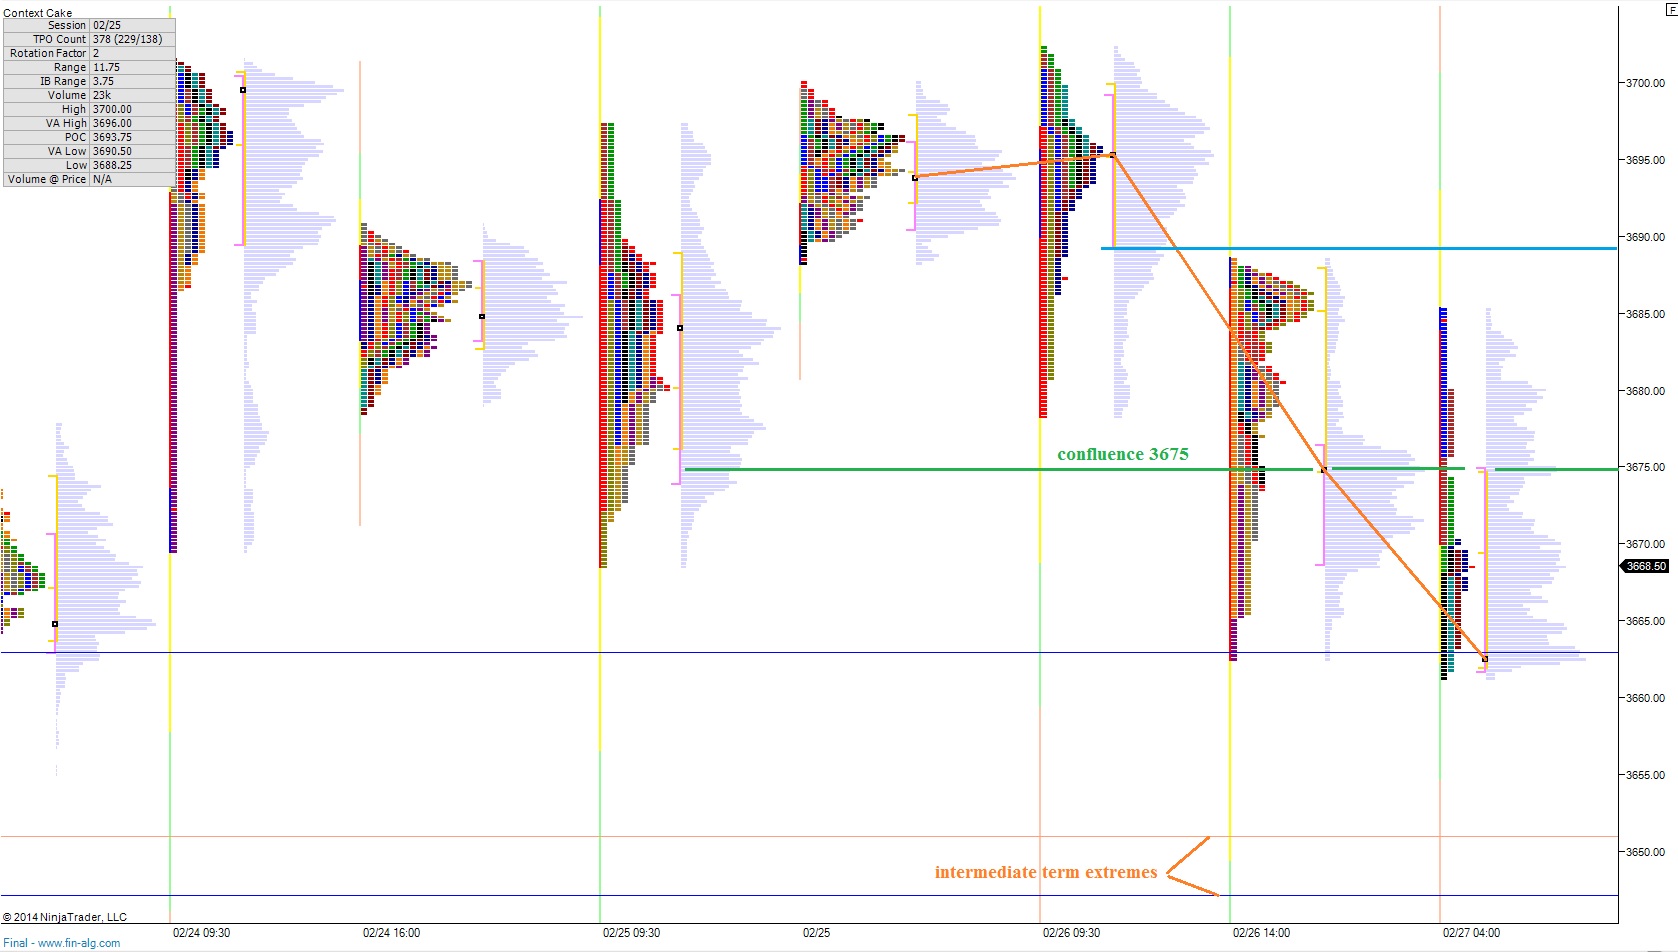
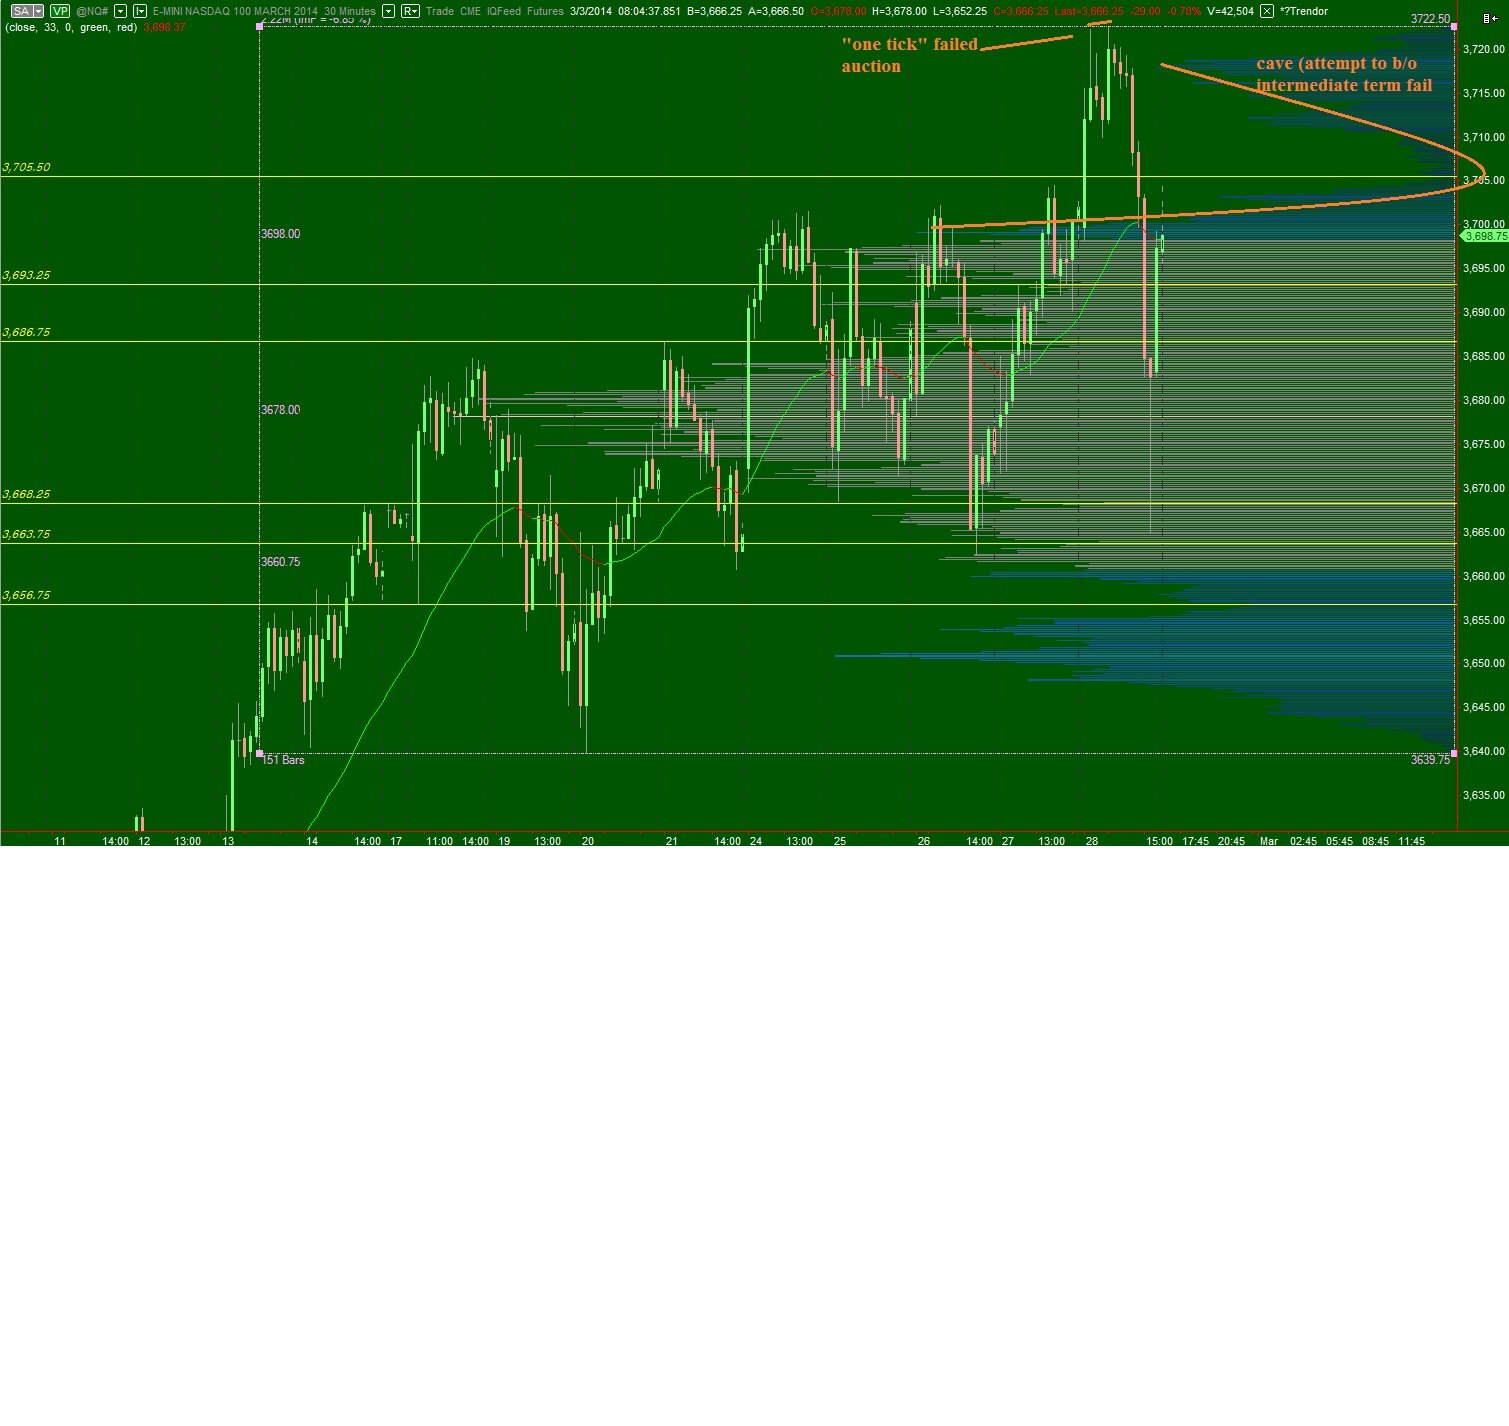
The intermediate term jerked back into balance after three days of showing potential that we would break the gridlock.  The NASDAQ composite has been in intermediate term balance for 15 trading days dating back to February 13th.  Last week’s action added a cave feature to the intermediate term balance, and we watched closely for the moment when price would slash through this low volume zone.  Now the question becomes, do we take the time to auction this level and fill in the cave, or do sellers reject us away from it, leaving behind a shelf of supply, or “bag holders”.  Volume point of control never managed to shift to our upper distribution.  Whether value shifts higher or price reverts back to value will be telling.  Price and value always converge, it is only a matter of how.  We continue to trade in intermediate term balance and unless Buyers can hold Friday’s low, a trade back to the mean at 3674.75 is a distinct possibility.  Here is my view of the intermediate term:


NQ_VolumeProfile_intermediateTerm_0310
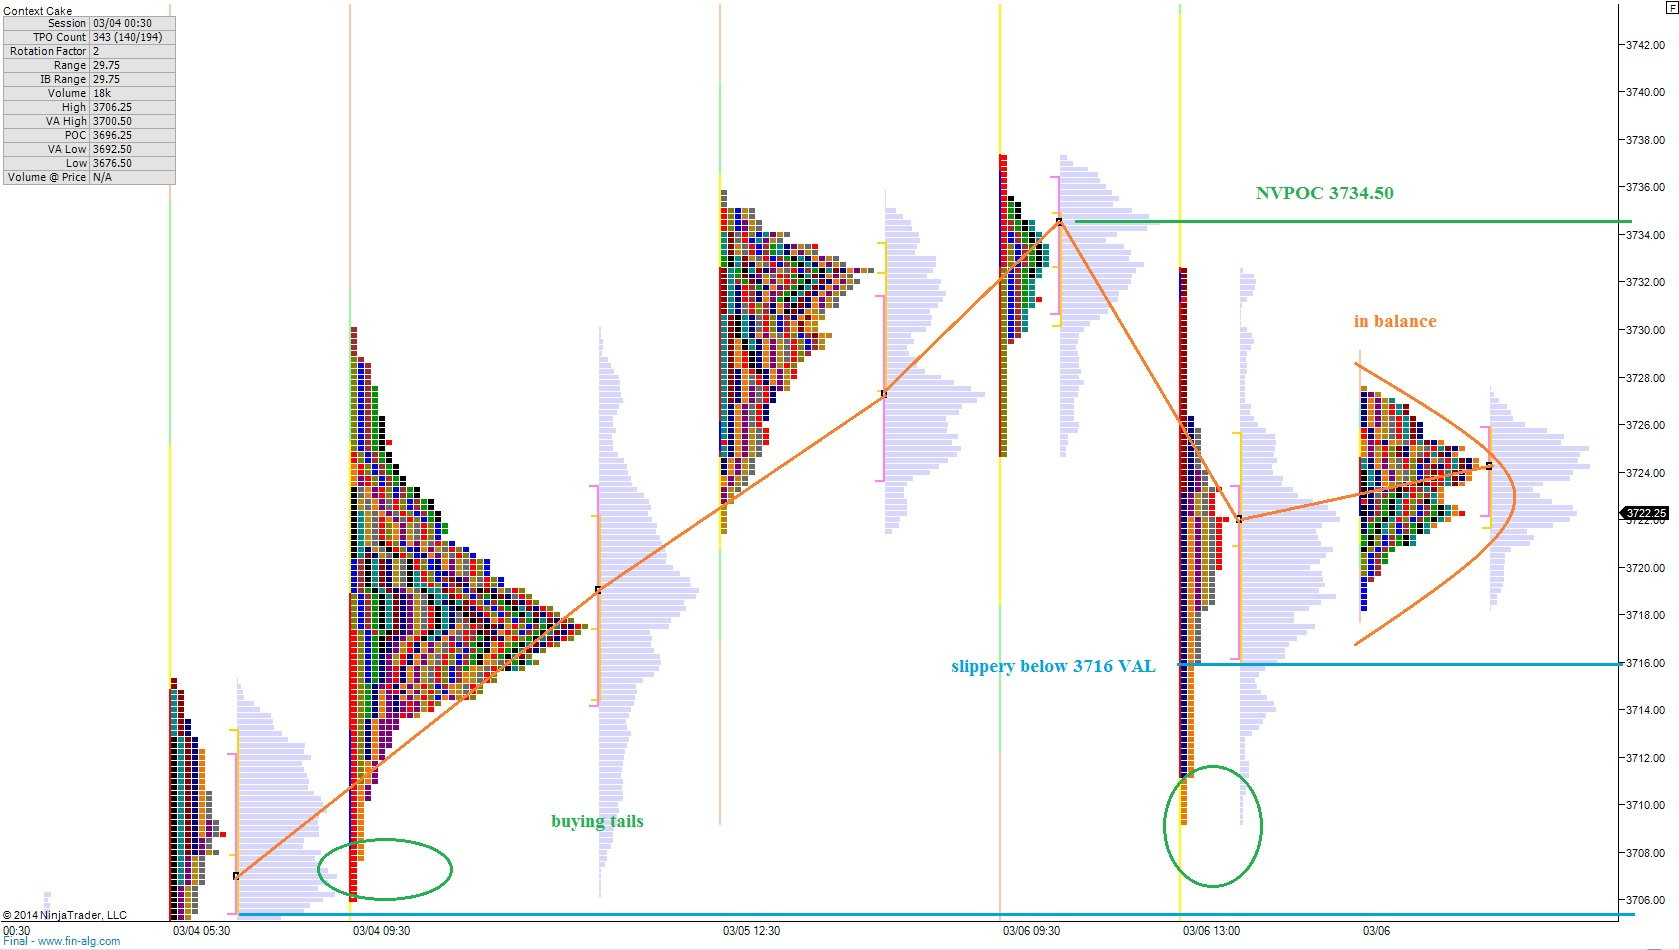
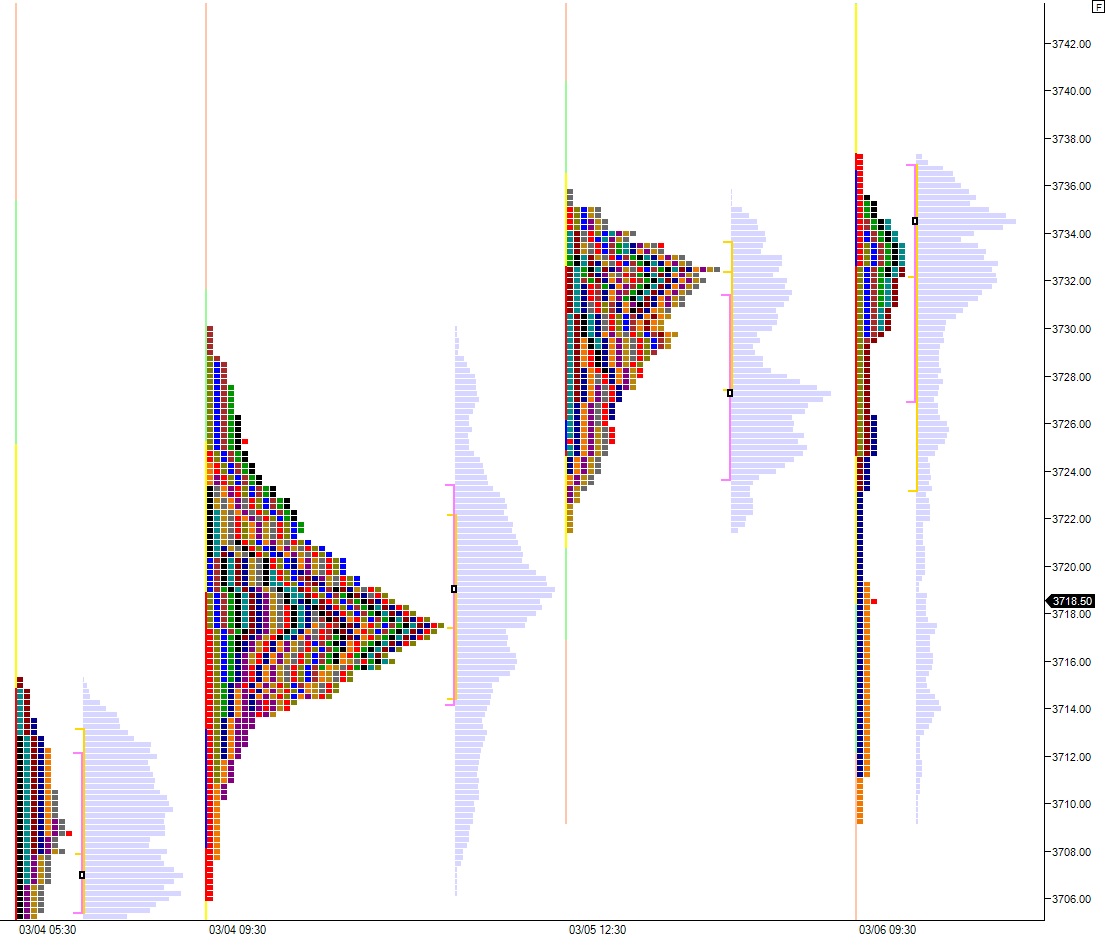
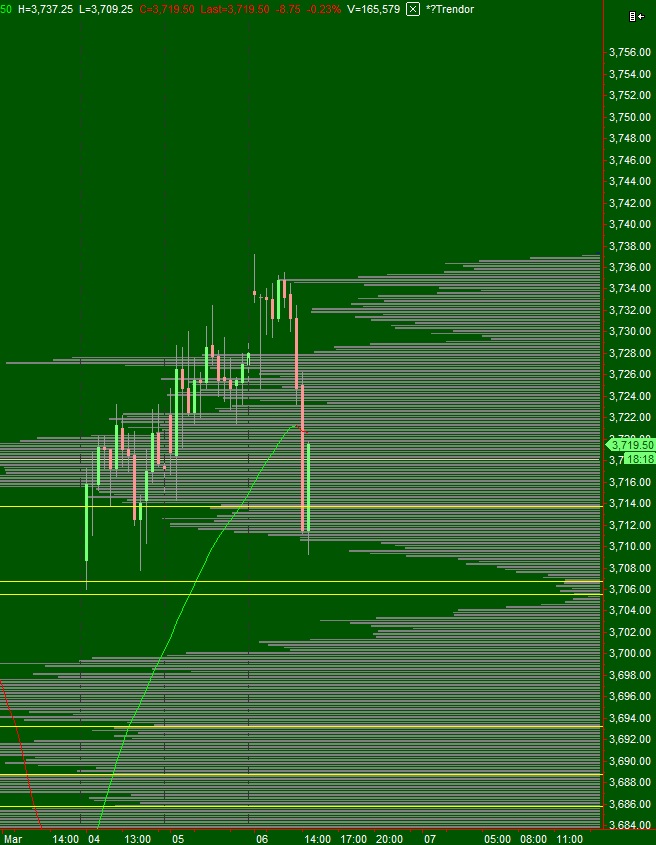
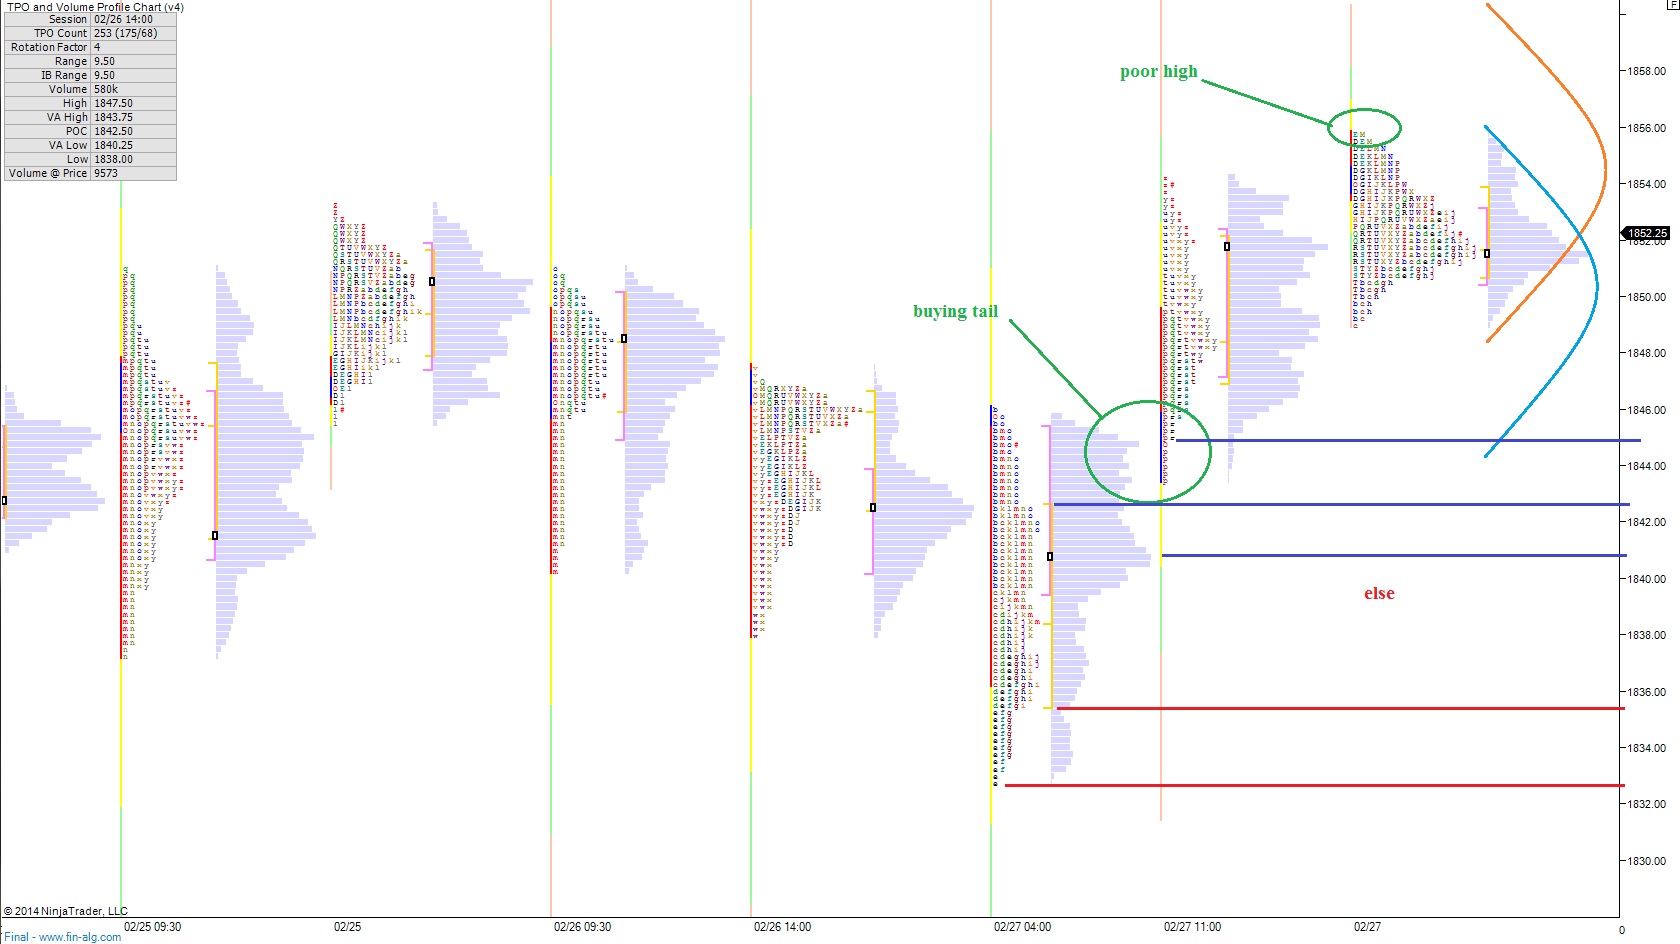
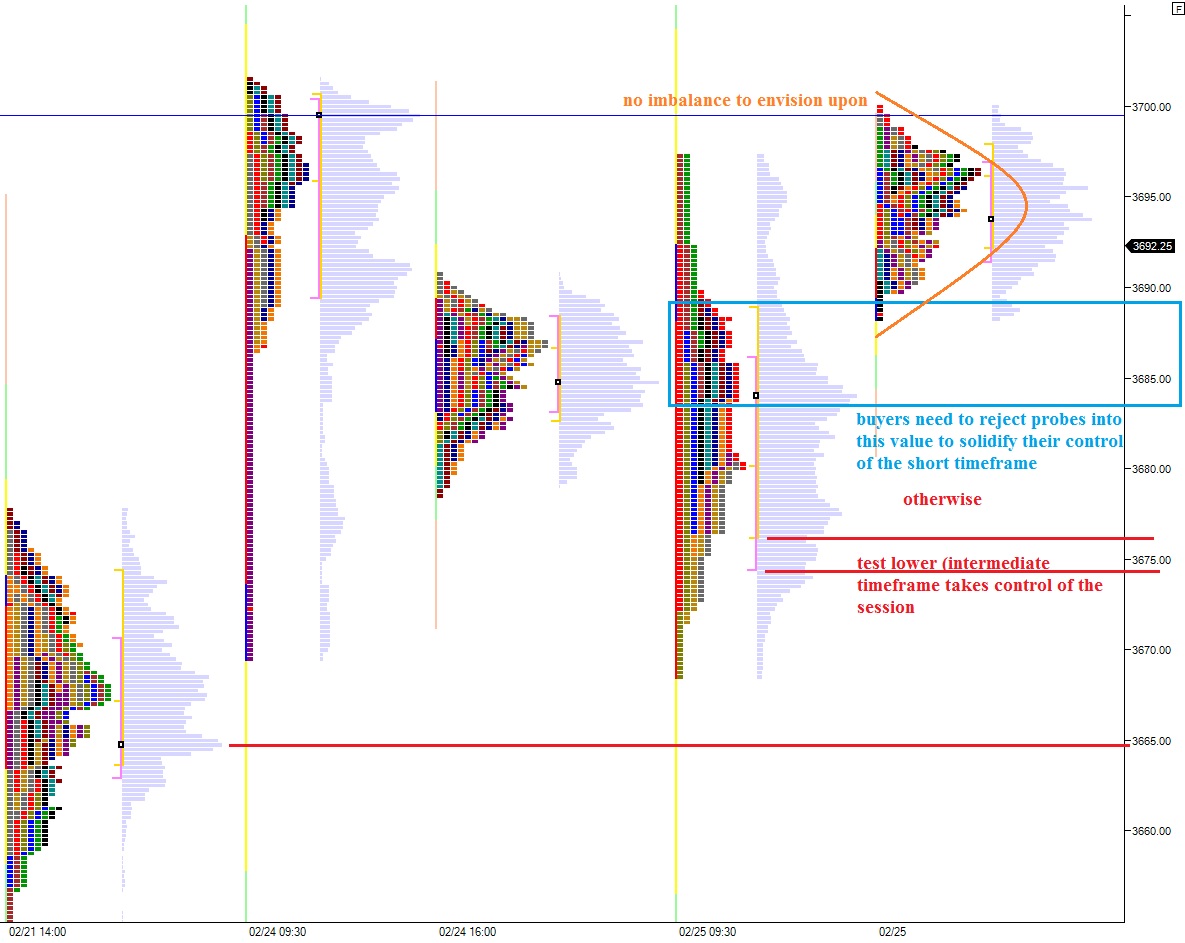
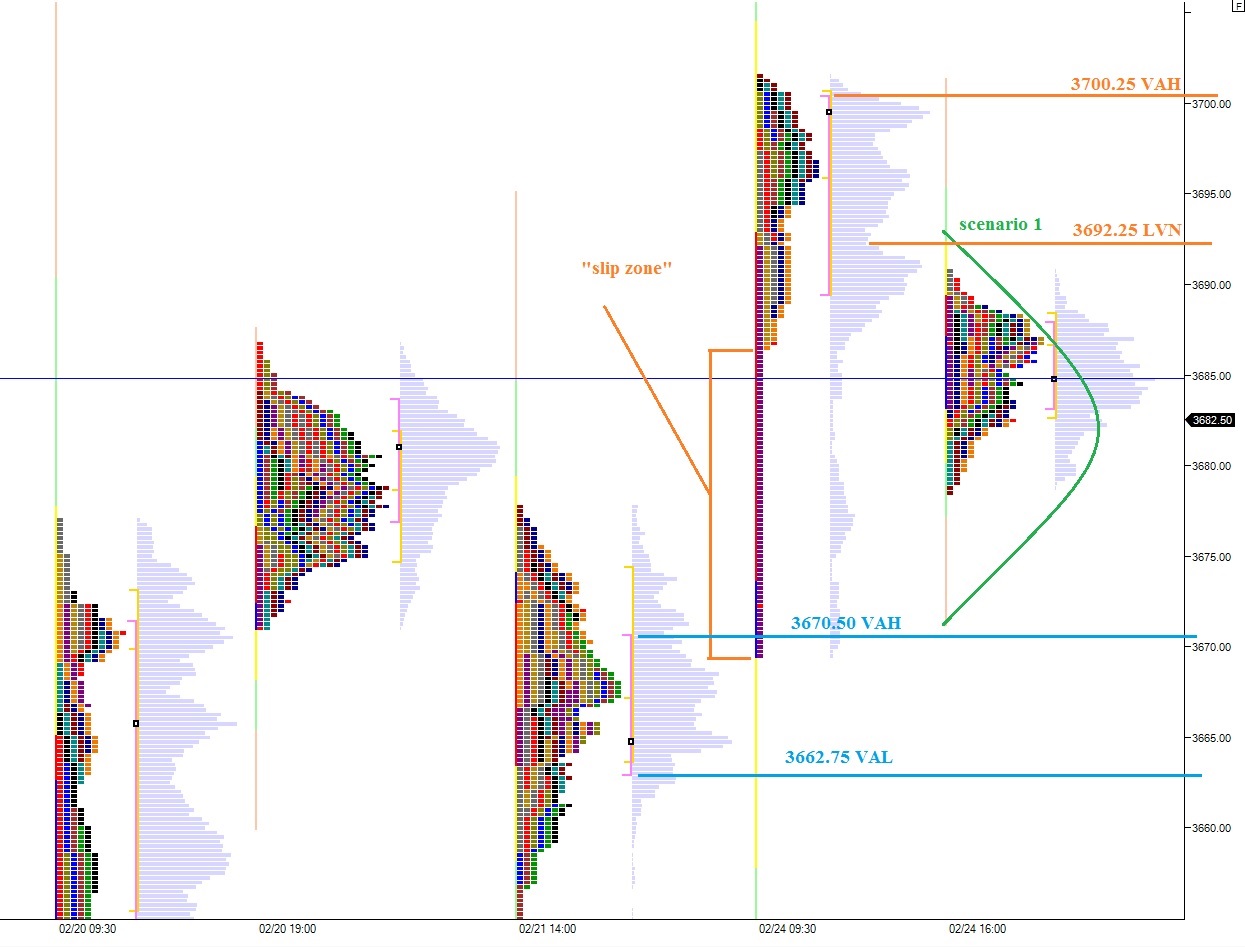
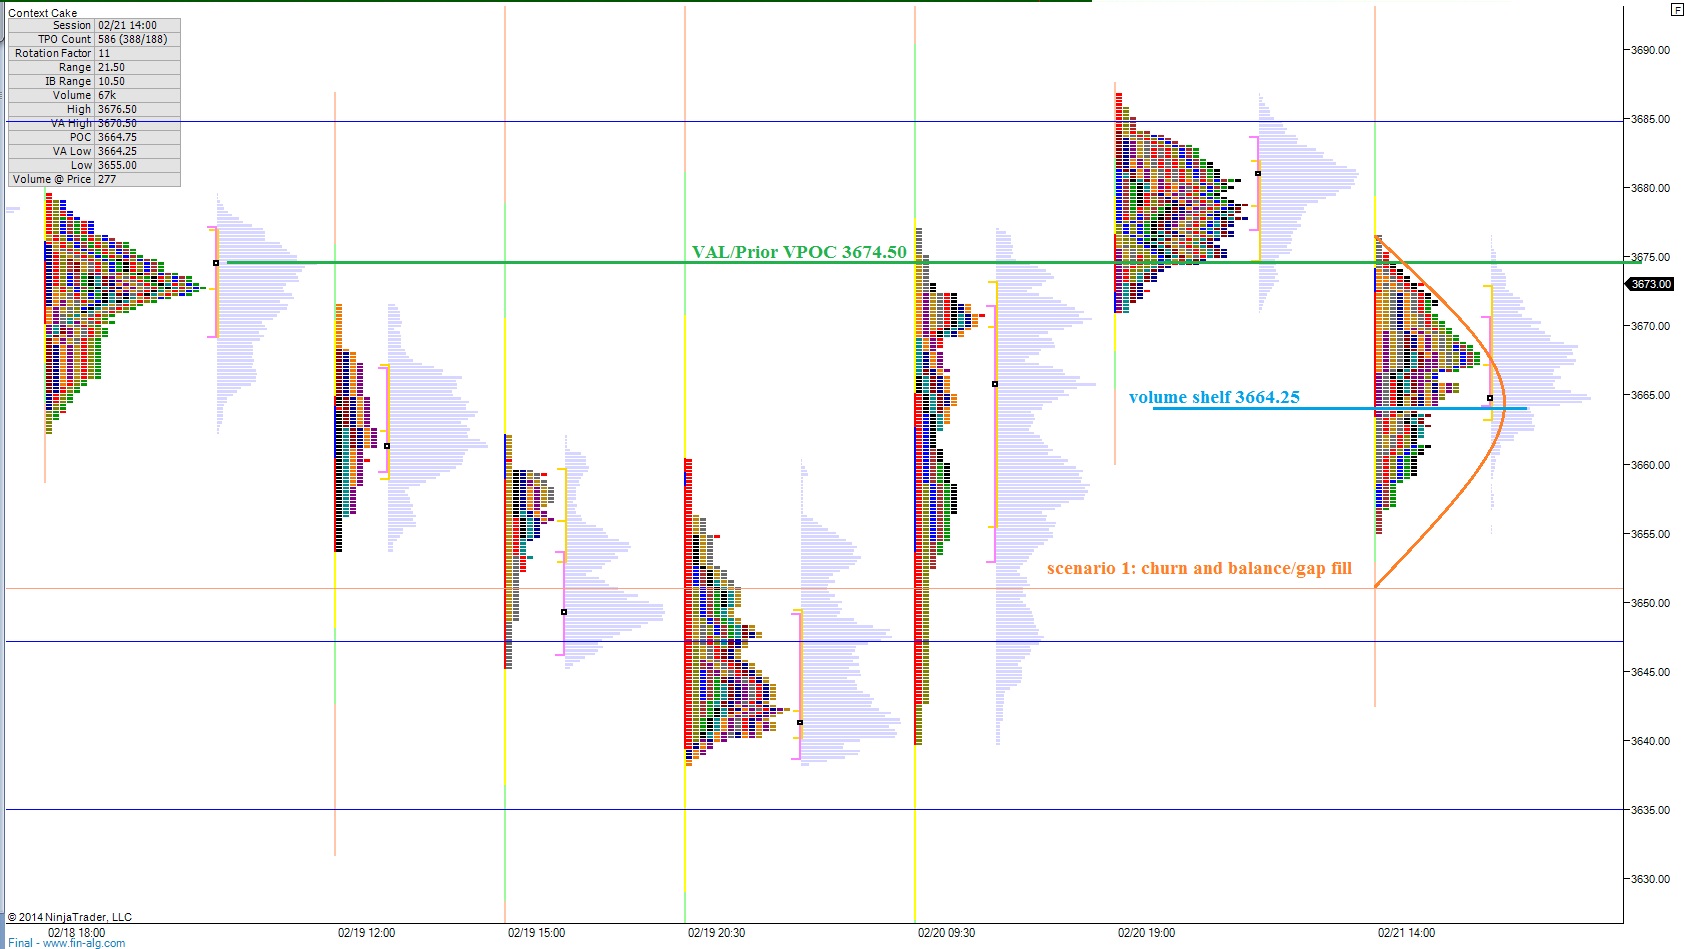
The short term auction balanced.  The sellers printed what is known as an outside day Friday, where price exceeds both the high and low of the prior day.  These can be reversal candles.  The key is follow through.  To me, follow through comes in the form of holding price below 3670.  The short term auction is otherwise in balance.  The following levels are how I envision early balance occurring:


NQ_MarketProfile_03102014

Comments »

Pre Employment Situation Analysis

We have some premarket data coming out which may materially affect the conditions of the marketplace.

Equity futures have been quiet overnight through some macro moves in currencies and metals.  It is likely the market is waiting to hear the 8:30am ET data before deciding on a direction for the morning.  The long term auction is controlled by buyers who can be seen grinding price higher along our upper ATR measurements (Bollinger Band, Keltner, etc.).

The intermediate term auction is still controlled by the buyer.  When the fast move occurred yesterday afternoon, I initially thought it threw intermediate term back into balance, but assessing the action in my calm morning state I can see we made a higher low.  Buyers still hold control unless they fail to make a new swing high.  I have highlighted some key areas on the following micro composite of intermediate term volume profile:

NQ_MarketProfile_03072014

The short term auction is balanced.  We can see value beginning to overlap prior days and no clear victor on the short term.  I have noted some interesting observations on the following market profile chart:


NQ_VolumeProfile_intermediateTerm_0307

Comments »

Race You To The Cliff!

We just had a fast move in the NASDAQ futures.

We are back inside Tuesday’s well established value area.  The move through value was rather swift.  Strong buyer response at the mouth of the intermediate term cave.

And I am done talking like a caveman, have a look:

NQ_MarketProfile_03062014_midday


NQ_VolumeProfile_intermediateTerm_0306_cavetest

Comments »

Fill The Cave

Equity futures are currently priced to gap up after printing over 40 handles in range on the NASDAQ.  As I write, prices are coming in a bit, and by the looks of both the intermediate term balance profile and the overnight profile, the action could be fast this morning.

Yesterday’s context report focused on the intermediate term balance, and whether price would stay in balance on the intermediate term or instead begin exploring lower.  Bracketed (or balanced) trade can be very frustrating noise for the trader if they are not aware it is occurring.  It can result in unnecessary capitulation and overconfidence at the extremes prior to getting faded.  The last two sessions in the NASDAQ have effectively set the floor and the ceiling for our balance zone.

If you have ever seen a live auction, you have seen this action.  Yesterday the market pressed lower in search of buyers.  They were found in the form of a sharp reaction.  Once a baseline bid is established, price can very rapidly move in the opposite direction to form the extremes of an auction.  Now market makers and specialists and hedge funds and retail participants meet and hash out the details of this balance to determine if the value is an accurate representation of the NASDAQ or not.

Long term auction is controlled by the buyer.  This can be seen as a series of higher highs and lows on a daily and weekly chart of the $COMPQ.  Yesterday we nearly brought the long term into a balance scenario, but we managed to print a higher low.  We need to monitor any retest of yesterday’s low very closely, and we need to consider reducing exposure should price be accepted below perhaps yesterday’s open at 4261.42 (on the $COMPQ).

The intermediate term auction is in balance.  This balance stretches back to 02/13 when we broke above the neckline of a V-shape recovery.  We are currently prices to open inside a cave inside the intermediate term auction.  Price will move fast in this low volume environment, at least initially, and often times we spend time filling these voids in prior to exploring elsewhere.  Intermediate term balance is aging, and a move away from it becomes more likely with every half hour that goes by.  I have highlighted this cave feature and some other observations on the following $NQ_F intermediate term volume profile:

NQ_VolumeProfile_intermediateTerm_03042014

We covered tons of ground, in the short term, but buyers are back in control.  This can be seen via the migration of value higher over the last few distributions.  However, the last two profiles suggest a slight downside imbalance exists.  It would not surprise me to see some backfill early on.  Given the overnight inventory is long, it would make sense to press into that inventory and test its conviction.  Conversely, should we see an opening drive, we can begin to consider the long term timeframe reentering the market, and we should join them.  I have highlighted the imbalances I expect to see resolved on the following market profile chart:

 NQ_MarketProfile_03042014

Comments »

Contextual Dose to Hunt Balance

The first day of the month is statistically favorable to the bulls in both the SPY and the QQQ.  People have written entire books about this stat, divulging in great detail all of the first day of the month scenarios and holding periods.  One of the findings of the study [spoiler alert!] is when the first day of trade for a new month falls on a Monday, the upside results are greatest.  The study also showed a 4 day holding period from the close before month end yields the most favorable results.  This is why you likely saw many traders pressing their longs into a cold war weekend.

Thus, to come to market this morning with price trading out of range, out of value from last Friday’s action puts the market dangerously out of balance.  We still have an hour and 20 minutes to at least return inside yesterday’s range which would slightly reduce the risk/reward environment, but as it stands we are set to open out of balance.

This presents a unique opportunity situation for the intraday trader.  The volatility will allow a disciplined trader to either end their day rather quickly or see several high probability trade setups during the day.  Either way, this type of environment gives much quicker feedback as to whether your trade choices are right or wrong.  As for existing positions, it makes sense to give more weight to the close than the open.  Let the imbalance get slugged out for several hours to allow some signal to show up through the noise.

Context is more important than ever in this environment, as we do not want to lose sight of the big picture.  The long term is still controlled by the buyer.  This can be seen as a series of higher highs and lows on a daily chart of the NASDAQ composite.  Buyer control of the long term was questioned by the market in early February.  The outcome was a sharp, snapback rally which affirmed demand to be strong and pressed prices to new highs.  A new test of this control would be price trading to 4100 on the $COMPQ index.

The intermediate term is in balance.  This balance spans 75.5 hours of regular trading hours which dates back to the afternoon of 02/13 when we blasted out of prior balance and went exploring higher.  A series of higher highs and lows degraded into balance ahead of last Friday where we attempted to move up and out.  After a failed auction at the new highs, price aggressively reverted back into the intermediate term balance.  After such a move, my expectation is for price to test the lower extreme using the velocity of the failed move to propel us lower.  I have highlighted this action as well as some key levels inside balance on the following volume profile chart:

NQ_VolumeProfile_intermediateTerm_03032014b

In the short term, sellers are pressing value lower of the last two distributions.  Their most recent thrust lower was rejected and a bit of a snack back rally has shown up in the early hours.  I have highlighted a few scenarios for this morning, one which sees sellers retaining their grip of the market via being the only active participant (orange) and another potential scenario which sees more balancing occur via a two timeframe marketplace (green).  I have highlighted these observations and a few more on the following market profile chart:

ES_MarketProfile_03032014

Comments »

Navigating The Stratosphere

One of the joys with mapping and tracking balance is you come to moments in the market where then hunt is nearly complete.  Throughout this week, we have been tracking our intermediate timeframe control because it was a very visible development which merited our attention.  We know the long term timeframe is controlled by the buyer, but intermediate term has been in a state of balance spanning back to February 13th.  The intermediate term continues to be in balance, as we are at the upper extreme.  From here, we can either launch into space, or fall victim to constant force of gravity which would lurch us back to the mean.  This is indeed an elevated risk environment.  I have highlighted the intermediate term balance on the following volume profile chart:

NQ_VolumeProfile_intermediateTerm_02282014_monthEnd
The short term is controlled by the buyer.  We successfully tested lower yesterday and once the market found a solid bid it went on an exploration higher.  The result was a new swing high and value migrating just a bit higher.  Value has not yet made a new swing high, though, which is a point we set on 02/24 right at 3700.  Big round numbers tend to behave in a unique manner, 3700 is no exception.  It is my pivot for intraday action today.  I have made some short term observations and envisioned a few scenarios on the following market profile chart of the NASDAQ composite:

NQ_MarketProfile_02282014_monthend

Finally, I think it is even more important today to watch the lagging S&P 500, which has significantly more room to run higher, in the short term.  A key component of this occurring will be strength in the transports and financials.  I have made a few short term observations of the SPX on the following market profile chart:

ES_MarketProfile_02282014_monthend


Comments »

From False Moves Come Fast Moves

Yesterday price in the NASDAQ composite stretched to a new swing high.  We poked up above and no follow through occurred.  One of our favorite trades as of late has been the false bear technical patterns.  This means, we wait for a technical chart setup which favors the bears occurs, then we watch to see if it follows through.  If it doesn’t, then you pile in, essentially calling the sell flow’s bluff.  The moves occurring after false moves are often vicious. The effect may be similar into the close of this week, should the sell flow continue overpowering demand.

It will be a more difficult task however, for the long term control of the market is controlled by the buyer.  This can be seen as a series of higher highs and lows on the daily and weekly charts of the NASDAQ composite.  It has been a resilient bull, and it certainly is an aging bull, but it’s still a bull until proven otherwise.

Intermediate term, we have a solid balancing act occurring.  This balance area continues to grow, and I continue to profile it for our benefit.  The intermediate term can be seen transitioning from buyer control to balance when a series of higher highs and higher lows became sloppy and now we are seeing indecision.  I have highlighted some interesting levels on the following micro composite of intermediate term balance:

NQ_VolumeProfile_intermediateTerm_02272014

The short term timeframe is controlled by sellers.  They have successfully pressed price and value lower since yesterday’s new swing high and have successfully negated the buying tails we have seen on recent market profiles.  We are set to open inside range, slightly inside value as of this post, which presents a medium risk intraday environment.  If price can sustain above 3675 we would negate the seller control on the short timeframe shift to a balanced focus.  Otherwise, I am preparing for a test of intermediate term extremes to ensure buyers are still as confident as they were on 02/13.  I have highlighted these observations on the following market profile chart:


NQ_MarketProfile_02272014

Comments »

Timeframe Roundup

Long term directional timeframe remains in the controlling hand of the buyer, who has been successful in their campaign for higher prices.  This can be seen as a series of higher highs and higher lows on both the weekly and daily charts of the NASDAQ composite.

The intermediate term is still balanced.  Yesterday we printed a lower high verse Monday’s session, and also a lower low.  Interestingly, the lower low was early in the session and was met with strong responsive buying.  However, not enough initiating buy flow came to push a new high.  Instead we printed a lower high and ultimately a higher low coiling before closing.  We can see the market struggling to make a vertical move out of our intermediate term balance on the following volume profile chart.  Should the intermediate term control dictate market direction today, we may see sellers targeting yesterday’s low at 3668.25 and then the low volume node at 3656.75.  I have highlighted this level on the following volume profile chart:

NQ_VolumeProfile_intermediateTerm_02262014

The short term is in buyer control.  Yesterday looks like an ugly candle print on a normal bar chart, but when you view the auction that took place via market profile, you can see the buyers were responsive at the lows and their flow was dynamic enough to press prices up out of our distribution.  Since then, they have held us above yesterday’s distribution and formed balance [acceptance] in our uppermost distribution.  To solidify the buyer control of the short timeframe, buyers need to hold us above yesterday’s value area either by rejecting attempts into the zone, or by avoiding it entirely.  I have highlighted this buyer goal on the following market profile chart:


NQ_MarketProfile_02262014

Comments »

Precarious Potential Opening Position

The futures drifted lower last night, after some selling took hold late into yesterday’s afternoon session.  The action was balanced, and featured a proper auctioning of price before finally determining a drift lower was in order.

The move pressed us down into the single TPO prints from yesterday which means we are opening in range/out of value verses yesterday’s trade which elevates the risk/reward for today’s session.  I have a rule that will not let me trade inside of single prints unless I am going with the short term trend, which in this case is down.

I have drawn a potential scenario for today, where I expect us to run the zipper down and test the value area high at 3670.50.  Should this occur, we may see a balance ensue.  If we continue lower without responsive buying, our next levels are the VPOC and eventually the value area low at 3662.75.  These observations can be seen on the following NASDAQ market profile chart:

NQ__MarketProfile_02252014

Comments »

Morning NASDAQ Trader Report

There has been solid overall auction activity overnight where we are seeing constructive action from both the buyer and the seller.  Late into trading Friday the sellers rejected the uppermost distribution we were forming.  Their action could be seen as a swift vertical movement lower followed by an hour of “acceptance” of the new prices via sustaining the levels.  Once the futures opened back up for business, we gave the area a solid auction lower, found a bid, and pressed above where we are currently finding selling.  The net activity forms a nearly symmetrical distribution of time and volume.

The profile however, does appear to have a slight imbalance which sellers could capitalize on early this morning.  It appears to be contingent upon how we handle 3674.50 early on, a value area low and sight of prior responsive selling.  If we again find sellers here in the early USA hours, we may see an attempt to balance out our current profile by trading down below the volume shelf at 3664.25.

Of course, if sellers are unable to respond at 3674.50, then we may see another drive for fresh highs.  Also, if sellers cannot push us over the volume shelf to balance out our current profile, then we would gain a valuable bit of insight, that buying force is great enough to disrupt the natural tendency of Gaussian distribution.

In the short term, I give sellers a slight edge in control.  This is void if they do not show responsive trading at 3674.50.  This short term control by sellers firms up if they push us below the shelf at 3674.50.

Intermediate term, we are in balance.  I have highlighted this balance and a few key levels on the following micro composite profile, spanning about 6.5 days of trading activity:

NQ_VolumeProfile_intermediateTerm_LateFeb2014

Long term, buyers are in control.  This can be seen as a series of higher highs and lows on the daily and weekly COMPQ chart.

Below is my vision for the morning, where I have highlighted the key price point and a scenario for the session using my market profile chart:

NQ_MarketProfile_02242014

Comments »