Fri Jun 21, 2013 8:02am ESTComments Off on Overnight Session Recaptures Long Liquidation
The overnight session featured three clean rotations higher, propelling the S&P futures as much as 20 handles off yesterday’s low and over 15 handles above yesterday’s close.
The key take away from the dynamic action is it erased the large liquidation break we spoke about yesterday afternoon, erasing all the progress it made. This adds to the likely hood that the move lower seen yesterday afternoon was in fact long liquidation and not new shorts being initiated. However, anyone overconfidently starting shorts into the move lower now finds themselves in the hole for a quad witching op ex.
Both of yesterday’s profiles are b-shaped, added additional visual confirmation to the move being long liquidation more than short initiating.
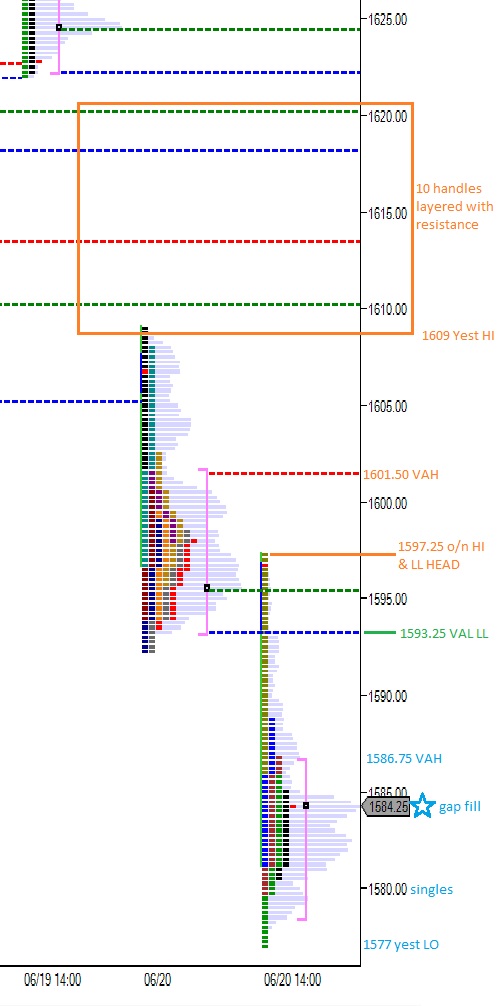
We’re currently priced right at the mouth of the liquidation which features a VAL price mark for us to gauge sentiment with. The VAL from yesterday’s first distribution sits at 1593.25.
I’ve highlighted the above price level and other key reference points in the following profile:
My swing portfolio wrapped up methodically giving back all second quarter profits today. I don’t know how closely you follow along, watching Raul get crazy on the tape, but when I stand outside the fish bowl and see myself the sight is horrific.
Stupid greedy bastard little fish.
But I replay every trade I take. I take notes, I brood. I make plans to take over the world.
All this I say like some kind of awkward apology if you’ve hitchhiked onto any of the MANY losing trades I’ve taken recently. I’ve been ADD trading, buying every tip, rip, and slip in the market.
No mas.
The overarching theme to my losers is bad entries. High risk entries to be more precise. It fucks with your confidence when it takes a 12 percent move to deem you “wrong”. At least it messes with mine. I compensate with smaller position sizes, but then I have 15 small positions clown raping me simultaneously and shit gets out of whack. Pardon all my swearing, I’ve lost mucho dinero (no Robert).
It’s been one stop out after another, if you read me on the twitter network you’ve seen them peppered out over my timeline. Brutal.
But now is not the time to sit in an inflatable pool of pity. As a matter of fact, it’s never time for pity friend. It’s time to pick yourself back up and be more powerful, more dangerous, MORE STUPENDOUS THEN EVER.
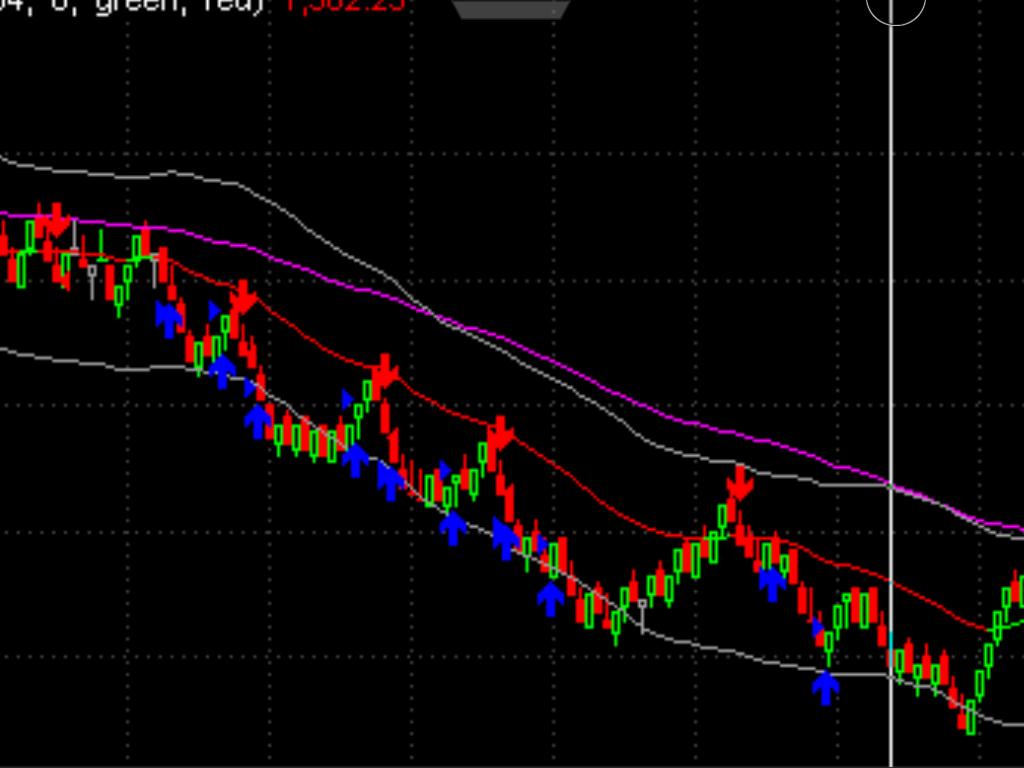
I started already by absolutely annihilating the liquidation break. Red arrows are my short entries, blue my covers. Look at this:
That’s the best god damned string of trades I’ve ever taken. I should only trade during this madness because the rest of the time you’re cold sweating and grinding out 300 bucks. It’s disheartening to say the least. To say the most it’s questioning every decision in your life that’s led you to trade futures.
The above string of trades is why I trade. I crushed. It felt amazing. That’s my planned trade. It cleared my mind, like making sweet love. I made sweet love to the tape all over the place. Anyhow…
If we’re entering range trading like I suggested last night, then we should be at or near the bracket lows. Thus a mean revision should go down, taking us back into the 33 and 9 EMA. That trade should earn some coin. That’s why I bought ZION into the bell. Banks make money with higher interest rates and ZION had some fantastic proprietary PPT stats going on. So I took the trade. Look at this entry, too. It’s low risk, down to about 26.75 and relative strength to boot, not bad.
Tomorrow brings anything, being a quad witching and all, but we have the technology, the money can be rebuilt.
You would likely perfer the NSFW version of the following video, go find it:
Thu Jun 20, 2013 8:02am ESTComments Off on Grade USA Bunker Busting Power
The sellers brought the force yesterday and overnight.
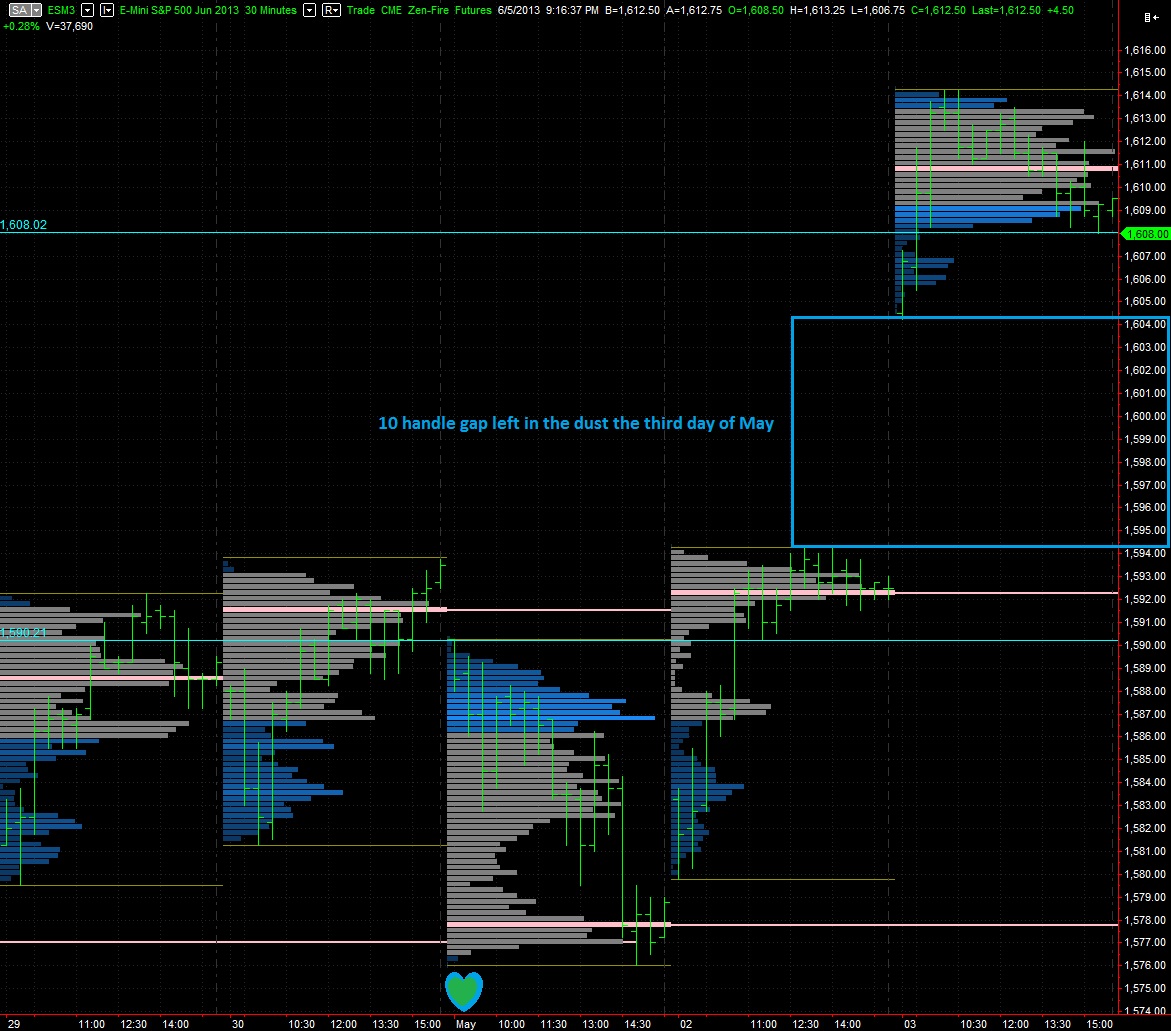
S&P futures continued lower after the cash close yesterday rotating as low as 1612.75 before stabilizing. Around 4am the sell orders began flowing into the markets again pressing the globex session to new lows at 1605.50. Since then we’ve stabilized again as we approach RTH.
The current size of the gap (over 10 handles) is often referred to as a pro gap, and often goes unfilled. However, given the overall choppy conditions of the market, I suspect a slightly higher probability exists than the typical low 40 percent odds.
Most important today however, is defining levels of potential support. I won’t be performing any knife catching feats in the futures today, but it’s important to keep these reference points in mind while gauging the sentiment of the market.
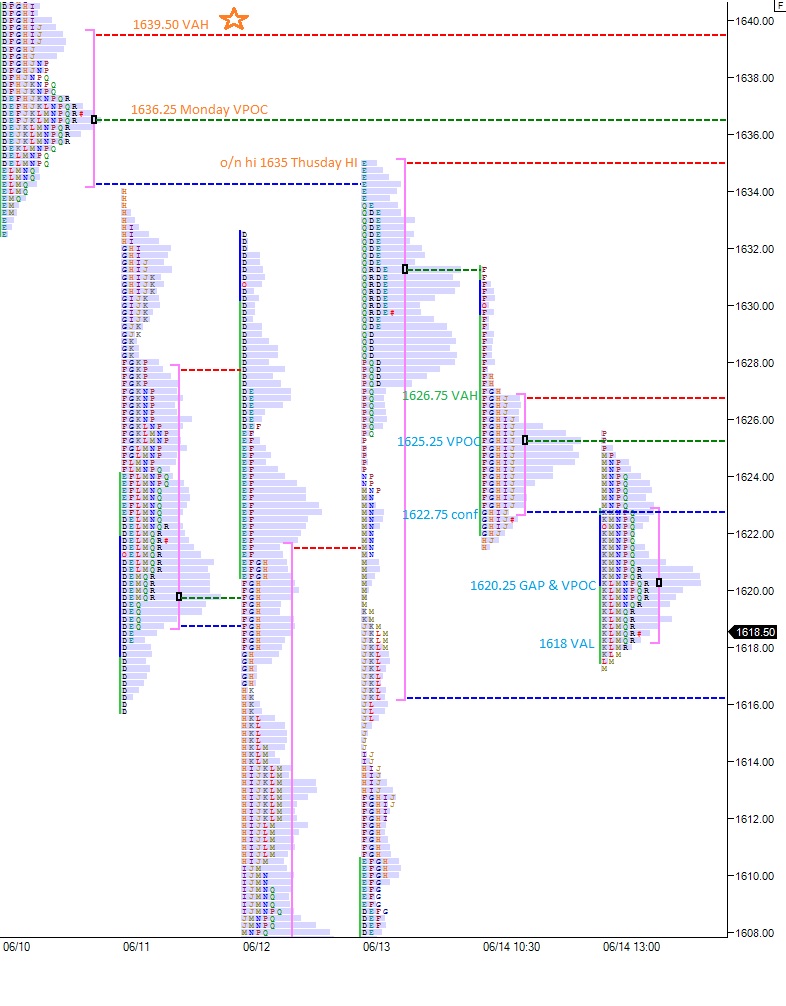
I expect some attempt early on by the buyers to press higher. Here’s the levels I’ll be keying off of in today’s trade:
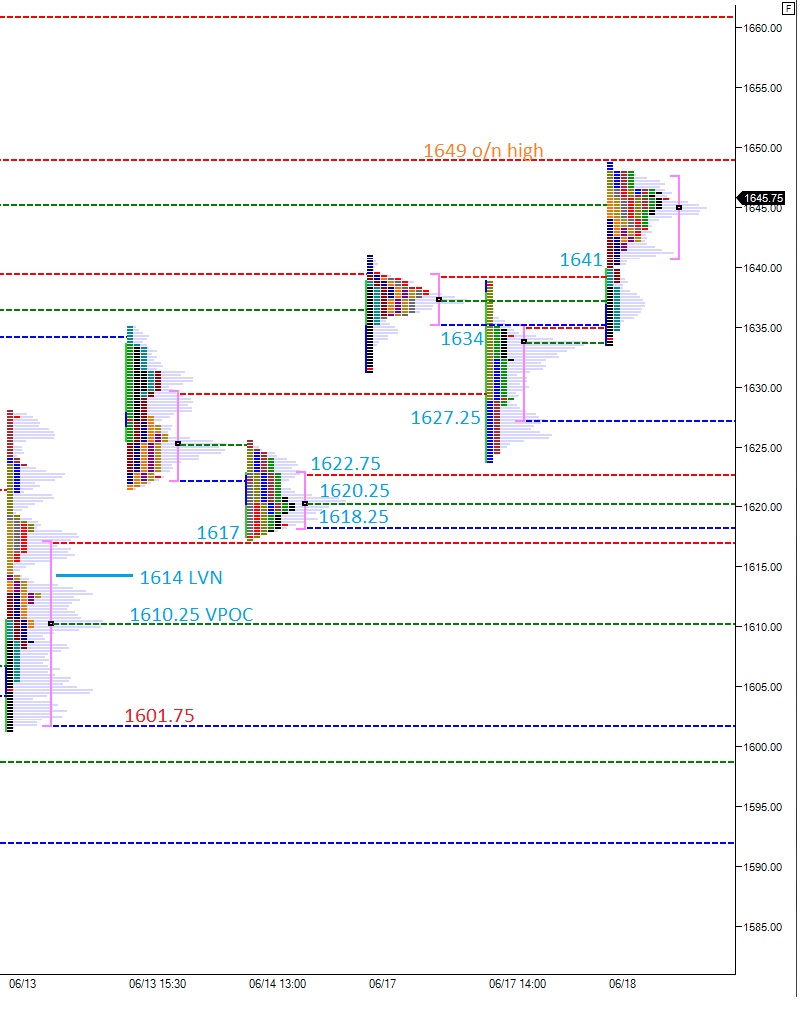
The overnight session featured a seven and a half handle chop which already sets the tone that the market is building energy. Up above, yesterday’s high of 1648.75 was tested twice and both times rejected. It now resembles a triple top. Any sustained trade above this level gets us moving fast. If we see price accepted above these levels only to fail, that would be a nasty bull trap.
Below the overnight chop is 1641 which aligns with yesterday’s value area low. Sustained trade below this level will quickly take us to yesterday’s low (and open) at 1634. If the lows don’t hold, the sellers will likely target 1627.25 then the sold foundations from 1622.75 – 1620.25 – 1618.25 – 1617. This cluster of support is vital to the long case in the short/intermediate term. Below there, price gets slippery down to a 1614 LVN then 1610.25 06/13 VPOC.
I’ve noted the above levels in the following chart:
Tue Jun 18, 2013 9:49pm ESTComments Off on The Most Curious Footprint Encountered Yet
The weather in Michigan has reached the short stretch where it becomes sublime and you’re flooded with memories of what make the murder mitten a great place. I watered my new cement, one of the joys of home ownership. Imagine that, desert troglodytes. I’m surrounded by fresh water, splash.
Cement is a great foundation for building upon. For weeks after you pour it, the cement continues to cure underneath the hard surface. Cooling it off with water promotes a more solid cure and whiter concrete.
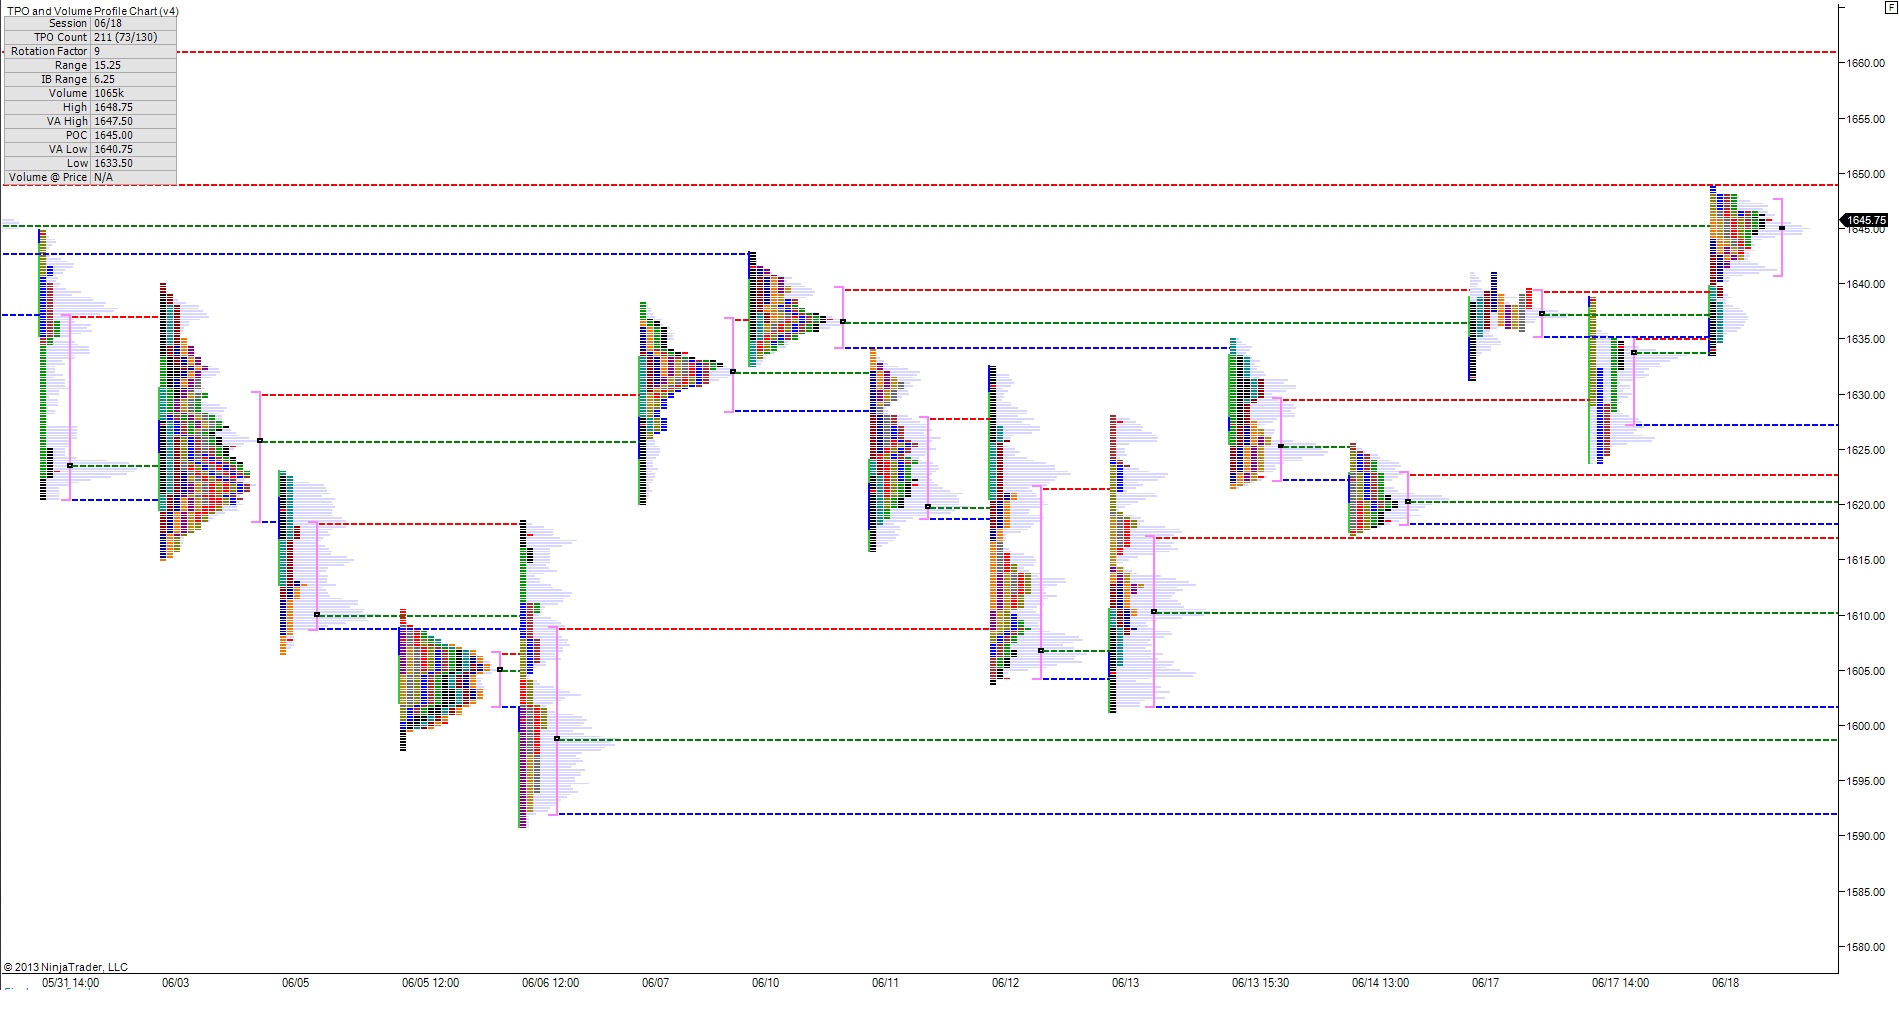
I could go on about fresh concrete for hours, I love infrastructure. But instead turn your attention to these profiles building up in the S&P. My game was thrown off over the weekend, and important work was neglected. The profiles needed to be chopped and screwed going back to late-May to give us an idea of what’s going on above and where we may expect to encounter resistance. There’s lots of really interesting stuff going on, but I want you to pay particularly close attention to the following features of the profile chart:
Look at the profile NAILING the RTH high today
Look at the layers of support properly formed and lain below, like good concrete
Look at the OPEN AIR from 1649 to 1661
You better click this one and keep it open on a new tab
The red dotted line at today’s high represents the value area high from the calm morning of 5/30, just before all hell broke loose and a one direction (no homo) move to our recent swing lows occurred. The green dotted line is the 05/30 VPOC. Curious, yes? That we’ve set value in near perfect alignment with this singular event?
Buy orders brought us back here this morning, that’s what today’s P-shape profile suggests. They came to market early to initiate new longs, or perhaps it was short covering. Either way the buy pressure abated and/or was met with enough selling pressure to end upside progress for the remainder of the session. But, not enough to press lower. You still with me? Because none of this matters too much. All that really matters is The Fed.
But we’re here, at a critical juncture, the market will tip its hand, but a tip higher has to simply levitate, as where a missile lower has to carry grade USA bunker-busting power. Place your bets…
Tue Jun 18, 2013 7:52am ESTComments Off on Drilling into Monday’s Dynamic Action
The overnight session firmed up around midnight and took the S&P globex session five handles higher to reach a high of 1639.50 before finding sellers willing to knock us back down.
I’ve zoomed in my profile chart in to only display Friday and Monday action as the two days were dynamic enough to provide me several reference levels. Remember that I split the profile when a notable change occurs in the market, allowing me to better see the individual auctions.
All it took was a Fed rumor to send the index barreling lower and I think that speaks volumes to the conditions in these markets. Longs from last week have lovely gains, and they’re worried terrified they may lose them. We’re in choppy, macro waters.
However, large vertical price discovery presents great opportunity, so we should welcome these conditions.
I’ve highlighted the levels I’ll be keying off of today in the following profile chart:
Mon Jun 17, 2013 8:17am ESTComments Off on Morning $ES_F Analysis – Building on Strength
Life has a way of slowing you down, much like a solid piece of market resistance. We gauge the health of an index, commodity, or stock often not by how it handles resistance the first time around, but rather upon subsequent tests. The pullback is where a stock can build strength and momentum to blast through an obstacle. Curious enough, the same goes for support.
Let’s say you missed Friday’s session, like me. You may feel very out of sorts. If you build an understanding of the market profile, you’ll find it quickly telling the story of Friday and getting you back up to speed.
First off, the “free exposure” given from the rally held true, but only for an hour of Friday’s session, after which the market gave back over half the move. On the surface, this is bad news for the bulls. But if you’re in the mindset that we’re in a corrective phase of the market, this action is expected and normal.
Given these conditions, we need to be nimble, rank our positions, be ready to cut old favorites loose and perhaps initiate new positions in better served areas of the markets. I’ll be back later this morning with thoughts on this.
If we lose Friday’s low, things get slippery fast as we traverse Thursday’s dynamic trend. Up above, we mostly can key off last Monday’s tight auction, and the relevant levels produced from its auction.
To my eyes, the major hand tip comes from accepting price either over 1639.50 value area high 06/10 or Thursday’s low at 1601.
There were two major distributions occurring Friday. I’ve split them accordingly in the below chart, and they give us clear guideposts as we progress today. We were very strong overnight. This can be interpreted as bullish, but more so I see it as an opportunity for bulls to give it up. We need to be on guard for that, and armed with these levels of support we can measure the progress made by sellers:
Thu Jun 13, 2013 9:35pm ESTComments Off on Evening Market Profile and Trade Recap
The longest vertical moves happen most often when the market starts outside of value and trades entirely though it.
When I split Wednesday’s profile, the value area I needed to look at became clear, ranging from 1611 – 1619 give or take a tick. I was out of my first longs before 1618, but when the market pulled back and set its eyes on challenging 1619 for a second time, I got long again. It was a lovely trade. I had 1.5 points of room between my entry and the well defined resistance so I scaled off profit, placed my stop at a level that would take the sellers lots of effort to disqualify the trade, and went about my business of talking smack on twitter and whatnot.
Needless to say, the dynamic move through that resistance didn’t look back and earned five handles before running into my next logical price level. This is really exciting stuff.
When a trend day occurs, you see very little overlap in the TPOs, and that’s exactly what we saw today. Getting long anywhere during a trend day is hypothetically risk free exposure heading into the following session since we should at the least digest the upper end of the range.
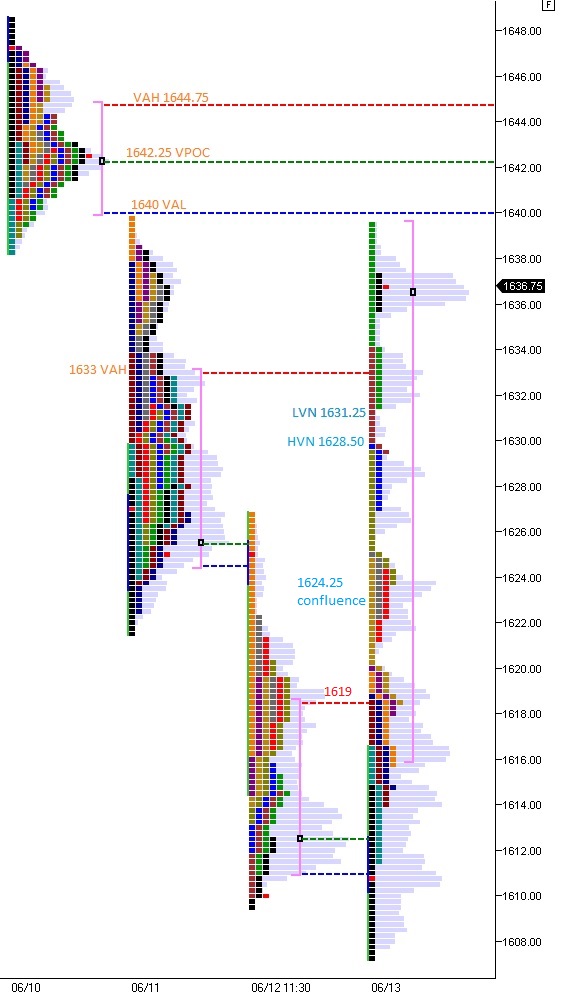
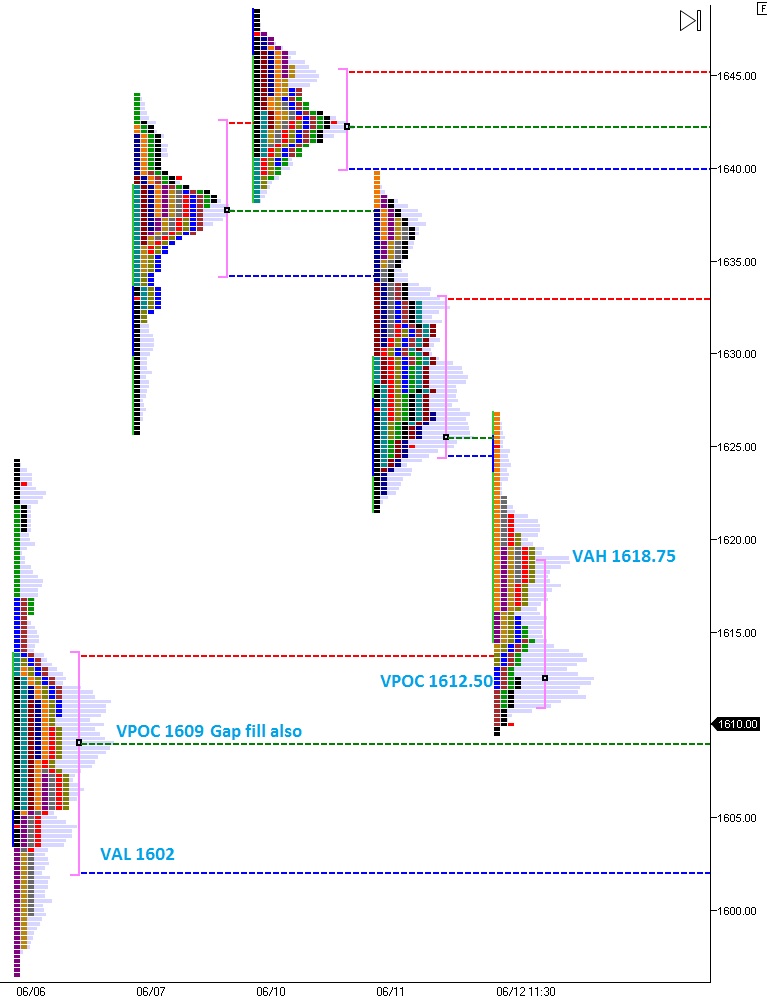
Using the 6/10 profile you can see the levels where we can expect upside resistance. Should none of them hold, just set your sights on 1650 and hold’on to your pants.
I’ll be watching the following levels in the morning. However, I’ll be working remote, so I’m uploading the chart tonight:
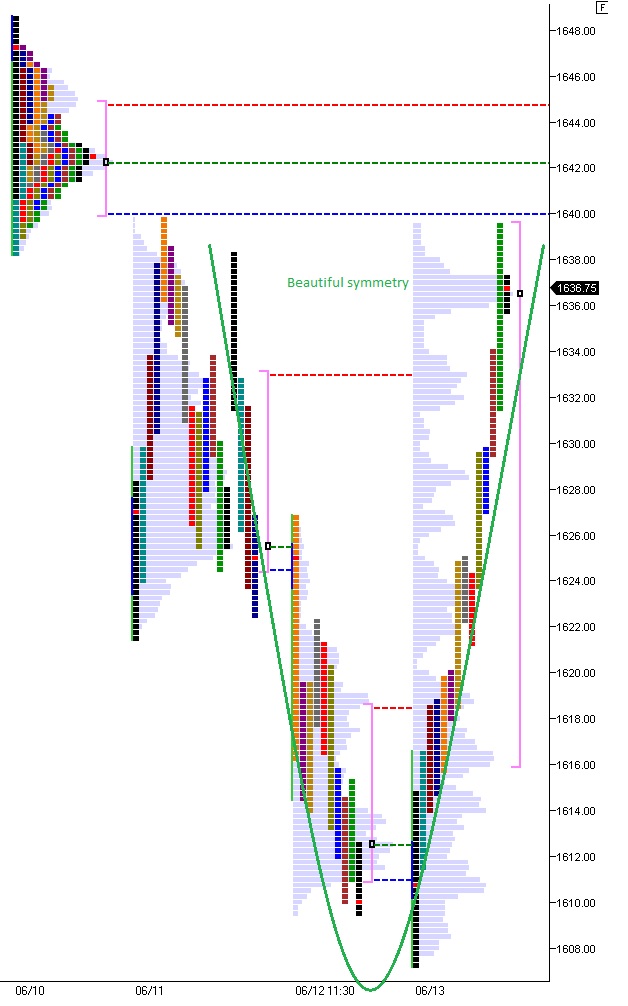
NOTE: I’ll be rolling into and quoting the September contract after this weekend. ALSO NOTE: like a beautiful woman, the sell off and subsequent bounce had near-perfect symmetry, lovely:
I’m feeling a little in the zone today so you must pardon my absence. I’ve been crushing this S&P tape since 11pm last night. Shorting, longing, more longing, and now I’m finally flat and in awe.
I made good monies today.
As I turn a more focused eye to these stocks the first thing striking me as odd is the lack of tenacious demand for solars. It’s like the god damned secondary over at FSLR put a wet blanket on the whole industry. Everyone’s still tending to their sunburns with coconut and aloe. But I must let you know, Raul never burns, I only get darker. And when I get really dark, things get weird. By that I mean YGE needs to get moving NOW!
HMIN will cut dicks once it finally crushes this stupid 30 level.
DDD is still blowing minds around the world, building shit out of polymers and what have you. Believe it or not, this company is still special even if Japan unwinds their monetary policy.
China isn’t getting awesome yet. They will be. Never sleep on the Chinese.
TPX is behaving excellent. I think you have to keep the weekly chart in mind if we see follow through tomorrow. That would carry some major implications. Watch me crush this trade.
YY is going red to green but will always have a red soul and desire to kill shorts.
IMMR yes they have the haptics.
I bought more ODP because something about office supply stores gets me excited.
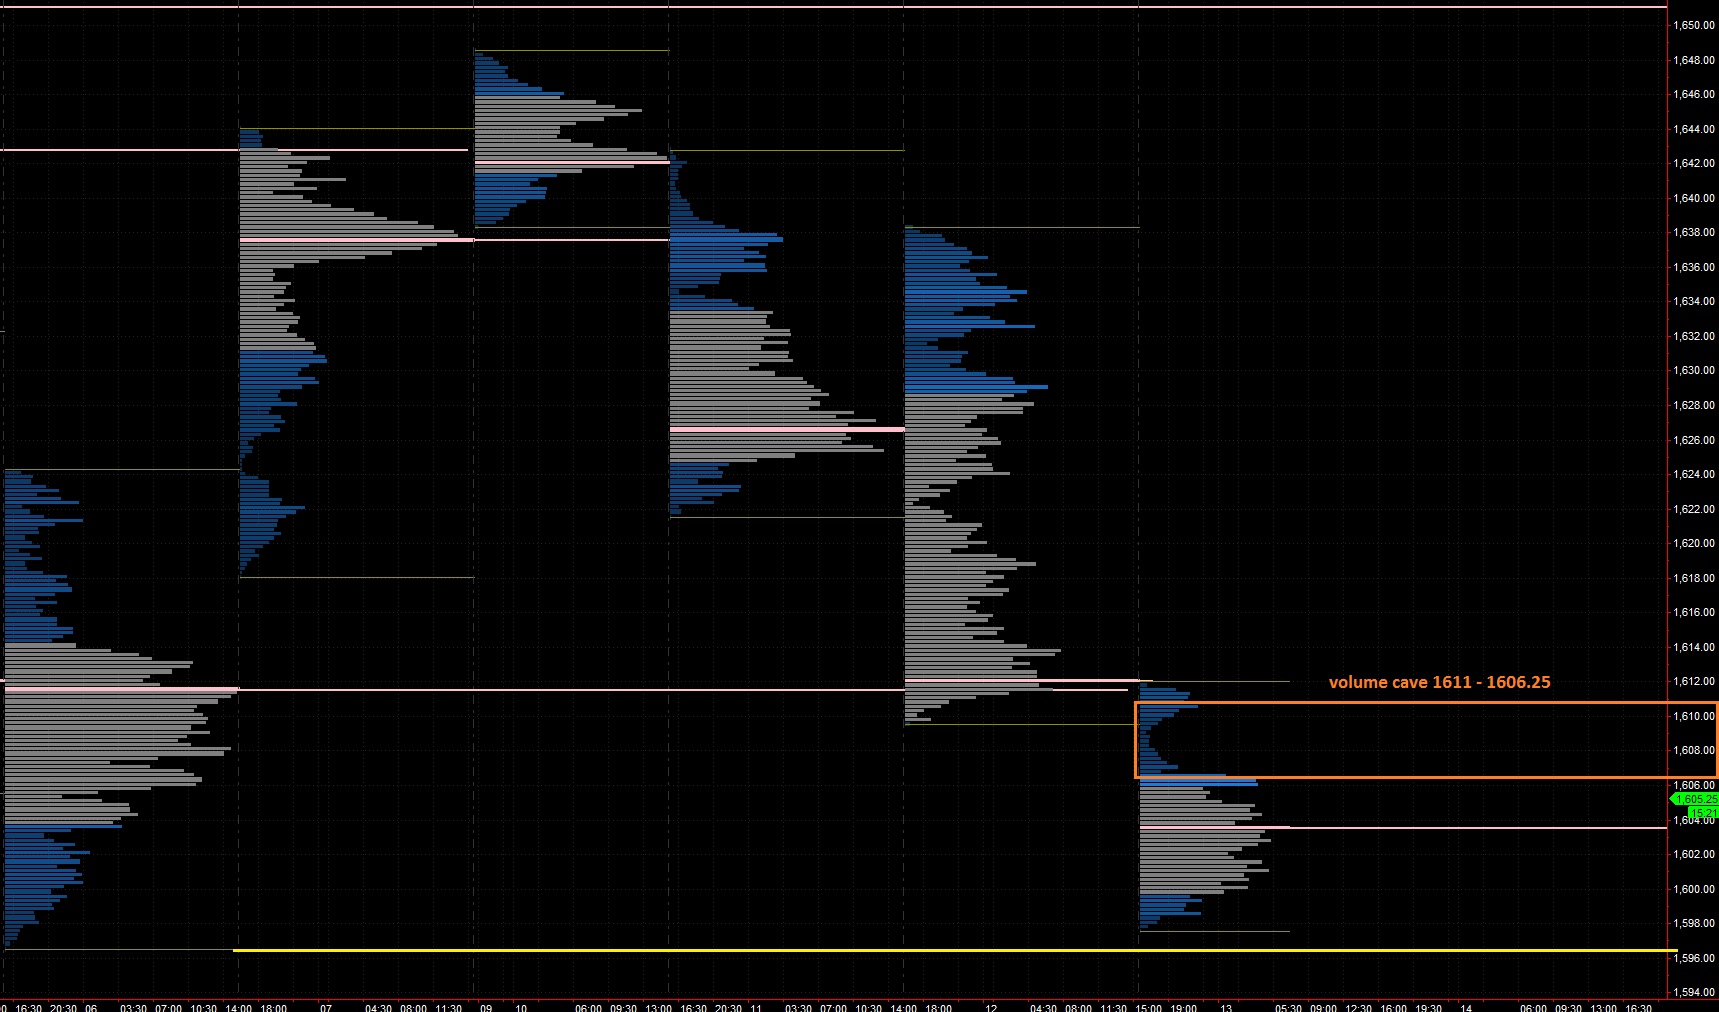
Thu Jun 13, 2013 8:05am ESTComments Off on All The Levels You Need To Navigate Today’s Tape
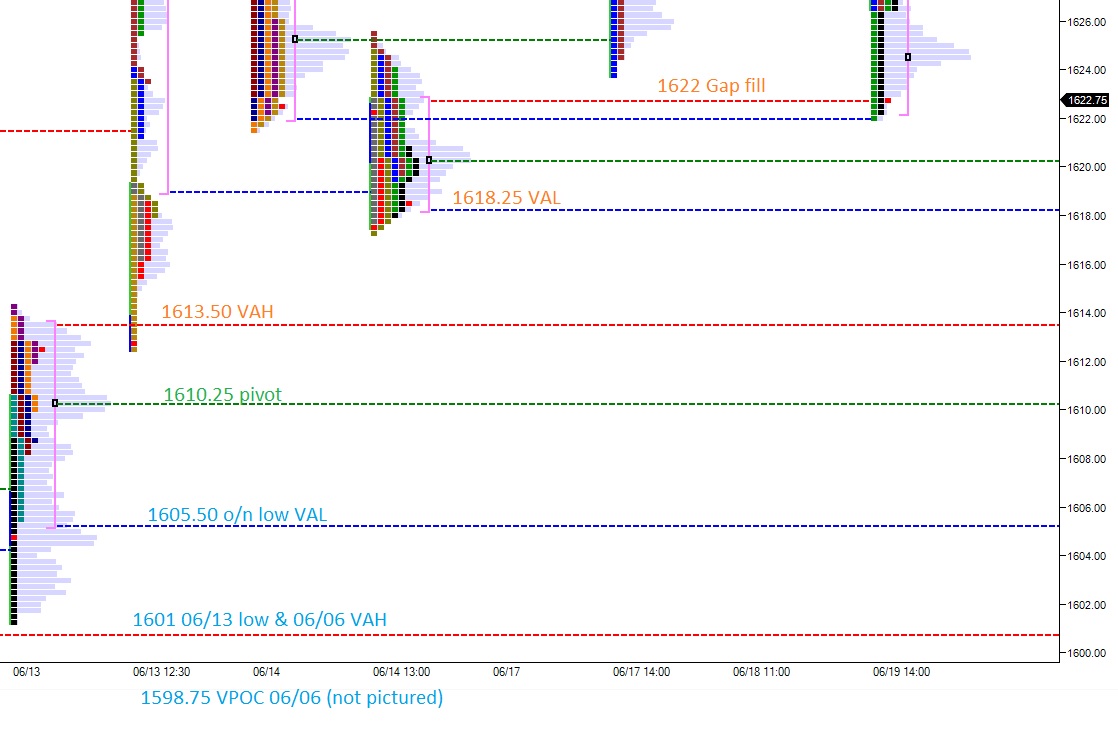
The market headed south early on last night and made around 10 handles of progress to the downside before enticing buyers back into the S&P. The dynamic action left behind a volume pocket which will be of interest as we approach the opening bell. I’ve highlighted it below:
In terms of the market profile footprints, we’re seeing these large, D-shaped profiles, which signal no real directional conviction. The bearish bias from yesterday comes from the fact that we closed out near the low of the session. The follow through overnight adds credence to their cause. The resistance overhead is pretty clear cut in the following picture:
We still have a big gap below to watch also, good luck trading today, people: