18 years in Wall Street, left after finding out it was all horseshit. Founder/ Master and Commander: iBankCoin, finance news and commentary from the future.
This one is especially disdainful, as it target babies.
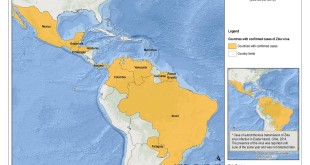
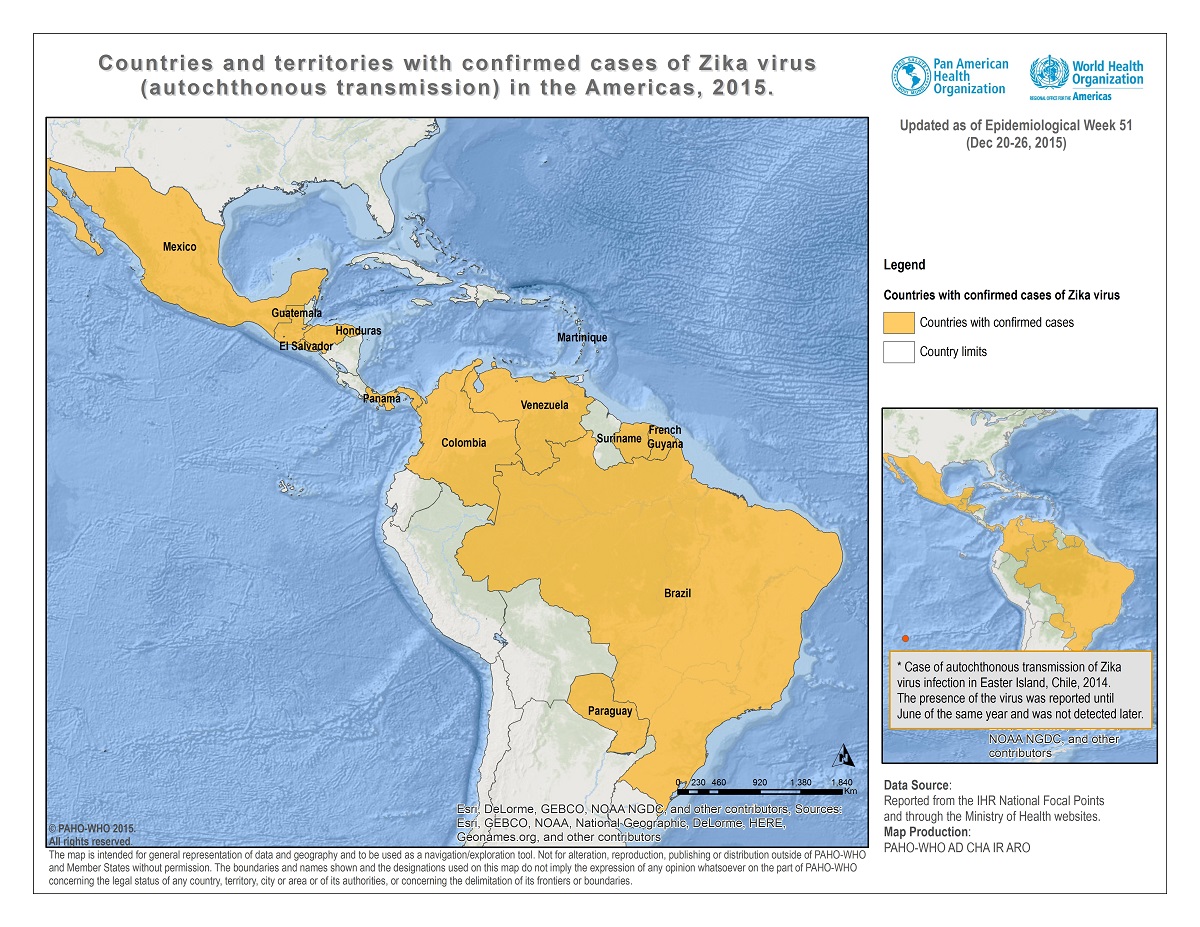
Out of the Amazon jungle, an insidious baby killing virus has been unleashed, infecting thousands of infants in Brazil. World Health Organization officials say it will soon spread across the Americas, into the United States–just in time for summer.
“We’ve got no drugs and we’ve got no vaccines. It’s a case of deja vu because that’s exactly what we were saying with Ebola,” said Trudie Lang, a professor of global health at the University of Oxford. “It’s really important to develop a vaccine as quickly as possible.”
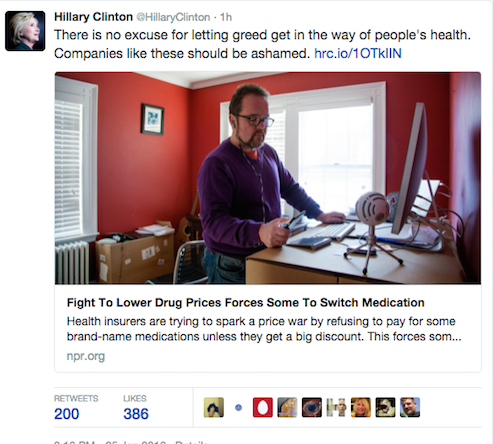
Large drugmakers’ investment in tropical disease vaccines with uncertain commercial prospects has so far been patchy, prompting health experts to call for a new system of incentives following the Ebola experience.
“We need to have some kind of a plan that makes (companies) feel there is a sustainable solution and not just a one-shot deal over and over again,” Francis Collins, director of the U.S. National Institutes of Health, said last week.
The Sao Paulo-based Butantan Institute is currently leading the research charge on Zika and said last week it planned to develop a vaccine “in record time”, although its director warned this was still likely to take three to five years.
British drugmaker GlaxoSmithKline said on Monday it was studying the feasibility of using its vaccine technology on Zika, while France’s Sanofi said it was reviewing possibilities.
No drugs, cures, treatments–nothing. Just brain damage for babies. Fucking great.
Muddy Waters, the preeminent source of bearish online reports, especially gravitating towards men in the orient playing parlour tricks with their accounting standards, launched a hedge fund today.
Reuters is reporting it was seeded with a $100 million investment.
Truth be told, and as much as I hate to admit it, his research is pretty darn good.
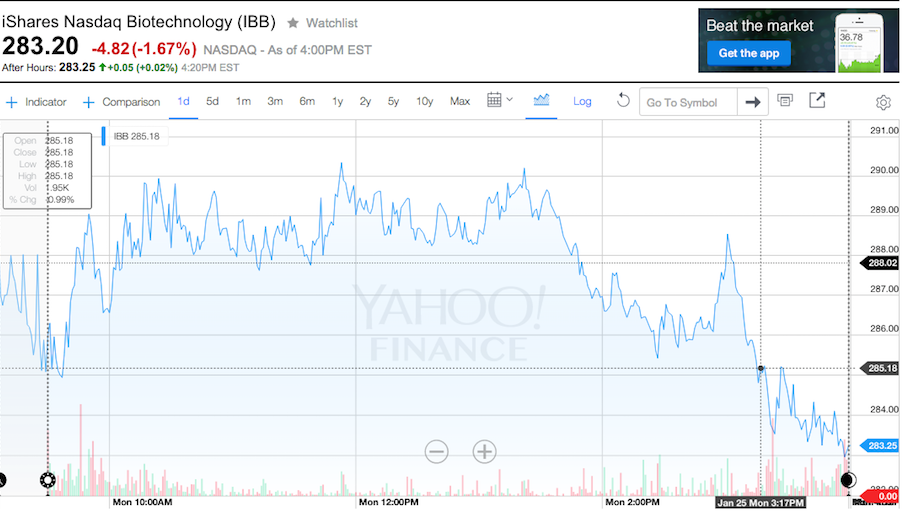
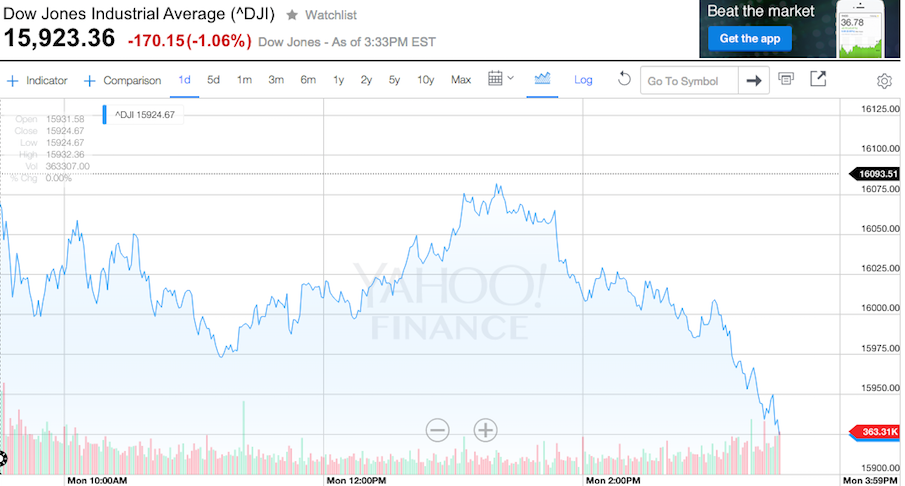
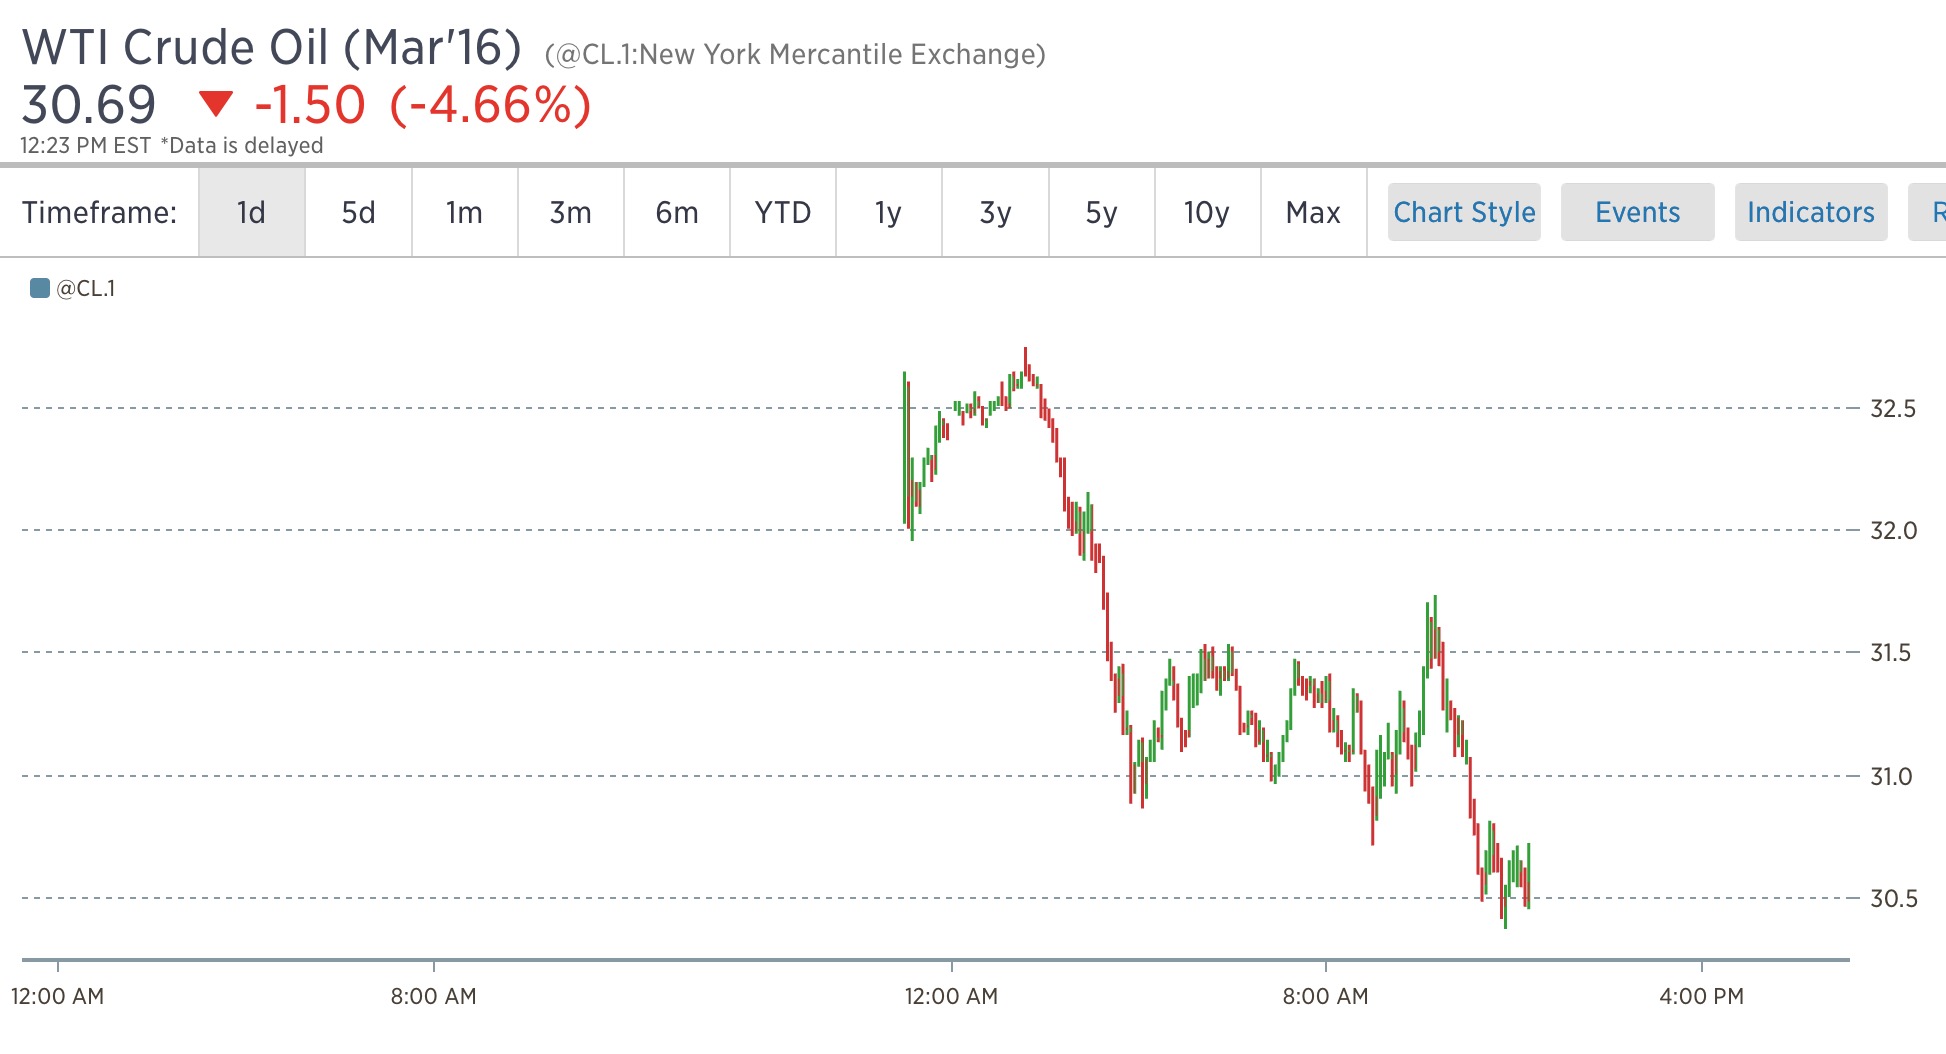
Eighty percent of stocks are lower today, as investors sashay (no homo) in an out between consciousness and unconscious nightmares of a Janet Yellen Fed. Losses are most bountiful, as the bears like to say, in the oil and gas space–after today’s spectacle of a 6% decline.
But all principle sectors are lower, with a few outlier industries like gold and soda pop stocks, both of which are still lower for the year.
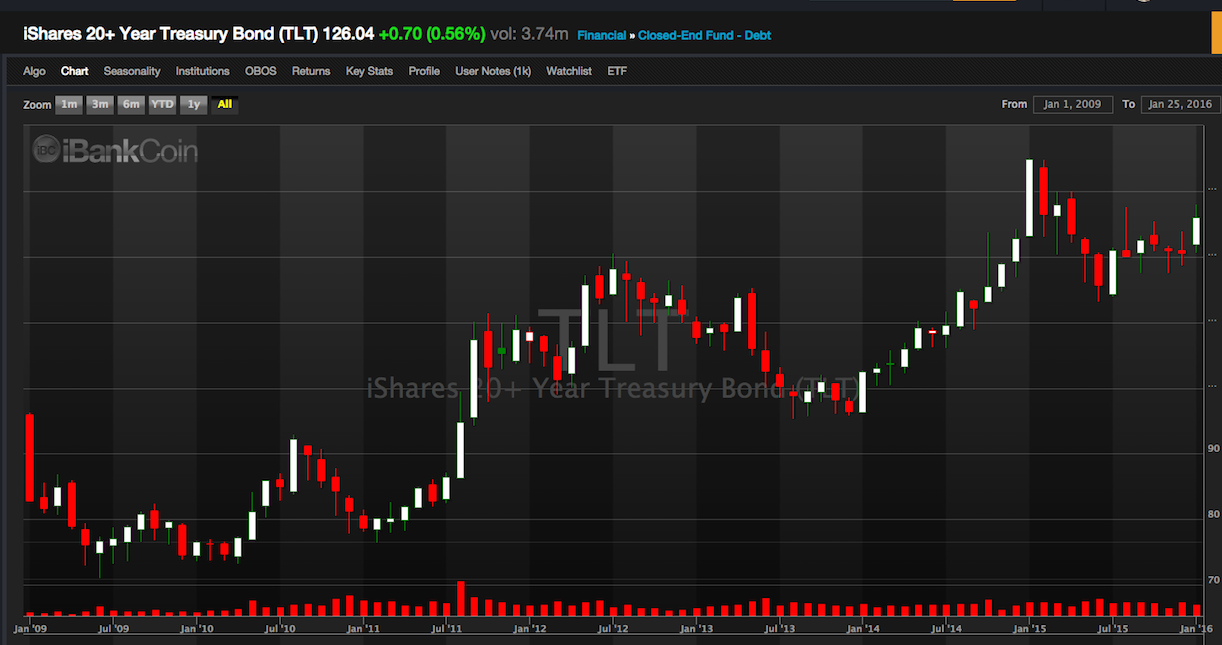
When the end comes and centaurs kick open the doors of the NYSE, in an effort to “play” with the traders who are domiciled there, only one asset class will be left standing.
That’s right, good olde fashioned U.S. treasury bonds–long term duration.
Why?
Flight to quality.
When the market imploded in January-February of 2008, losing 16%, TLT was flat, not including the two month’s of dividends you would’ve received if long. At the end of the day, the dutch settlers who founded NYC, ripping it away from the savage clutches of the wampum loving natives, had a business mind about them. The West India company was intent on creating this country to serve as a factory of sorts for profit. After the British were gifted New Amsterdam back to them in 1674, they cultivated a society of industrious men and women, wholly intent on conquering the world.
After we rebelled from the white wig wearing catamite Brits and seized our freedom, through secret society means and dark magic spells, America was a force to be reckoned with; a great nation had been born. As time went on, our power grew, surpassing all of the former world powers–making them to look like pathetic jackass fools. Our military prowess became second to none and our debt became the envy of the world. The Chinese, Indians and the Japanese sopped it up, thanks to its liquidity and safety.
In 1944, an agreement was made in Bretton Woods, NH, attended by 44 countries under our command, to form a new economic realty, one that founded the IMF and World Bank–which was to be supported by the U.S. dollar. Our currency reserve status was born. It was born in the fires of WW2, a time which we proved, without a shadow of the doubt, that all other nations bend the knee to our eagle standard, else undergo a bombardment of their cities.
That is why today TLT is moving higher, as the markets get their faces punched off.
THE HISTORY LESSON IS NOW OVER.
As scheduled inside of Exodus, I sold out of another tranche of SPY this morning, at the open, effectively removing myself from leverage. I am now 75% long SPY, 25% long TLT. I intend to sell another 2/3rds of my position in SPY over the next two days.
Everyone likes a good small capped stock. One that goes from $10 to $50 without a reason or a care in the world. However, over the past year, according to Exodus, the median return for 3,391 stocks with market caps under $5 billion, was an appalling -21%. If you drill down deeper, upping the degeneracy by lowering the market cap threshold to just $1 billion, losses for over 2,200 stocks exceeded 29% for the past 12 months.
According to Barclays, “the fun”, as some prominent bears call it, might just be getting started.
The majority of bear market declines, for small caps, went lower by 30%, meaning we might be due for another leg lower.
Conversely, larger cap stocks tend to do much better during market squalls. Stocks with market caps over $5 billion were down 8.8% over the past year, encompassing 887 stocks.
Year to date, large cap stocks are down 7.8%, while small capped are down 11.5%, narrowing the 1 yr performance spread from 13% to just 3.7%–indicative of the broad based sell off we’ve all been enjoying in these first few “fun” weeks of 2016.
A few years ago, a BofA/Merrill analyst posited how the 2014 drop in crude could have similar characteristics to the subprime bust in 2008. Today he updated his thoughts on the aftermath of this bedraggled mess.
The pattern of the decline in the price of oil that began in mid-2014 is remarkably similar to the 2007-2009 pattern of the price decline of ABX, the credit derivative index that referenced subprime mortgages and, ultimately, the U.S. housing market (Chart 1). The ABX history suggests that oil will see more declines in the next couple of months and find a floor somewhere in the low 20s in the March-April time frame. Both the duration of the decline (1.5+ years) and the scale of the decline (100 neighborhood starting price down to the sub-30 neighborhood) are similar. Given that both housing and oil prices were fueled to spectacular heights in the two periods by massive credit expansion, it’s probably more than just coincidence that the respective “bubble” bursting patterns are so similar.
Consider how things tend to work. Denial on what constitutes fair value is a big component of bubbles, on the part of both market participants and policymakers. When perceived “bubbles” burst, markets take their time in steadily shredding views of the perception of fundamental value, as prices move lower and lower. Along the way, many will cite “technical factors” as the cause of the decline, which in some way suggests the price decline may not be real when in fact it is all too real. In the end, the technicals drive the fundamentals, as credit flees and borrowers go bust, and a feedback loop lower kicks in. Lower prices beget accelerated selling, as asset owners need to raise cash. It could be margin calls or it could be producer selling needs, it doesn’t really matter: the selling becomes inevitable and turns into forced selling.
“The systemic margin call of 2008 seems to be back for now, albeit to a far lesser degree.”
It’s worth noting that the hounds of hades are eating away at crude today, now lower by almost 5%.
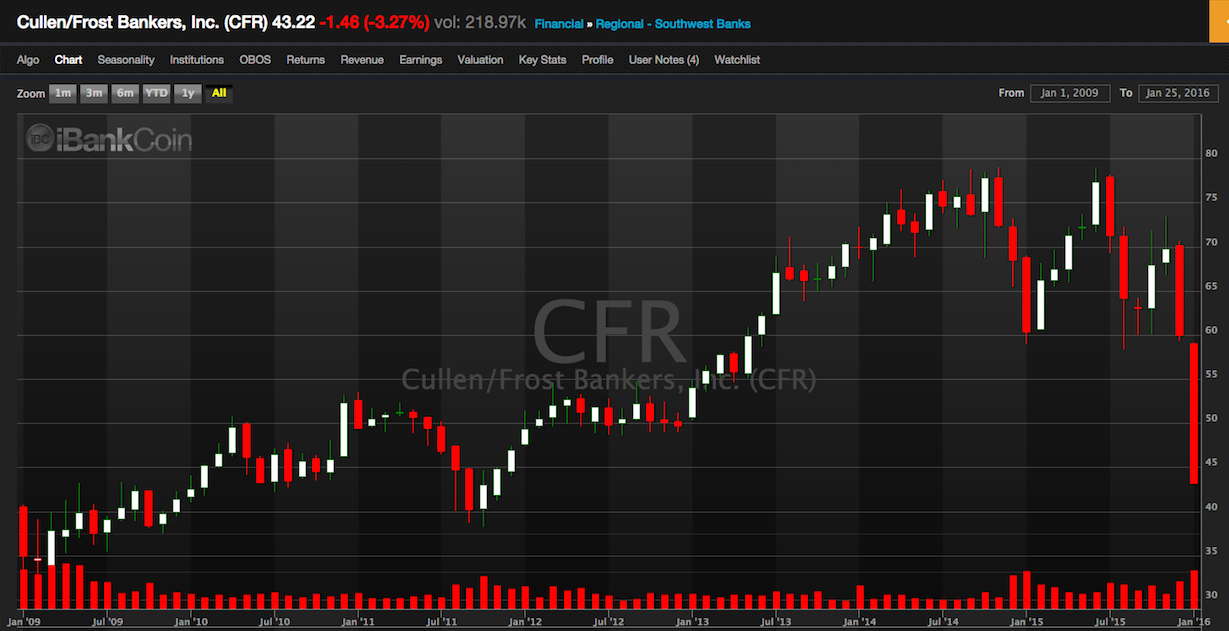
Regional southwest banks were the darling of regional bank stocks for the past 5 years, until now. As the entire state of Texas descends into a Saudi induced hell, so are its banks.
For the year, the regional southwest bank sector is down 14.2%, with gargantuan losses in TCBI (-34%), CFR (-27%), PB (-27%), BOKF (-23%) and IBOC (-15%).
Both TCBI and CFR are paying big dividends, with yields edging towards 5%. Back in 2013, TCBI was trading at 2.2 book value, now just 1.05.
CFR, which is the poster child in all of this, is now trading under book value (0.98)–something not even seen during the financial crisis of 2008.
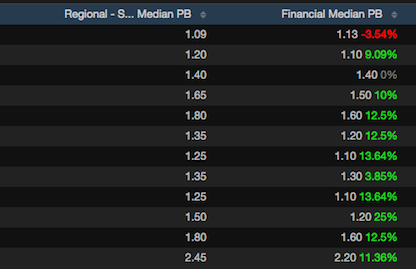
As a group, the sector is trading 1.09x book, a discount to the financial sector. Since 2005, southwest banks have consistently traded at a steep premium to the rest of the sector.
Does this look normal to you?
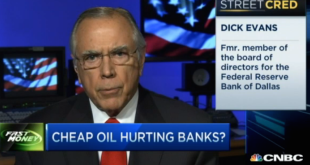
But don’t worry, CEO of CFR, Dick Evans, former Fed head at the Dallas Fed, says “The economy in the state of Texas is strong.” And, they can handle $37 crude.
Let’s see how Dick’s stress tests work out with $25 crude.
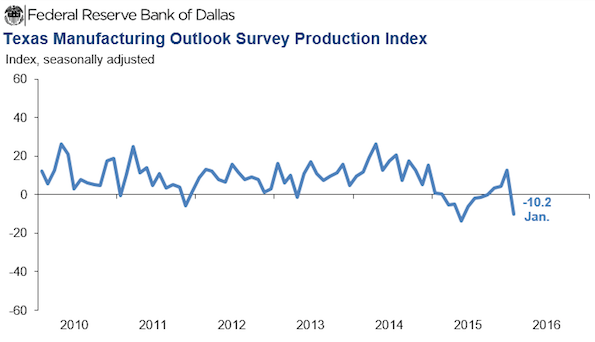
UPDATE: The Dallas Fed just came out with some really bad economic stats for the state of Texas. The worst general business activity since 2009.
Texas factory activity fell sharply in January, according to business executives responding to the Texas Manufacturing Outlook Survey. The production index—a key measure of state manufacturing conditions—dropped 23 points, from 12.7 to -10.2, suggesting output declined this month after growing throughout fourth quarter 2015.
Other indexes of current manufacturing activity also indicated contraction in January. The survey’s demand measures—the new orders index and the growth rate of orders index—led the falloff in production with negative readings last month, and these indexes pushed further negative in January. The new orders index edged down to -9.2, and the growth rate of orders index fell to -17.5, its lowest level in a year. The capacity utilization index fell 15 points from 8.1 to -7, and the shipments index also posted a double-digit decline into negative territory, coming in at -11.
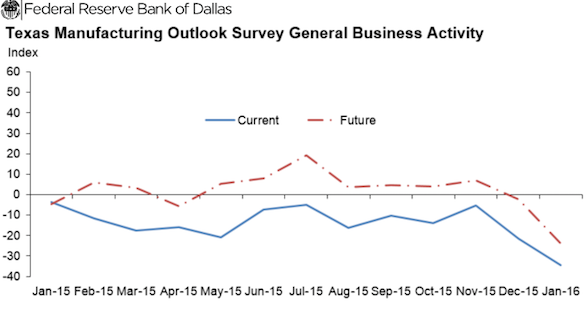
Perceptions of broader business conditions weakened markedly in January. The general business activity and company outlook indexes fell to their lowest readings since April 2009, when Texas was in recession. The general business activity index fell 13 points to -34.6, and the company outlook index slipped to -19.5.
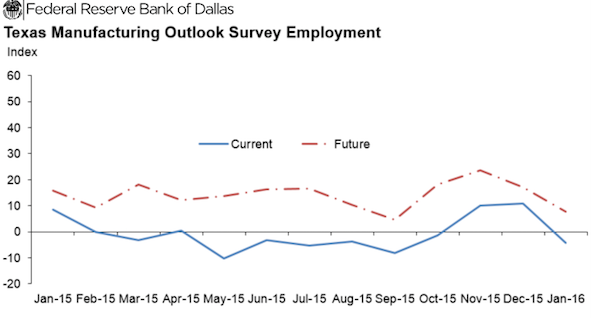
Labor market indicators reflected a decline in January after exhibiting strength in November and December 2015. The employment index dropped from 10.9 to -4.2, with 17 percent of firms noting net hiring and 21 percent noting net layoffs. The hours worked index plummeted 23 points to -9.2, suggesting a sharp pullback in employee hours.
The survey’s price measures remained negative in January, but wages continued to rise. The raw materials prices index has been negative for seven months and held fairly steady at -8.6. The finished goods prices index has been below zero for more than a year and moved up from -15.5 to -9.6 this month. Meanwhile, the wages and benefits index stayed strongly positive but dipped from 20.2 to 16.5, suggesting a smaller rise in compensation.
Expectations regarding future business conditions weakened notably in January. The index of future general business activity fell 22 points to -24, and the index of future company outlook fell to -1.3, its first negative reading in nearly seven years. Indexes for future manufacturing activity generally declined but remained solidly positive.
The Dallas Fed conducts the Texas Manufacturing Outlook Survey monthly to obtain a timely assessment of the state’s factory activity. Data were collected Jan. 12–20, and 118 Texas manufacturers responded to the survey. Firms are asked whether output, employment, orders, prices and other indicators increased, decreased or remained unchanged over the previous month.
The NASDAQ hasn’t drawn down to this degree since January of 2008. We’re lower by almost 10% for the month. We traded down 11.8% in January of 2008, only to dive lower by another 4.8% in February. Back then the housing bubble popped and we were starting to realize the fundamentals were going to get real bad. We actually bounced hard in March, April and May–before bleeding out again in June–when the fundamentals started to mean something again.
Today, we are enduring the popping of another bubble: the great Chinese economic hoax, which has an ancillary victim in commodity price destruction. Let’s be clear, commodities are lower because Chinese demand is down. That being said, the economic ramifications of this bubble being popped probably won’t reveal itself until the second half of the year–around June, if I might be sold bold.
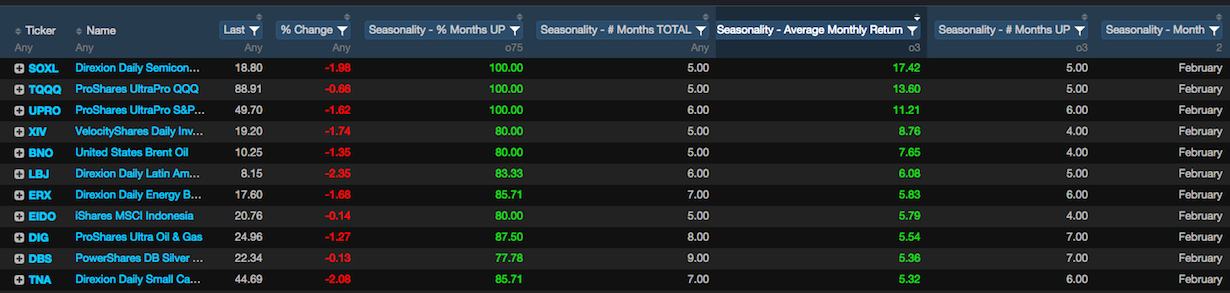
All things considered, February is supposed to be a good month for stocks. Seasonality trends favor many upside ETFs, as well as Bill Ackman’s fav VRX.
But we can’t ignore the parallels to 2008, can we? Actually, we probably can, at least from February through late May. I do expect the market will go higher soon (this week) and I’ve been anticipating further downside in February. But this oil and gas story hasn’t played out yet. Like MBS in the early 2000’s, oil and gas loans have been all the rage since 2009. There will be dislocations, which is why 25% of my assets are being held in TLT and that will not budge for the entirety of 2016.
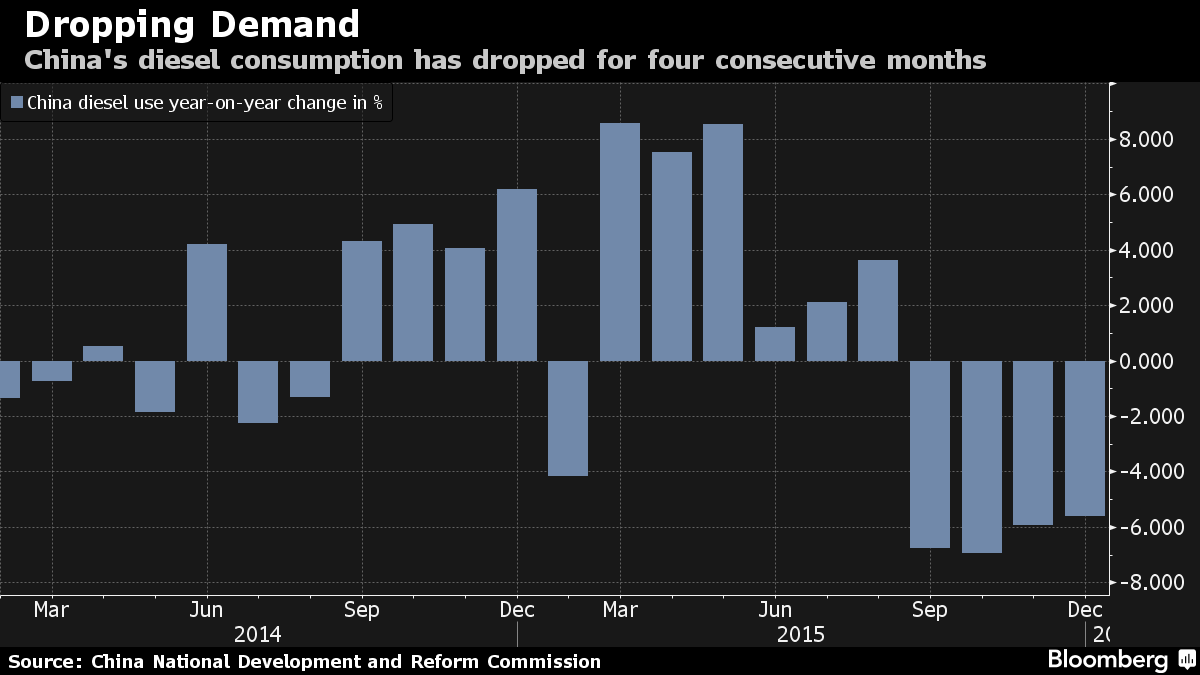
As the Chinese switch from bicycle to automobile, gasoline consumption is certain to rise. The IEA forecasts Chinese gasoline demand to rise 200k barrels per day in 2016. But that’s neither here or there; because today the Chinese said all hell was breaking loose and their demand for diesel fuel, which is a key tell for their industrial capacity, was waning for the fourth month in a row.
Naturally, some people think the Fed can help out the price of oil.
“The Fed will pave the way for the oil market,” Danske Bank’s Pedersen said. “If it strikes a more concerned tone that will help establish a bottom for oil prices. If it continues to signal several rate hikes this year the slide will continue and we could very well reach new lows.”
The House of Saud certainly have no interest in helping out your WTI quotes–which are lower by more than 3% this morning.
OPEC Secretary-General Abdalla El-Badri reiterated he wants oil producers outside the group to assist in reducing the global oversupply. He said at a conference in London on Monday that there are signs supply and demand will start to come back into balance this year, citing a forecast increase in global demand of about 1.3 million barrels a day, and a contraction in non-OPEC supply of about 660,000 a day.
Saudi Aramco will continue to produce oil until every company in the Bakken shale are shut down.
Meanwhile, stocks are lower this morning, merely a pittance of 16 NASDAQS. We might in fact rally today–if oil can bounce from these levels. Nevertheless, I will continue to reduce my exposure to SPY throughout the week, while holding TLT.
Dow futures are down 80, after crude reversed lower–now down by 3.2% Bakken Shales.
European indices are following the Bakken Shale guys down the sewer, despite not owning any oil themselves (#fuckery), now off by 0.4% for the session.
Separately, this is a big week for stocks–with the Fed and BOJ meetings and all. If in fact Yellen and her band of idiots find religion and indicate “one and done”, we could be off to the races. However, if they point towards stubborn hawkishness, longs will likely rue the day their parents ever met.