Our favorite hedge fund manager at iBankCoin, William Albert Ackman, just released a million word manifesto–describing in great detail how he fucked up and lost his investors 20% in 2015, not to mention the additional 15% or so he’s lost in 2016–thus far.
He talked about how the Gods cursed Pershing Square in 2015, and then went on a multi-page rant about the evils of index funds and their nefarious plans. There was a lot of Valeant jargon mixed in, with a little Mondelez. He ended it with humility, literally. No mention, however, how sex is a main driver for him and how his $91 million apartment in NYC, that he bought for fun, is doing at this stage in his conciliatory cycle.
Here is the entirety of the Pershing Sq drivel. (pardon the jagged structure of the letter. It was a quick copy and paste job. I didn’t have the time, nor interest, to dress it up pretty.)
January 26, 2016
Dear Shareholder:
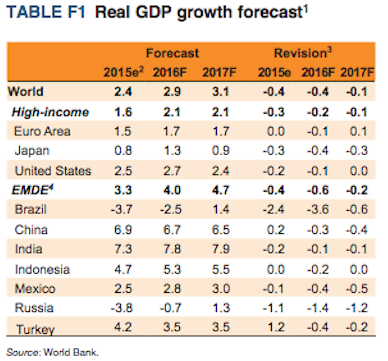
2015 is a year we will not forget. There was no financial crisis except perhaps in the energy,
commodity, and currency markets. There were no major new wars except for the rise of ISIS and growing global terrorism. The global economy has shown signs of weakness, most notably in China, but U.S. core growth appears sound. The substantial majority of our portfolio
companies made continued business progress despite currency headwinds and a weakening
global economic environment. Yet, the Pershing Square funds suffered their greatest peak-totrough
decline and worst annual performance ever. What happened?
Mistakes and Lessons Learned in 2015
The first place to look for an explanation is mistakes we made in 2015, and we did make some
important mistakes. Principally, we missed the opportunity to trim or sell outright certain
positions that approached our estimate of intrinsic value. Our biggest valuation error was
assigning too much value to the so-called “platform value” in certain of our holdings. We
believe that “platform value” is real, but, as we have been painfully reminded, it is a much more
ephemeral form of value than pharmaceutical products, operating businesses, real estate, or other
assets as it depends on access to low-cost capital, uniquely talented members of management,
and the pricing environment for transactions.
When we purchased Valeant at an average price of $196, we bought the company at a modest
discount to intrinsic value as represented by the company’s existing portfolio of products and
businesses, but at a very substantial discount to fair value in light of its acquisition track record,
We recognize that this is a bit like a property casualty company saying, “Except for Hurricane Sandy this quarter, losses in our portfolio were
minimal.”
the large number of potential targets, and its competitive advantages which include its low-cost
operating model and favorable tax structure. When the stock price rose this summer to the mid-
$200s per share, we did not sell as we believed it was probable the company would likely
complete additional transactions that would meaningfully increase intrinsic value. In retrospect,
this was a very costly mistake.
Our failure to sell stock wasn’t entirely an unforced error as we found ourselves largely restricted
from trading during this period. During the summer, we were made aware of a large potential
transaction that Valeant was working on, and as a result, we were restricted from trading at a
time when it would have been prudent to take some money off the table. In retrospect, in light of
Valeant’s leverage and the regulatory and political sensitivity of its underlying business, we
should have avoided becoming restricted to preserve trading flexibility, or alternatively, we
should have made a smaller initial investment in the company.
We made a similar error in not trimming our Canadian Pacific position when it reached ~C$240
per share. While we still believed CP was trading at a discount to intrinsic value at that price and
there was the potential for CP to complete an industry-transforming, value-creating merger, in
light of the size of the position as a percentage of the portfolio, and concerns we had about the
Chinese economy, it would have been prudent to sell a portion of our investment.
Our most glaring, albeit small, unforced error was buying additional stock in Platform Specialty
Products at $25 per share to assist the company in financing an acquisition. We paid too much
as we assumed the new transaction would create substantial value, and because we assigned too
much platform value to the company. Our assessment was incorrect as execution difficulties,
operating issues, currency effects, and financing issues have destroyed rather than created value.
While not quite a lesson learned, as this has been a principle we have always believed, 2015 was
also an important reminder that stocks can trade at any price in the short term. This is an
important reminder as to why we generally do not use margin leverage in our investment
strategy. We expect that there have been many margin loan liquidations in recent weeks which
have contributed to dramatic stock price declines.
We do not believe that our investment performance in 2015 was primarily due to unforced errors,
but rather due mostly to the market’s reappraisal of our holdings without a corresponding
material diminution in their intrinsic value. While stocks can trade at any price in the short term,
it is rare for companies to trade at material discounts to intrinsic value for extended periods.
Fortunately, the lessons we have learned in 2015 should be easy to avoid in the future.
What Other Factors Contributed to Our Negative Performance in 2015?
The inception of the portfolio’s decline began with Valeant in August. We have discussed at
length the events at Valeant which catalyzed the stock’s initial decline: political attention on
drug pricing and the industry, regulatory scrutiny, attacks by short sellers, and the termination of
a distribution arrangement representing ~7% of Valeant’s sales. But, we would never have
expected that the cumulative effect of these events would have caused a nearly 70% decline in
the stock, nor do we believe that they will permanently impair Valeant’s intrinsic value.
Contemporaneous with the decline of Valeant, the rest of our portfolio went into free fall which
has continued up until the present. While our portfolio is highly concentrated, we are highly
diversified in the industries in which we invest: sweet snacks and chewing gum, industrial gases,
real estate, specialty pharmaceuticals, specialty chemicals, frozen foods, animal health, housing
finance, railroading, and quick service restaurants. One would not expect a substantially greater
than market value decline in our portfolio due to recent company-specific and macro events as
has occurred since August as shown in the table below:
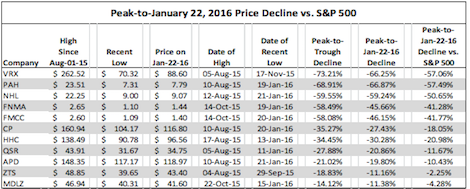
Peak-to-January 22, 2016 Price Decline vs. S&P 500
You will note that the best performers in the long portfolio since August were Mondelez, Zoetis,
and Air Products. These three companies are the only ones in the current portfolio which are in
the S&P 500. Despite their large market caps and business quality, which would ordinarily
qualify them for inclusion in the S&P 500 index, Canadian Pacific, Valeant, and Restaurant
Brands are Canadian-domiciled and therefore not eligible. Their shares have also likely suffered
because they are components of Canadian market indexes that have experienced large capital
outflows and substantial declines due to Canada’s large energy and commodity exposures.
The companies in our portfolio that have suffered the largest peak-to-trough declines are
Valeant, Platform, Nomad, and Fannie and Freddie. The inherent relative risk of their
underlying businesses and their more leveraged capital structures partially explain their greater
declines in market value as markets moved to a “risk off” mentality. But their massive declines
in value, in our view substantially more than can be accounted for due to fundamental issues in
their respective businesses, cannot, we believe, be attributed to these factors. Importantly, none
of these companies is in any of the important market indexes. Their shareholder bases are,
therefore, largely comprised of hedge funds and other active managers, which we believe has
contributed to their underperformance.
The Pershing Square Correlation
Perhaps the largest correlation in our portfolio is one that we have not previously considered;
that is, the fact that we own large stakes in each of these companies. We have had the benefit of
a “following” of investors who track and own many of our holdings. This has given us
significantly greater clout than is reflected by our percentage ownership of these companies, and
we believe that it is partially what has caused the “pop” in market price when we announce a
new active investment. As a result, these active managers’ performance is often closely tied with
ours. When Valeant’s stock price collapsed, our performance, and that of Pershing Square
followers, were dramatically affected. Nearly all of these investment managers are subject to
daily, monthly, and quarterly redemptions, and therefore, many were likely forced to liquidate
substantial portions of their holdings which overlap with our own.
While we review the ownership structure of a company before we invest to look for large holders
who might be opposed to the type of corporate changes we intend to advocate, whether a
company is in the S&P 500 or other major stock market indexes, or whether the owners are
hedge funds or passive investors has not played a meaningful role in our analysis. We select
investments based on business quality, discount to intrinsic value, and catalysts to unlock value,
but not principally based on who else owns or will own the stock. The vulnerability of a
company to an overall market decline, a short seller attack, or negative headlines is highly
correlated with the nature of the investors who are the principal holders.
Companies like Mondelez and Zoetis whose owners are principally index funds, ETFs, and other
passive investors have much more stable and more “permanent” ownership bases, and appear,
therefore, to suffer from much less volatility. Even Air Products, which is in the S&P 500, has
suffered from the fact that it is the fifth most hedge-fund-owned stock in the index, and hedge
fund liquidations may, therefore, explain its substantial underperformance compared with its
direct competitor Praxair since year-end. As of this writing, Air Products has declined by ~9%
since year-end, while Praxair, which has the 8th lowest hedge fund ownership of companies in
the S&P 500, has only declined 4%. We believe that these exaggerated stock price movements
represent a short-term opportunity for long-term investors to accumulate additional shares at
attractive prices.
While it is impossible to know for sure, we believe that our continued negative outperformance
in the first few weeks of the year relates primarily to forced selling of our holdings by investors
whose stakes overlap with our own.
Index Funds
Index funds and other passive managers have gained increasing market share in recent years.
Investing capital in funds and ETFs that track major market indexes has recently been what one
might call a “one way bet”, and there is good reason for this. Index funds and ETFs have very
low fees and have outperformed the average active manager in recent years. Last year, index
funds were allocated nearly 20% of every dollar invested in the market. That is up from 10%
fifteen years ago. Scroll through the ownership registry of corporate America and the top three
holders are typically Vanguard, Blackrock, and State Street. As the biggest managers of index
funds, they often cumulatively own 12%, and as much as 20%, of nearly every public company.
The success of index funds and their use as benchmarks by investors in actively managed funds
lead to even more capital being “closet indexed.” This is true because the risk of an active
manager losing clients is typically directly correlated with its portfolio’s variance from the
benchmark’s performance. Clients rarely fire a manager for modest performance below the
benchmark for any one year, but client engagements and mutual fund flows are often lost if the
variance is dramatic in any one year. This encourages managers to invest their portfolios in
order to limit their variance to the S&P, with only slight over- and under-weightings to sectors or
stocks they believe will outperform. By hugging the index, their performance closely tracks the
index, with underperformance attributable to higher fees and easier to explain away as “We are
taking less risk than the index in the companies we choose to own.”
As more and more capital flows to index funds – and certain index funds such as those tracking
the S&P 500 receive disproportionate amounts of investor capital – the valuation of the indexed
constituent companies increases. While some investors consider the valuation of the index
components when allocating to specific index funds, many and perhaps most do not. We would
expect that many if not most investors picked an index fund when they signed up for their 401(k)
plans and never looked back.
Index Fund Governance
As index fund ownership grows as a percentage of shares outstanding, the voting power of index
fund managers increases. While on the one hand, one might believe this is good for America as
these “permanent” owners should think very long term compared with the many investors whose
average holding period is less than one year. On the other hand, there are significant drawbacks.
Index funds managers are not compensated for investment performance, but rather for growing
assets under management. They are principally judged on the basis of how closely they track
index performance and how low their fees are.
While index fund managers are, of course, fiduciaries for their investors, the job of overseeing
the governance of the tens of thousands of companies for which they are major shareholders is an
incredibly burdensome and almost impossible job. Imagine having to read 20,000 proxy
statements which arrive in February and March and having to vote them by May when you have
not likely read the annual report, spent little time, if any, with the management or board
members, and haven’t been schooled in the industries which comprise the index. Consider how
difficult this job would be when even the largest index funds have a hierarchy of only 20 or so
people (one per ~1,000 companies) in their governance departments which determine how
proxies for these companies should be voted.
Consider also the potential for conflicts. Index fund managers are highly incentivized to grow
assets, particularly with the high degree of fee compression that is characteristic of the index and
ETF worlds, and the fact that there is effectively no perceived downside to scale. Their focus on
keeping fees low makes these operations inherently low-cost and laser focused on continued cost
control rather than investing in building best-in-class governance oversight operations with
sufficient scale to oversee thousands of companies.
Furthermore, corporate pension fund assets are one of the largest pools of capital invested in
index funds. It does not help index fund managers win business from Corporate America if they
have a reputation for being an activist or if they support activists. In fact, the opposite is likely
true. If their reputation is more for protecting incumbent management than for supporting
activists, they are much more likely to garner assets from corporate pension plans than index
fund managers who are known to vote against management.
In 2015, the three largest index fund managers, who owned 18% of Dupont’s stock, voted
against Nelson Peltz and his firm’s (Trian’s) candidates for the board of directors, in what was
described at the time as a major defeat for shareholder activism. The vote was extremely close
as most active managers voted in favor of one or more of Trian’s candidates. After the failed
vote, Dupont’s stock price declined precipitously.
While we have not done a large amount of due diligence on Dupont, based on our knowledge of
the company and the situation, we believe that the issues raised by Trian were real, and the
company would likely have benefited by the addition of one or more of the Trian nominees.
Fortunately, the close proxy contest was a wake-up call for the board. Within 90 days of the
vote, the company missed earnings and exhibited continued business deterioration. As a result,
the CEO “retired voluntarily” and the company shortly thereafter announced a merger with Dow
Chemical to address problems that Trian had identified.
What Happens When Index Funds Control Corporate America?
If the index fund trend continues, and it looks likely to do so, what happens when index funds
control Corporate America? Courts have often deemed shareholders to be in control of a
corporation with as little as 20% of the ownership of a company. At current rates of asset
inflows, it will not be long before index funds effectively control Corporate America and the
corporations of many foreign countries. The Japanese system of cross corporate ownership, the
keiretsu, has been blamed for decades of Japanese corporate underperformance and economic
malaise. Large passive ownership of Corporate America by index funds risks a similar outcome
without the counterbalancing force of large active investors and improvements in the governance
oversight implemented by passive index fund managers.
Fortunately, some of the largest index funds have begun to take corporate governance more
seriously. You may remember from our partnership with Valeant to acquire Allergan that
Allergan had devised various incredibly restrictive and burdensome notice provisions to call a
special meeting that if we, along with other shareholders, had not been able to overturn, would
have become a model for companies whose management teams seek to entrench themselves. In
light of the importance of this issue, during the proxy contest, the CEO of one of the largest
index fund managers personally attended our presentation when we met with them to seek their
support. Later, I was invited to spend several hours with the board of this mutual fund complex
to discuss governance issues in greater depth. This institution is taking governance very
seriously, and we hope a more serious approach to governance becomes more pervasive in the
index fund industry.
Certain other index fund managers during the Allergan special meeting proxy contest did not
take this issue seriously, wouldn’t even take a meeting on the issue, and did not ultimately
support the calling of a special meeting where the future of Allergan could be discussed, despite
the critical importance of this issue as it relates to corporate control of every company in the
country. This was a serious corporate governance failure in our view.
As more and more capital flows to index funds, the seriousness with which these funds approach
governance issues becomes even more critical for U.S. and global corporate competitiveness.
While fees are clearly one of the most important factors for choosing among index fund
managers, these funds’ approach to governance is a critically important consideration for long-
term investors to evaluate, as active oversight of Corporate America and global corporations is
essential to the country’s long-term business performance.
Fortunately, there are important long-term economic incentives for index fund managers to take
governance more seriously. The greatest threat to index fund asset accumulation is deteriorating
absolute returns and underperformance versus actively managed funds. Index funds have had the
proverbial winds at their backs as large and continuous asset flows support their performance.
The problem of asset flows without regard to valuation is compounded by the fact that the most
popular indexes are market-cap weighted. This means that the larger the market cap of the
company, the larger its representation in the index. In other words, as the stock price rises, its
weighting in the index increases, and the index fund is required to buy more of the company.
While value investors typically buy more as stock prices decline (assuming intrinsic value has
also not declined), market-cap weighted index funds do the opposite. They are inherently
momentum investors, forced to buy more as stock prices rise, magnifying the risk of
overvaluation of the index components.
Is There an Index Fund Bubble?
We believe that it is axiomatic that while capital flows will drive market values in the short term,
valuations will drive market values over the long term. As a result, large and growing inflows to
index funds, coupled with their market-cap driven allocation policies, drive index component
valuations upwards and reduce their potential long-term rates of return. As the most popular
index funds’ constituent companies become overvalued, these funds long-term rates of returns
will likely decline, reducing investor appeal and increasing capital outflows. When capital flows
reverse, index fund returns will likely decline, reducing investor interest, further increasing
capital outflows, and so on. While we would not yet describe the current phenomenon as an
index fund bubble, it shares similar characteristics with other market bubbles.
Consider by analogy the period leading up to the technology stock market collapse in early 2000.
During that period, Berkshire Hathaway and other leading value investing practitioners’
portfolios dramatically underperformed technology stock managers. This caused investors to
withdraw capital from value managers and allocate capital to growth and technology investors
until valuations reached bubble proportions. The tech market subsequently collapsed, with value
investing dramatically outperforming so-called growth investing in the ensuing years. Last year,
a similar phenomenon occurred as Berkshire Hathaway underperformed the S&P 500 index by
more than 1,300 basis points despite the benefit of the market support provided from it being one
of the index’s largest components.
The fact that most of the investments that we have identified in recent years have been found
outside of the S&P 500 perhaps is suggestive of the major index components’ relative
unattractiveness from a valuation perspective. It also explains why the shareholder bases of
these non-index companies is comprised mostly of hedge funds and other active managers who,
like Pershing Square, use discount to intrinsic value as a primary investment consideration.
As many of these index managers are U.S. corporations, other interesting governance question arise about their corporate control and influence
in foreign jurisdictions where activism is less prevalent.
The recent underperformance of non-heavily indexed companies creates an opportunity for savvy index fund operators and a good long-term
hedge for their businesses. Index fund managers should create index funds of under-indexed stocks.
The Pershing Square Portfolio Holdings Trade at a Large Discount to Intrinsic Value
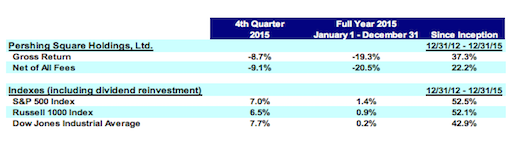
While the Pershing Square funds have dramatically outperformed the S&P 500 since the
inception of our first fund in January of 2004 by an average of ~1,000 basis points per annum,
last year we substantially underperformed the market. As our investment holdings have not
materially changed (we have sold some Mondelez and bought more Valeant as described further
below) the result of this underperformance is that we believe that our portfolio is trading at the
largest discount to intrinsic value in its 12-year history, other than perhaps during March 2009 at
the market bottom.
While capital flows drive market prices in the short term, value drives markets over the long
term. As an investor with substantial influence over the companies we own, we can be a catalyst
to unlock, enhance, and protect their value. The low market valuation of, and our influence over,
our portfolio companies give us confidence about our future performance. While the recent
stock price declines impair our short-term performance, they should inherently increase the
returns available in the future for our current or new investors.
The above would not be true in the event that recent declines in the market prices of our
investments correspond with similar declines in their intrinsic values. Our principal job is to
constantly make this assessment and reallocate capital appropriately. For investments which
represent the substantial majority of our capital, our assessment of intrinsic value has remained
stable, increased, or declined slightly due to currency and economic weakness in certain sectors,
and we update this analysis continually.
Recent Portfolio Changes
As a result of relative stock price movements in our portfolio, Mondelez became a
disproportionately large position in the funds, and Valeant became a smaller and, in our view,
even more attractive investment. At year end, while we believed Mondelez was trading at a
significant discount to intrinsic value, we reduced our stake in Mondelez through the sale of
forward contracts representing 15 million shares at an average price of ~$44 per share, reducing
our total ownership in stock and derivatives to ~105 million shares. We redeployed some of this
capital by increasing our investment in Valeant through the net purchase of option contracts on
the company, which we discussed in detail in our third quarter letter. We continue to be highly
optimistic about the potential for Mondelez as it improves its operational efficiency and
continues to grow while remaining an attractive merger candidate, and therefore, we expect to
remain a substantial, long-term holder. While we are long-term investors, we always seek to
optimize the risk/return profile of the portfolio by changing the weightings of existing holdings
and comparing portfolio holdings with new investment opportunities, making adjustments and
wholesale changes when appropriate.
The Current Opportunity Set
To that end, recent market conditions have created perhaps the richest universe of new
opportunities for us to consider in recent years. During the last few months and weeks,
companies that we have previously researched which met our standards for business quality, but
whose valuations were not appealing, have dropped dramatically in price. We have multiple
attractive new opportunities to consider, competing for internal human and capital resources.
This bodes well for the identification of new investment opportunities. That said, we are
unlikely to make wholesale changes to the current portfolio as we find the valuations of our
holdings extremely attractive. Still, we would be surprised if we did not add at least one new
investment in the next few months.
Many of the investment opportunities we have identified over time have been created by the fact
that the market appears to value companies based principally on short-term factors rather than
long-term changes in intrinsic value. For example, in light of China weakness, commodity price
declines, and the events in the U.S. energy markets, current earnings and future expectations for
railroad volumes have declined somewhat. We believe that this has reduced Canadian Pacific’s
intrinsic value by perhaps 10% or so while its stock price has declined ~35% from its August
2015 high. The value of a business is determined by the present value of the cash it generates
over its lifetime, not based on what next year’s earnings are going to be. While the first year’s
cash flows in a discounted cash flow valuation carry the most weight in the calculation, years
two through 20 and thereafter contribute many multiples of year one’s value in determining the
present value. This fact seems to be ignored by investors in today’s markets. The market’s
short-term valuation approach coupled with the technical factors present in non-index supported
companies can lead to short-term gross under-valuations and new long-term investment
opportunities.
Hedging
While we have never attempted to hedge short-term market movements, we have always looked
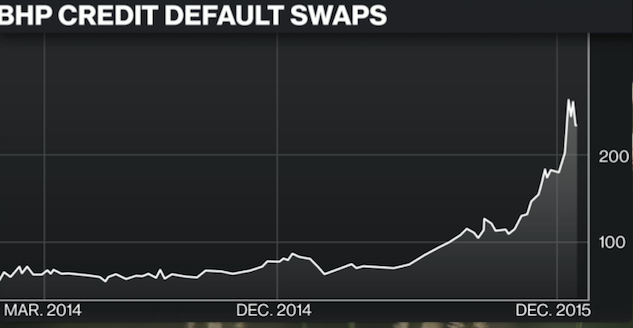
for ways to inexpensively hedge the risk of dramatic market declines. In 2007 and 2008, we
benefited from inexpensive hedges and other investments we made shorting the credit of highly
rated, highly leveraged companies. We largely abandoned this strategy in 2009 as corporations
recapitalized and balance sheets improved, but we are always looking for attractive and
asymmetric potential hedges that may also be interesting investments on the theory that the best
hedges are investments that you would make even if there were no hedging benefit.
Because CDS have been an unattractive hedge, we have looked for other instruments and hedges
which might protect us against “Black Swan”-type risks that may exist in the markets. Early last
year, we identified two such risks, the risk of a dramatic deterioration in the Chinese economy
and its highly valued stock market, and the risk of further declines in oil prices. While we
believed that the Chinese stock market was in bubble territory, the cost of buying puts on the
stock market was prohibitive. The same was true for puts on oil prices. While we did not
believe that either risk was particularly material to our portfolio holdings, each had the potential
to affect overall stock market values and general economic conditions. In the event of large
stock market declines, we always like to have liquidity for new investments. Other than by
generating cash from selling investments or by raising outside capital, short positions and hedges
are the only way to generate cash when markets are plunging.
Last summer, we built large notional short positions in the Chinese yuan through the purchase of
puts and put spreads in order to protect the portfolio in the event of unanticipated weakness in
the Chinese economy. We also purchased puts on the Saudi Riyal as an inexpensive way to
hedge against a continued decline in energy prices. Both of these currencies are pegged to the
U.S. dollar, and therefore were inexpensive to hedge against the dollar as the pegs reduced
volatility and the cost of put options. Two days after we began to build our position in the
Chinese yuan, China did a 2% surprise devaluation which substantially increased the cost of the
options we had intended to continue purchasing. We continued to build the position thereafter
by buying slightly more out of the money puts and selling further out of the money puts so as to
keep the cost and risk/reward ratio of the position attractive.
To date, despite the large notional size of this currency/market hedge and continued weakness in
the yuan and growing pressure on the Saudi Riyal, we have made only a modest profit on these
investments. Both China and Saudi Arabia have inadvisably, in our view, continued to expend
hundreds of billions of dollars to protect their currencies pegs. Our currency puts, therefore,
have not, to date, served to be a useful hedge against declines in our portfolio as our investments
have declined much more dramatically than we would have expected in light of their limited
exposure to the Chinese economy and oil prices. That said, we believe that both currency
investments continue to offer an important hedging benefit and represent an attractive riskreward,
and therefore, we continue to hold them.
Organizational Update
Paul Hilal joined Pershing Square initially as a consultant in early 2006 and then full time in
2007. We started slowly because we didn’t know how things would work because Paul’s focus
prior to Pershing Square was technology, and we had never made a technology investment.
More significantly, Paul and I had known each other for many years having roomed together in
college, and having stood by each other’s side at our respective weddings. We knew that it can
be difficult for close friends to work for and even partner with the other. We both thought our
arrangement could last three to five years and possibly more if things worked out.
This January marks a full decade of Paul’s commitment to the firm. He has been a great member
of the team, and an important contributor to the firm’s success. Paul is perhaps best known
internally for his extremely deep research into companies and industries which have enabled us
to broaden our investment universe. Beyond Paul’s contributions and insights as a member of
the investment team, has been his design and oversight of our analyst recruitment process that
has brought us tremendous talent including Brian Welch, Anthony Massaro and Charles Korn.
While Pershing Square has been a great training environment for all of us including Paul,
because we are a “one-product” and one portfolio firm, there is no opportunity for a more senior
member of the team to manage his own portfolio while being at Pershing Square until I step
aside from this role, which I have no plans to do. As a result, when members of the team have
reached a stage where they want to manage their own portfolios, they have no choice but to leave
to launch their own firm. Six years ago, Mick McGuire left to found Marcato Capital, and nearly
four years ago Scott Ferguson left to form Sachem Head.
Beginning nearly two years ago, Paul and I initiated a discussion about when it might make
sense for him to make the transition to pursuing his own venture. Paul is now ready to do his
own thing and I expect him to be a great success. Whatever he decides to do, I encourage you to
give him a close look. As we have with both Mick and Scott, we expect to partner on some new
investment in the future with Paul and we look forward to that day. If you would like to reach
Paul, please contact him at [email protected].
We are fortunate that we have had limited turnover on the investment team and throughout the
firm since our inception. It makes my job easier as consistency in the team leads to greater
overall efficiency and minimal organizational issues. The benefit of some turnover on the
investment team is that it allows us to keep the team small – in my experience 10 or fewer team
members is ideal to manage a highly concentrated portfolio – while allowing room for fresh
talent to join the team. Today, I believe we have the best and most seasoned investment team
since the inception of the firm. If you are attending this year’s annual meeting, you will hear
from each member of the team, and you will have an opportunity to judge for yourself.
Priti Jajoo, a member of the accounting team, and Maribeth Youngberg, an assistant to the
investment team, have both chosen to stay home with their new babies. While we do our best to
create an environment where mothers can return to the company after maternity leave and create
the right work life balance – and many women on the team have returned after maternity leave –
some of our team members have chosen to be full time moms, and that is of course a decision we
greatly respect.
Humility
I have often stated that in order to be a great investor one needs to first have the confidence to
invest without perfect information at a time when others are highly skeptical about the
opportunity you are pursuing. This confidence, however, has to be carefully balanced by the
humility to recognize when you are wrong. While no one here is enthusiastic about delivering
our worst performance year in history in 2015, it certainly does a good job reinforcing the
humility-side of the equation that is necessary for long-term investment performance. In 2016,
we would like to generate results that reinforce the confidence side of the equation. Humility
and skepticism will help get us there.
Sincerely,

William A. Ackman
Comments »