I’ve been watching Apple Inc. ($AAPL) for a while now, and frankly, hoping for a shortable bounce. Unfortunately, I was away from the computer all day today (at a conference) and only just now noticed the line in the sand breach by Apple.
See below:
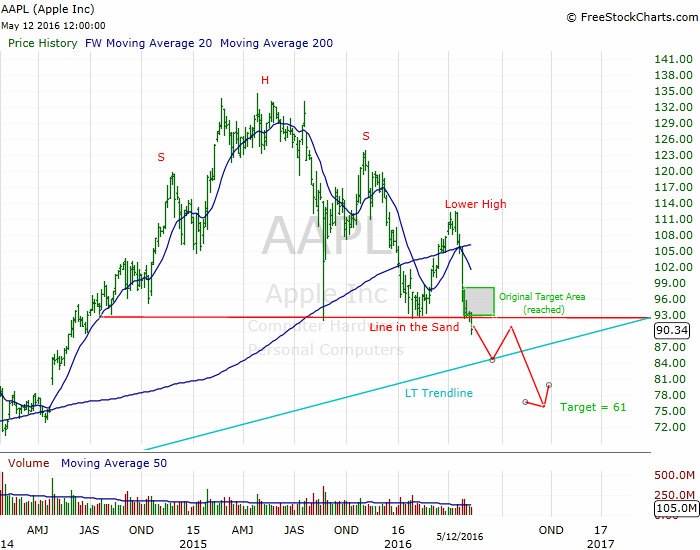
This chart technically displays a funky looking head and shoulders pattern with an extra “lower high” as noted above. There is a very long term trendline rising up all the way back from 2009 that is converging on this area as well. That trendline will probably attract some value buyers into the stock. Whether it will be enough to recover the $93 level is yet to be seen.
I believe this is a critical moment for Apple, and for that matter the stock market as a whole. Since this picture is so well defined I’d suggest using this company as a guidebook for the entire market.
Apple is like this century’s GMas goes GM so goes the nation”.
Bottom line: if $AAPL cannot recover the line in the sand at approx. $93, then I’d surmise that not only is $AAPL heading lower, but the big bull market itself is dead.
I may buy some short term puts on this in the morning although I hate the fact I missed the break earlier today. Stay tuned and keep your eye on $AAPL as an overall indicator. Finally, be sure to follow me on Twitter @dyer440.
If you enjoy the content at iBankCoin, please follow us on Twitter


If AAPL gets to $61 imagine how low NFLX is going to get
No kidding! I have it ultimately going to the mid 40’s.
Nice analysis man, good to have you back. Quick question. Where do you get the $61 price target from? Thanks.
Thanks. I have a long term fib level around 60; there’s also a significant low from 2013 in that area.