“The recent plunge in gold prices below $1500 an ounce has suddenly awoken, well, just about everyone. The “gold bugs” are yelling that it is a conspiracy theory by the Fed while the stock market bulls say it is a sign that the Fed has achieved its goal of creating economic growth. Unfortunately, both arguments, while great for headlines, are wrong.
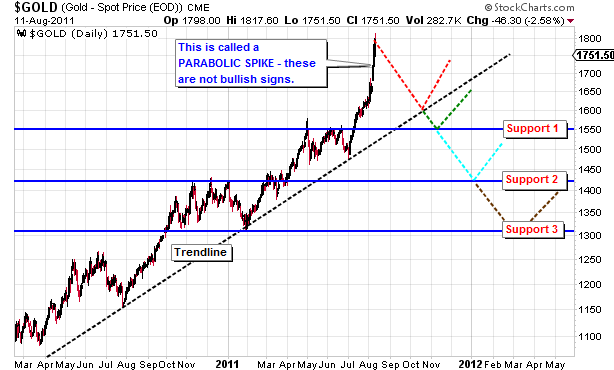
In August of 2011, during the original debt ceiling debate, gold spiked sharply to just a tad over $1800 an ounce. In my weekly missive that month I answered the question of “Should I Buy Gold Now?” stating:
“In a one word answer…Are you kidding me – Gold has never been this overbought before and if you ever want to be the poster child of buying at the top – this is it. Okay, not really a one word answer but here is my point. Gold is currently in what is known as a ‘Parabolic Spike’. These do not end well typically as it represents a ‘panic’ buying spree. Therefore, if you currently OWN gold I would recommend beginning to take some profits in it.”
At that time i showed four potential levels of retracement.
The advice at that time fell on deaf ears as investors feared that the government was going to default on its debt and the economy was going to plunged back into a deep recession. Of course, anyone paying attention to the 10-year treasury rate, as it plunged to then record lows, would have understood that a default was not going to be the case.
Of course, the debt ceiling was eventually raised and disaster postponed due to last minute negotiations. The release of that fear, and subsequent interventions by Central Banks globally, led to a rotation out of the fear trade which began the process of a gold price reversion.
Parabolic spikes in asset prices always lead to price reversions. Whether it is gold, oil, or the price of Apple stock – excesses to one extreme lead to excesses in the other. It is often in the final leg of this reversion process that investors “give up” on the previous long held beliefs and throw in the towel. This action is known as “capitulation” and tends to be a buying opportunity for astute investors at some point.
The chart below shows the long term price of gold relative to the percentage deviation in price from gold’s 34-week moving average…..”
If you enjoy the content at iBankCoin, please follow us on Twitter


