iBankCoin
Joined Nov 11, 2007
1,458 Blog Posts

The DeMark Indicators

I have read a fair amount about Tom DeMark and his indicators. The indicators are very popular, but have been somewhat hard to quantify, and therefore have had an aura of mystery surrounding them. For a very good primer on the man and his methods, this article will be very helpful: Impressive Signals from DeMark.

The recent (2008) publication of Jason Perl’s DeMark Indicators (Bloomberg Market Essentials: Technical Analysis) is exciting as Perl is fairly successful at describing the indicators in a way that allows them to be quantified. While I have not read DeMark’s books, I understand that Perl describes DeMark’s indicators better than DeMark himself.

I purchased Perl’s book a few weeks ago. While he makes every effort to clearly describe the TD setups, the content is somewhat confusing. I have not made it past the first 20 pages, and I have to keep re-reading those pages over and over. My first impression is that these indicators and setups are over-optimized and curve-fitted. Keep in mind, that is simply a first impression.

I have the rudiments of the TD Sequential Buy and Sell Setups coded, and have run some preliminary proof-of-concept type backtesting in Stockfetcher on these. So far, the results are poor. Granted, I do not yet have a thorough understanding of these indicators, and I know that finding stocks meeting the TD Setup criteria is only the first step of a multi-step process necessary to trade these strategies and indicators as they were designed.

I am curious if there is anyone out there who is trading with these indicators and strategies. I would like to hear what indicators traders are finding to be successful.

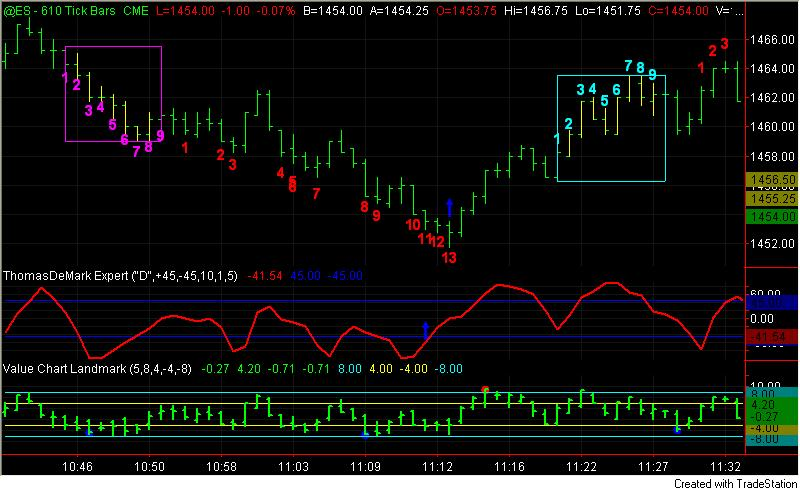
For those who are unfamiliar with DeMark, below is a screenshot showing the TD Sequential and the TD Range Expansion.

Shameless Plug: If the book appears worthy of being added to your trader’s library, please use the link to Amazon that I provided to purchase the book. I will get a very very small kickback from Amazon for the referral.

Comments »

Tracking a New Short System in Covestor Account

 The account that is tracked by Covestor is traded through the Tradestation platform and brokerage. There have been several times over the last few months when I wanted to locate shares to short, but Scottrade couldn’t find any. In order to take the trades, I had to use my Tradestation account, as they had no problem getting me shares.

As I’m really starting to like this new short-selling strategy, and I’ve already traded it 3 times in my Covestor account, I’ve decided to use the Covestor account from now on to track the strategy. To be clear, the Power Double Dip ETF strategy has been the main strategy traded in the account, but it will now be joined by the new short-selling system.

Here are some recent statistics for the new system. These results cover 12-12-2006 to 12-12-2008.

Trade Statistics
There were 190 total stocks entered. Of those, 189 or 99.47% were complete and 1 or 0.53% were open.
Of the 189 completed trades, 126 trades or 66.67%resulted in a net gain.
Your average net change for completed trades was: 2.83%.
The average draw down of your approach was: -3.96%.
The average max profit of your approach was: 6.97%
The Reward/Risk ratio for this approach is: 2.56
Annualized Return on Investment (ROI): 194.46%, the ROI of ^SPX was: -18.50%.
Exit Statistics
Stop Loss was triggered 31 times or 16.40% of the time.
Stop Profit was triggered 0 times or 0.00% of the time.
Trailing Stop Loss was triggered 0 times or 0.00% of the time.
You held for the maximum period of time (5 days) 80 times or 42.33% of the time.
An exit trigger was executed 78 times or 41.27% of the time.

As the above stats show, the system has been a big winner over the past 2 years. Performance during 2002-2006 has also been respectable.

The system has a very short time horizon, as evident by the maximum hold time of 5 days. The system seeks stocks who have been big winners, but have rolled over. It will then sell these stocks short on strength within the context of a larger downtrend.

The statistics above were generated by an 8% stop. The system can never hold more than 8 shorts at one time and will not enter more than 2 positions in one day.

2 Recent System Trades

The blue arrows indicate the day the signal was generated. The trades executed on the opening of the next day.

I will not often mention these trades before execution because I am continually concerned about introducing slippage. However, I believe that if someone is tracking me on Covestor that it will let him know when I’ve made a trade.

As always, the entry and exit for this system is generated 100% through technical analysis.

Comments »

Fish or Cut Bait

The indexes must make a move, one way or the other, very soon. Momentum appears to be slowing down, and so we may get a larger pullback before challenging the 50 day average again.

As of this morning, the iBC website has decided to NOT post any of my recent comments to any blog, even to my own. Frankly, I find that a tad irritating. I’m going to take it as a sign, and take the night off.

Feel free to use my blog’s comment section for your personal playground, knowing I will not be able to stand up for myself.

Good luck, and see you tomorrow folks, in the comments section, maybe.

Comments »

If It’s Wrong to Be Long…

This is really a frustrating time for me, in terms of blogging. I have no laptop. I’m forced to share my computer with a greasy 17 year-old. There are no great charts to write about. Most of my systems are still in between signals. Yet, it is still a very exciting time to be trading, and I want to stay engaged through writing about what I’m seeing and thinking.

What I’m thinking and seeing is that it is time to be bullish. I can find little in the technicals to be extremely bearish about, unless you consider the prior 12 months of chart. Right now, the indexes are making higher highs, and higher lows. Volatility is decreasing. Today’s pullback was nothing to be alarmed about. Forget the previous 12 months. Traders should be taking on small, starter positions here, with loose stops. Caution is still in order, although I believe we are getting some significant support built here.

The greatest concern to all traders is the 50 day average. The 50 day average can provide serious resistance. However, once the indexes climb above the average, it marks (in my opinion) the beginning of a new trend, and can then develop as support.

Note carefully on all of these charts that these index ETFs have climbed right to the 50 day, and have paused. I am not alarmed by this, yet. We should expect resistance here, and we have seen it. Now we need to see an orderly pullback, and then another run at the 50 day average.

Note we have a fairly steep uptrend defined, starting from the November low. Volatility, as measured by ATR(10) is slowly tailing off. Volatility must decrease if we want the more skittish investors to return to the markets. Also, volume decreased on today’s pullback.

Same on the SPY. Paused directly at 50 day average. Volume decreased. Volatility decreasing. Uptrend still intact.

The Qs have a slightly different technical look. As volume has been decreasing for the last few weeks, I think the ETF may be consolidating, rather than trying to come off a bottom. If it is consolidating, the triangle formation makes sense to me. I would love to see a move on volume out of the triangle and above the 50 day average (shown by blue arrow).

To be clear, no one should be betting the farm with long positions. Caution is still in order. Watch the newly formed uptrend lines (drawn from November lows) for clues. If the indexes break beneath the uptrend lines, and then close beneath them for a day or two, the markets may seek to test the November lows.

The markets will remain volatile. The only way not to get shaken out, when positioning early in a new uptrend, is to start with small positions and use loose stops.

Comments »

No Breakouts To Speak Of

I was going to post some charts of some select breakouts. I assumed that after the last couple of days there would be at least a half dozen. Wrong. My screens are showing no healthy breakouts. Granted, I didn’t screen for hours…

So what do I mean by healthy? I am looking for stocks that have broken out of a sound base, such as double-bottom, flat, or cup-with-handle, on volume greater than the average.

There are, however, many stocks that are exhibiting momentum. If one just looks at a three month chart, the stocks are gorgeous. But when the chart is expanded to look at 6 months to a year’s time, most of these are approaching massive overhead resistance.

While I’m still bullish, it makes sense to stay cautious when there is no leadership to speak of. As much as I want to find some hot breakouts for a Santa Rally, it may make more sense to just play the index double-long and double-shorts.

Since my search for juicy charts to post was stymied, I’ll leave you with one I like. I am long it, as of this morning, so make of that what you will.

The volume that has come into this is incredible.  At this price, buy a few hundred shares and forget about it. Treat it as a call option. A run to the 50 day average would be better than a double.

Comments »

Big Bamboo Suffers Large Losses

Today, QID, SDS, and SMN all gapped beneath their stops for this system. This resulted in QID and SDS losing 2-3% more than projected, which is not terrible. What is terrible was SMN, which resulted in a loss 2x the projected 1% risk amount.

Since the gap down would have triggered the stop market orders, each position was closed at today’s opening print.

The latest trades have really put a hurtin’ on the system performance. As of today, the system is in a 12.5% drawdown from its highs. I will have to check to be sure, but I’m fairly certain this exceeds the max drawdown from highs realized during backtesting.

Trading is such a psychological challenge. Remember that I changed the stop to 8% and increased the position size to 2% as of the November 25 SDS trade. Wouldn’t you know that the two winners since then were smaller than expected, and all three losers were much larger than expected. In fact, the combined losses from these three closed trades were more than the combined losses from the seven previous losing trades. Ouch.

The system is still showing gains of 9.41% since inception (ignore the cash amount, I forgot to update it). But to look at the spreadsheet, would anyone want to trade this system? Probably not. As I’ve said at least a half-dozen times, this is why I’m tracking the system on the blog. I hope that watching this in real-time has helped or is helping traders think about the difficulties in developing and then trading systems.

On the bright side, I’m hoping the next trades are going to be from the long side.

No New Entry Signals

Comments »

To TBT, or Not to TLT? Position Size is the Question.

Treasuries have recently run higher than ever before ( feel free to fact check that, that’s what I’ve heard). I took a stab at TBT about 3 weeks ago, and was stopped out. I was very very early. I am going to set an order on Monday in my discretionary account to purchase TBT again.

I had considered shorting TLT. However, after calculating position sizing and stops, I believe TBT offers a better opportunity. Not to mention, there may not be shares of TLT available to short.

Let me explain why I think going long TBT is a better trade.

In order to determine a position size, the amount to be risked must be determined. For our purposes, let’s say we’ll risk 1K, which would be 1% of a 100K account.

To determine the stop, I like to use ATR(10). As the above chart of TBT shows, ATR is 2.41. We’ll take a multiple of that figure. I like 1.25*ATR. Here is the calculation: 1.25*2.41=3.01

Therefore, our stop will be $3.01 beneath the entry.

To get our position size, we divide our amount risked (1K) by our stop. $1,000/$3.01 = 332 shares of TBT to be purchased. Note: Our stop level is conveniently beneath Friday’s low, an added bonus!

Now lets look at position sizing for shorting TLT

1.25*2.36 = $2.95   Remember that was 1.25*ATR(10).

Thus, our stop will be $2.95 above the entry.

$1,000 / $2.95 = 339 shares.

Thus, shorting TLT will allow for a slightly larger position size (339 vs. 332), with the same risk as going long TBT.

Let’s take it one step further and complete some volatility analysis of each ETF.

To calculate volatility and normalize it across both instruments, we’ll divide ATR(10) by Friday’s close and then turn it into a percentage.

TBT (2.41/44.10)*100 = 5.46%

TLT (2.36/110.48)*100 = 2.14%

TBT is twice as volatile as TLT. This should be no surprise since it is a double-short ETF. If the trade gets the expected move to the upside, then TBT will be the best choice as the position sizing is similar to TLT but on any run up, it may move twice as far. Basically, the risk is the same, but the payoff may be double.

Caveat: Any significant gap up in TBT on Monday may throw off the calculations.

Comments »