iBankCoin
Joined Nov 11, 2007
1,458 Blog Posts

Big Bamboo Update

My trusty laptop, the one I’ve done the bulk of my blogging, surfing of the interwebs, and checking email on for more than two years, has died. Luckily, it gave me some heads up that it may be getting ready to kick the bucket, and I was able to get everything from it that I wanted to keep. The point of all this is that I hate blogging, surfing, and doing research on a desktop computer, so blogging may be lighter than normal until I find a replacement.

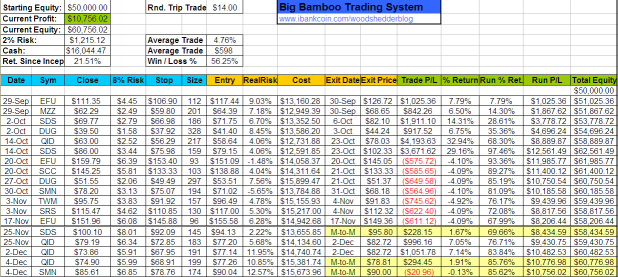
The Big Bamboo finds itself locked into three short positions just as the market is beginning what I believe will be a huge rally. No problem. All three positions are close to being stopped out, and the system will still show a nice return year-to-date.  Of course I could be wrong about the rally. We’ll see. All three open positions are marked-to-market as of Friday’s close and are highlighted in yellow.

If there is a rally, the system is going to soon hit a point where it will not make any trades, until it decides what the trend is. This means it may miss the first two weeks or so of any rally, before it decides to go long. You can bet though that as soon as the trend has been defined, the Big Bamboo will be jumping in LONG on the first pullback. Personally, I can’t wait to make some trades from the long side. But that is just me, and it has nothing to do with what the system will do.

Good luck this week.

No New Entry Signals

Comments »
Updated Spreadsheet for Big Bamboo

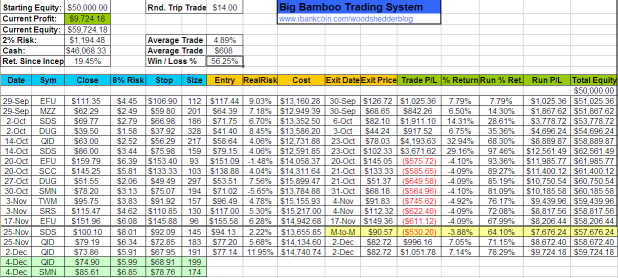
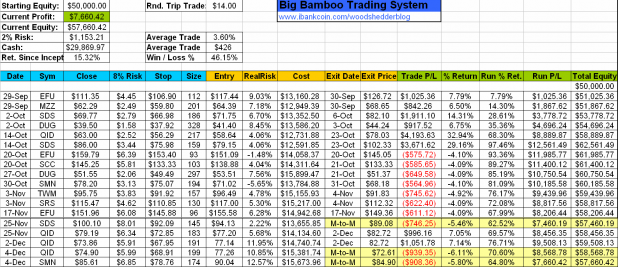
On today’s open, the system picked up QID and SMN. These diETFs gapped up on the open, eating up most of the potential profit for the day, before the day even started. The two new positions, plus the existing SDS position, are marked-to-market as of this evening’s close.

The system is now holding 3 of a maximum of 4 positions.

I intend to have a serious meeting with myself this weekend to decide when I will begin trading this system in my audited account. Stay tuned!

No New Entry Signals for Friday

Comments »

Bullish Bias: Technical Analysis of the Dow Jones

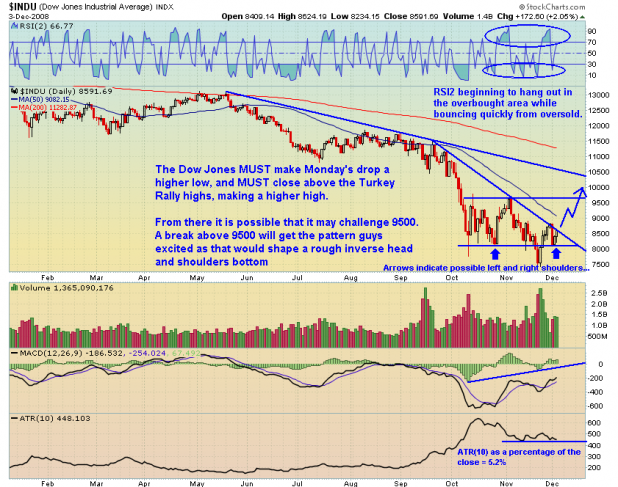
I know this chart is more cluttered than my usual charts. Bear with me, as I have a lot I want to cover.

1. Friday’s Turkey Rally high must be exceeded, soon. This will make a higher low (Monday’s 7.7% day) and then a higher high. This is the very first step in establishing a new trend.

2. The downtrending line I’ve drawn from September through today’s close must be broken, and the index should close above it for at least 2 days.

3. The 50 day average resistance at 9082 and whole number resistance of 9000 should not be ignored. However, should the index blow through this area, such a strong move should also not be ignored. Closing above the 50 day average will be evidence that a trend change has begun.

4. 9500 is an important area, as getting above that level will see the Dow clear a 3 month congestion zone, and will allow the index to run for the 200 day average.

5. RSI2 is beginning to hang out in the overbought zone and as been bouncing quickly from oversold conditions.

__________________________________________________________________________________________________

I’m bullish here, and will be willing to leg into long positions again as soon as I see a higher high. I do not know how far a bear market rally will take the Dow, but a run from 8,000 to 10,500 would be worth 24%, and seems reasonable. A run to 9500 is worth 10%.

I like mental or hard stops set to trigger with a Dow close beneath 8,000, combined with stops set to an appropriate (small) risk level for each position.

As for taking profits, that is always the hardest decision when trading discretionary plays. Scaling out of positions at various resistance areas might make an interesting way to play a bear market rally.

Added Bonus: Rob Hanna’s recent post about market returns based on where the SPX is trading relative to the 50 and 200 day averages.

Comments »

Big Bamboo Presses Bets; Will Short More Thursday

Highlighted in a pleasing green hue are the two ultra-short ETFs the system will buy on Thursday’s open.

The previous QID positions have been updated to reflect being closed out on Wednesday’s open.

SDS is still open, and is about 4% away from being stopped out.

Honestly, my gut is telling me that an intermediate term trend change is underway, and I do not relish the thought of stepping in front of it. And therein lies the system trader’s greatest challenge: taking the signals that he does not want to take.

Comments »

Bullish Charts: Ready to Establish Longs?

On November 13th, I suddenly and somewhat inexplicably became bullish. Well, honestly, there were some technical reasons, but more than that, my change in sentiment was purely due to a gut feeling. Feel free to re-read the post here: I’m Very Very Bullish.

Four of the five trades I put on after that post stopped out. APOL is the only position I’m still in. It has been doing well for me. Anyway, I’m still somewhat inexplicably bullish. I do plan to begin establishing some “feeler” long positions, once the indexes break above resistance.

The following are some charts that I think can make some good hedges if one is looking for exposure on the long side. If the indexes want to make another run against overhead resistance, I may try some of these trades, in anticipation of continued strength. These positions should be small, and should not be risking more than .5% of total account value. Positions made in anticipation rather than after confirmation should be kept small, initially.

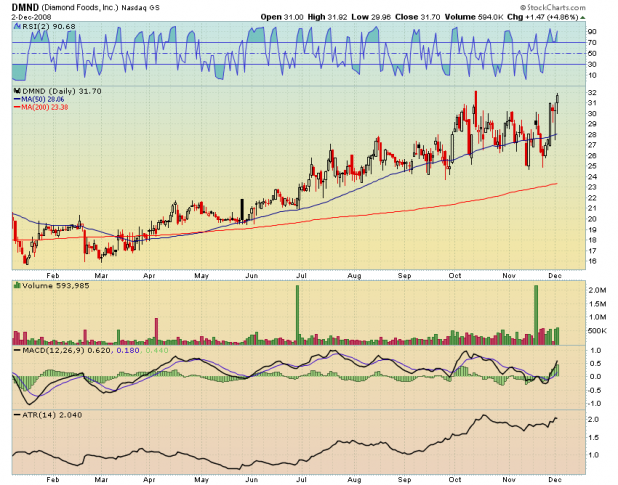
DMND looks interesting, if one can stomach the ATR(10) volatility of 6.4%

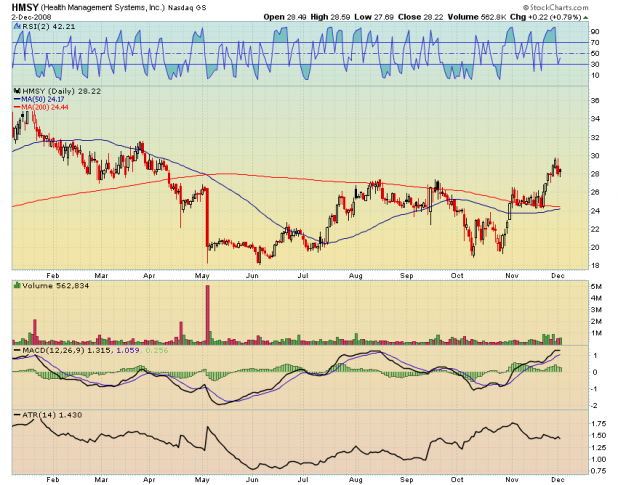
HMSY is making a nice pullback to support. Volume picked up on the the up days. A Golden Cross is going to be completed very soon.

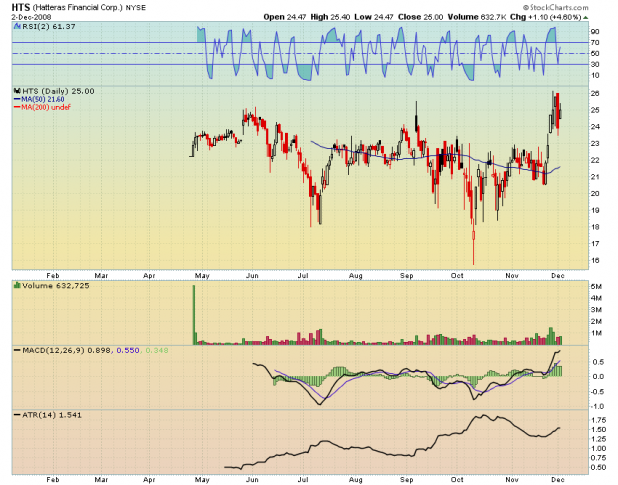
HTS is a ragged looking IPO. Still, its strength over the last 7 months should not be ignored.

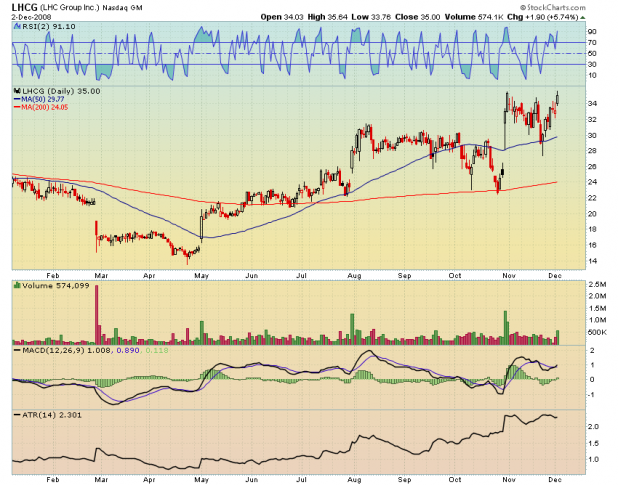
LHCG is stair-stepping up. Will this breakout fail?

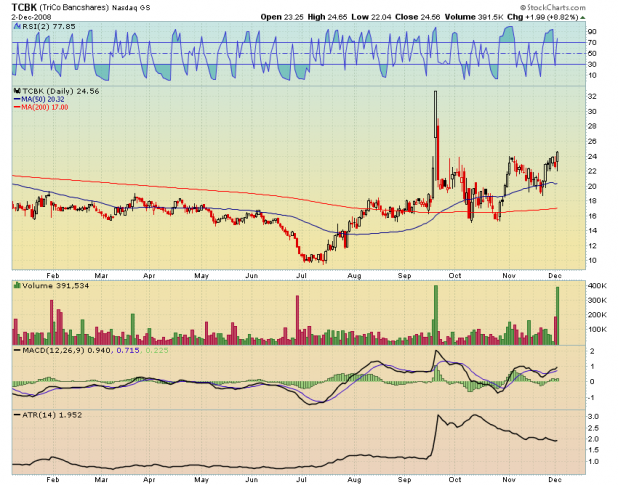
TCBK is not very liquid, but volume is increasing.

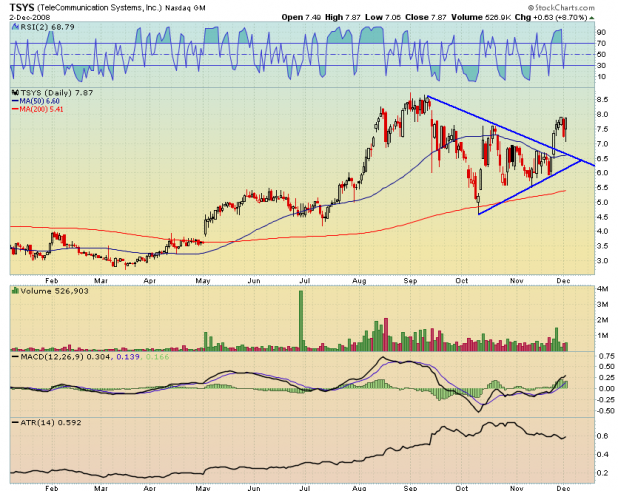
TSYS may be my favorite chart of this group. I really like getting in breakouts from triangles.

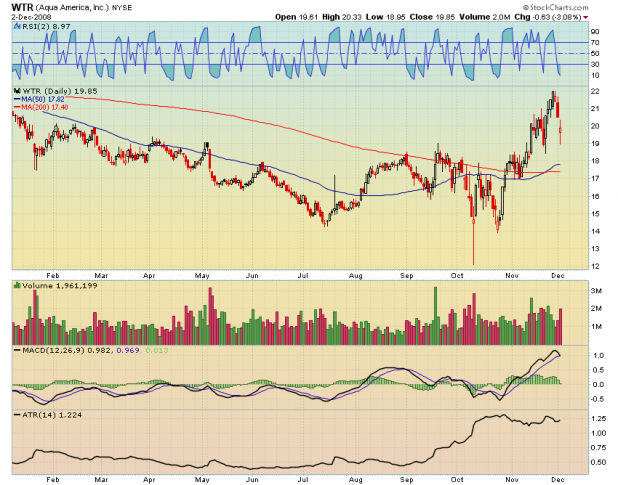
 WTR has made a nice pullback after a breakout from a flat base.

Comments »

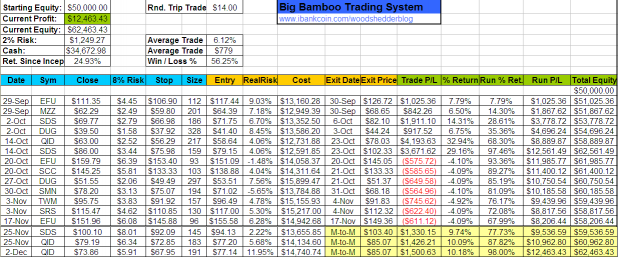
Big Bamboo Near YTD High; Will Close Out 2 Positions

The system has once again excelled in this volatile environment. I mentioned last night that I expected volatility to pick back up, and did it ever. The additional QID position was purchased on the open, as indicated in last night’s post. Today’s large move has put RSI(2) on QID over 80, which means both QID positions will be closed on the open. SDS is just shy of the exit signal with RSI(2) at 78.29, so it will be held until the exit criteria is met. In my personal account, I took the SDS trade, and I will be selling the position tomorrow.

All three open positions are highlighted in yellow and marked-to-market as of Monday’s close. It is exciting to see the system pull itself out of a drawdown in just 3 trades. Granted, SDS could reverse and end up getting stopped out.

The most important development is that the Big Bamboo has weathered its first losing streak! I encourage anyone who is following this system, live, on paper, or just for fun, to examine how the drawdown and losing streak affected your psychology. Remember that the psychology of the person trading the system can have a huge influence on whether the system generates profits, or losses. If any of these last 3 trades would have been ignored, due to a loss of faith in the system, the Big Bamboo would still be in a drawdown.

Congratulations to anyone who has stuck with the system so far! A 25% return over the worst 2 month market period since the Great Depression is something to be proud of. With a little luck, SDS will be closed out even higher than where it closed today, and the system will be at a new year-to-date high.

One final note. The entry and exit signals for this system are generated 100% from technical analysis.

No New Entry Signals for Tuesday

Comments »