iBankCoin
Joined Nov 11, 2007
1,458 Blog Posts

Big Bamboo: New Signal For Monday’s Open

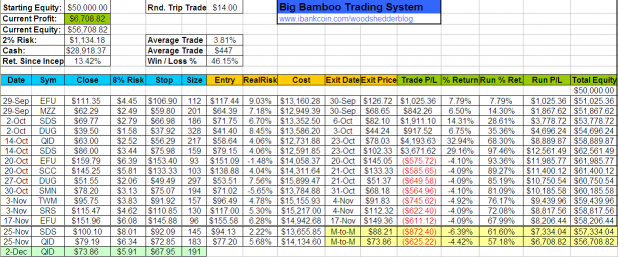
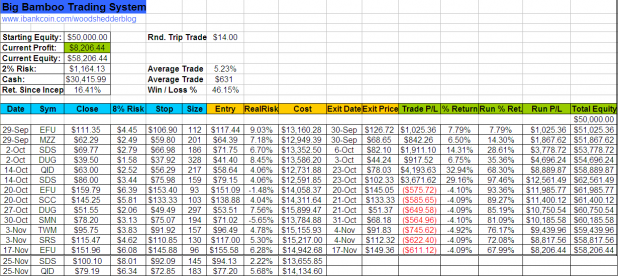
Highlighted in a pleasing green hue is the new entry for Monday’s open.

The existing 2 positions have been marked-to-market as of Friday’s close. The % Return shows that both positions are losing, with SDS less than 2% away from stopping out.

Adding another QID position will have the system in 3 of a maximum 4 positions.

My post last week, about the Big Bamboo reseting and re-evaluating before adding more positions was timely, as this is exactly what has happened to get a doubled QID position.

Comments »

SPY: Will It Be Different This Time?

I am short the SPY, via SDS, as well as the Russell 2K, via TWM. Tomorrow I will add QID (more on that in a future post).

It has not been psychologically easy to initiate these positions, but the setup is money. In order for this setup to fail, the indexes will have to prove they have the strength and resilience to push through resistance and maintain an overbought status for more than a day or two.

If my index shorts stop out, it will have been different this time.

Here is what I’m seeing:

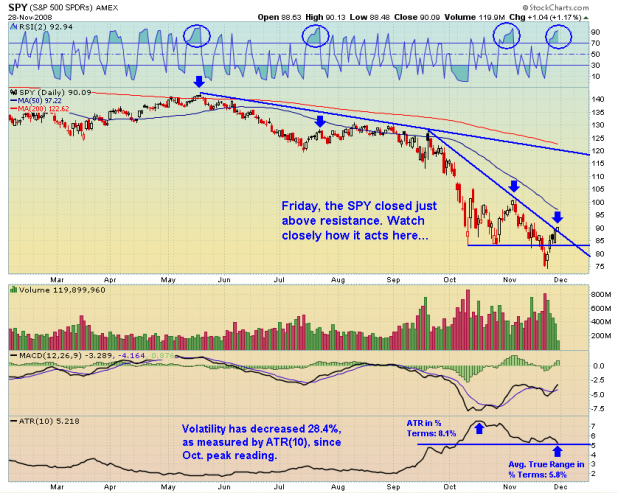
RSI(2): the chart shows that when it reaches this level, a reversal is typically soon to follow. If it does not reverse soon, RSI(2) may float in the overbought area, which would be bullish.

Resistance: the chart shows the SPY (the Dow Jones and Nasdaq are similar) closed Friday just above resistance. However, the close was not significantly above resistance, and volume has been weakening. Confirmation is necessary.

Volatility: If the indexes begin to pullback, it is likely that volatility will increase again. Volatility in November has been hovering in a tight range. A continued decrease in volatility, as measured by ATR(10), will be bullish, in my estimation. Should the indexes consolidate here, trading sideways, or continue to wedge higher, this will likely cause ATR(10) to continue falling off.

__________________________________________________________________________________________________

Obviously, I’m a little nervous here as the indexes have yet another chance to put in an intermediate-term technical bottom. The worst case scenario (for me) is that the indexes continue melting up, hit my stops, and then reverse.

There will be a pullback, soon. If volatility increases during the pullback, my positions will profit. A quick, short pullback, or consolidation on decreasing volatility will make me very very nervous that an intermediate-term bottom is in place, and I will likely seek to exit my short positions with small losses, or at break-even.

Comments »

Big Bamboo Update, and More Short Signals

The Big Bamboo was blessed with a gap-up on the indexes, which resulted in the system picking up SDS and QID at a significant discount to Monday’s closing price. Thus, both trades were quickly profitable and never went against the entry for more than 50 cents. I picked up SDS in my personal account, and received a price improvement of one dime over the listed open.

I want to note that I made a mistake in last night’s spreadsheet, when I put in Monday’s low-of-day instead of the closing price of QID. That mistake changed the position size a bit, but not signficantly. The mistake has been corrected in tonight’s sheet.

The above trades will either be stopped out, or sold when RSI(2) closes above 80.

More (Possible) Short Signals

The Big Bamboo is designed to give signals, and then reset. For example, last night, there were more signals than the ones the system purchased. However, the system doesn’t see those pre-existing signals tonight, because it reset, even though the same conditions exist tonight that existed last night.

Through pure accident, BHH set his screens up so that the Big Bamboo signals will arrive without the system resetting nightly. What that means is that the system could be tweaked to take 2 more signals tomorrow, to give it the max 4 positions. To be clear, there are still signals leftover from last night, that were not acted upon, and without the reset, the system would be buying 2 more tomorrow.

Of course we didn’t back test the Big Bamboo to take signals that were leftover from the previous day, assuming the correct conditions still exist the next day. We did run some quick tests this evening, and it really doesn’t change much to get rid of the reset. It actually improves the CAGR, slightly decreases the average trade %, and increases the drawdown by about 1.5%.

As the system is often in cash and should theoretically perform better with more opportunities, it might make sense to take away the reset feature in future versions. For now, I will leave the Big Bamboo the way it is.

For the record, the next 2 signals are to buy SKF and SRS on the open. I am going to purchase one or both of them tomorrow in my personal account, but will not track them in the spreadsheet.

What is the Benefit of The Reset Function?

Simply put, the reset function keeps the system from going all in at exactly the wrong time. Once 2 positions are entered, the conditions that created the edge must disappear, and then setup again in order for more signals to be generated. This helps to ensure that the system does not end up going all in at the onset of a period of sustained strength, or weakness (remember, the Big Bamboo goes both ways).

My intuition is telling me that the markets could be making an attempt to sustain a rally. As the Big Bamboo is only half in, it would be no big deal if the rally does continue, stopping both trades out. However, if the existing positions do not stop out, and the edge re-appears, then and only then will the system go all in with the final 2 positions. In effect, the system will use up to half its cash, then look around and survey the market landscape before deploying the rest of the cash.

Comments »

Big Bamboo System Issues Short Signals

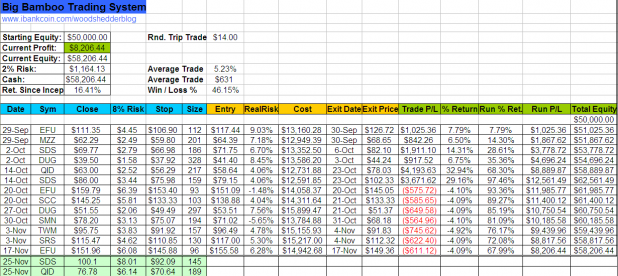
Highlighted above in a pleasing green hue are the two system picks for the Big Bamboo. For the uninitiated, these diETFs are to be bought on the open. We will exit these positions the morning after RSI(2) closes above 80.

I have decided to begin tracking the system with an 8% stop and 2% at risk, instead of the 4% stop and 1% at risk. Recent volatility has made the 4% stop too tight. Had an 8% stop been used from the beginning, the system would be at a 77% win rate.

Those that have been following this system are aware of the work we have done on the stops, and other metrics. We are still working on stops that adapt to market conditions. I encourage those who are new to the Big Bamboo to check the archives, located here: Big Bamboo Archive. The archives have some cool posts such as equity curves for different stops and position sizes.

I have also updated the spreadsheet to be color coded. The light blue headings are for the pre-entry calculations, the yellow headings are for the post-entry calculations, and the green headings cover the calculations that happen post-exit.

__________________________________________________________________________________________________

There are more picks for tomorrow, but the system will only take 2 a day, while holding a maximum of 4 positions. It will always take the top two most liquid diETFs, of all the choices.

Obviously, the system is looking to catch a pullback. Whether it materializes before the stops are hit is anyone’s guess. I will be taking the signals on the open, but I’m not sure yet about how much I’ll risk, or what type of stop (ATR or %) I’ll use.

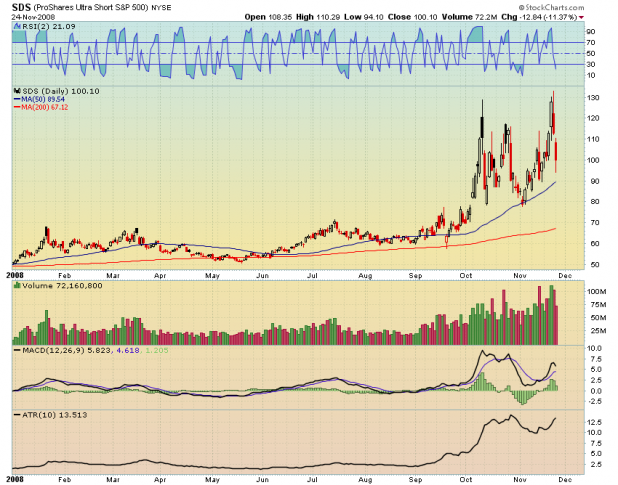
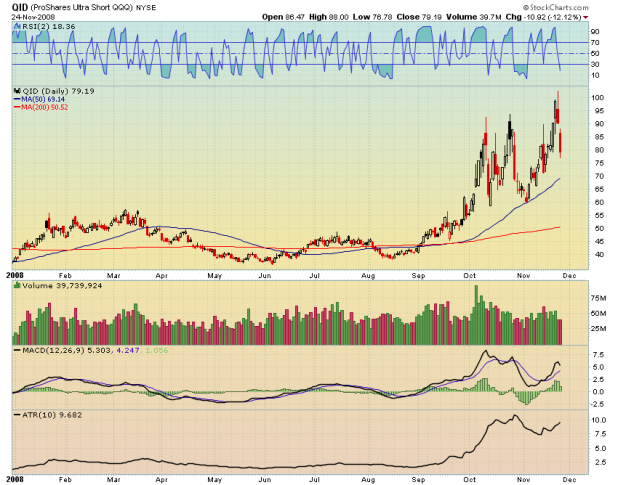
Volatility is still running extremely high on these diETFs. For example, 1 ATR is equal to 12%, for QID. In other words, the QID daily average true range is spanning 12%. A more conservative stop strategy may choose to use an ATR multiple stop. Backtesting shows that 1.25ATR performs well.

Charts are included. I have added an ATR(10) indicator in case anyone wants to experiment with ATR stops.

[[SDS]]

[[QID]]

Comments »

Gold At Technical Crossroads

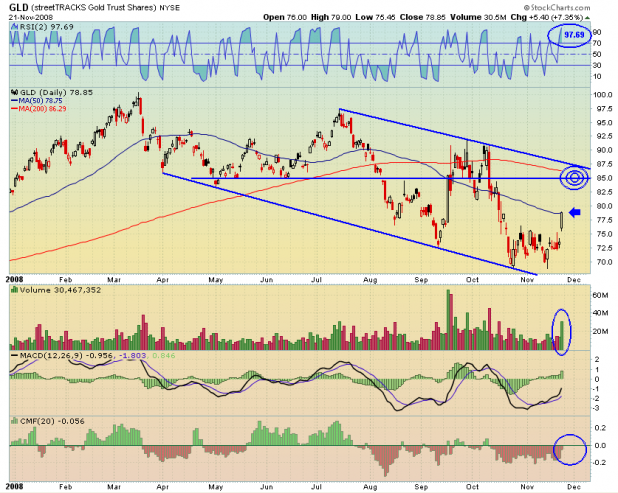
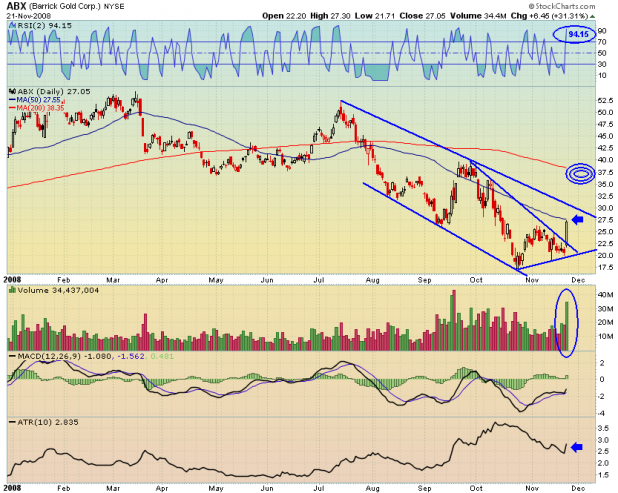
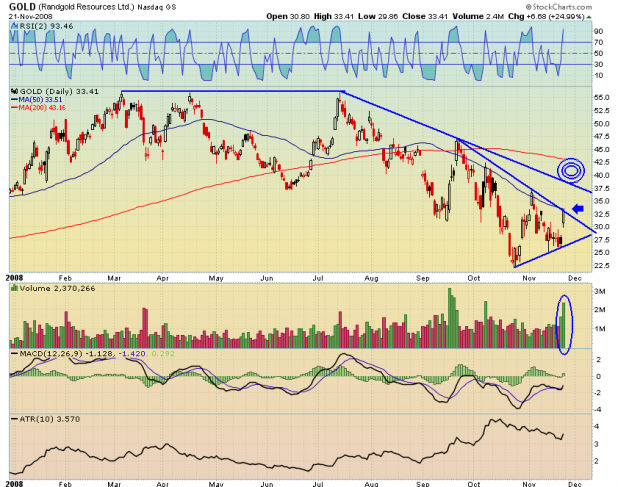
The movment in gold and related stocks was all over the news Friday. Friday’s gains finds that a wide range of gold and gold mining stocks are hitting the top of their declining channels, or are meeting the 50 day average, from beneath. The majority of their RSI(2) readings are near levels associated with reversals.

On Friday, the volume and ATR multiples were large, which is bullish. However, these stocks are just coming off a bounce from the lower channel lines. Technically, they are very much still in a downtrend. Gold stocks need to continue rallying above the 50 day moving average, and above the upper channel lines.

On the chart above of [[GLD]] , should the ETF be able to rally above its 50 day average, I’ll be looking for strong resistance near $87.50, which is the top of the declining channel and also the falling 200 day average.

Barrick Gold Corporation (USA) [[ABX]] is a top-ranked miner. Everything about this chart is similar to GLD. To break the downtrend, ABX needs to rally above the 50 day line and the upper channel boundary. Beyond those crossroads, I will look for resistance near the falling 200 day average.

[[GOLD]] is also similar to GLD and ABX. Progress Friday was also halted at the 50 day average. GOLD has lots of immediate resistance to clear before reaching for the 200 day simple moving average.

Gold and related stocks are showing promise of breaking out of their downtrends. The major moving averages as well as overhead resistance, whether in the form of declining upper channel boundaries or falling upper resistance lines, should be watched closely. Failure at these areas may mean that gold resumes the downtrend.

The targets I’ve provided would be appropriate for short-term and swing traders. If you are buying gold for a long-term hold, I would watch and see how gold behaves at these resistance levels. It may be possible to pick it up cheaper than Friday’s close.

For other perspectives on Gold, be sure to check out ZenTrader and Upside Trader.

Comments »

Gap Studies…Where’s the Edge?

As I write this, S&P Futures are up 2.81%. I think today’s gap is a good opportunity to review where an edge can be found during these types of moves.

The best resource I know is Rob Hanna’s blog. I’m including the link to all of his gap studies. I recommend scrolling through and reading them, as I believe they really help one determine where the edge is during a move like we will see this morning.

Rob Hanna’s Gap Studies

Comments »

The iBC Traffic Indicator

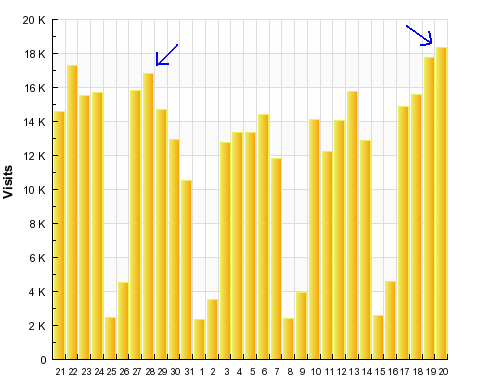
Today will see the iBankCoin website log the most one-day traffic in its history. When this screen shot was made, there were approximately 3 hours left in the day. The site may see 20K visits today.

Previous spikes in site traffic have coincided with bounces, which follow the spike.

Since I do not have administrative privileges for Site Meter, I can’t say what the spike was like on October 17th (the last date of the October plunge), but I would bet that the site experienced more traffic than ever before on that date, much as it has today. Maybe Jeremy or the Fly can chime in with the traffic stats for that date.

We’ll find out tomorrow if site traffic remains an accurate contrarian indicator.

Comments »