iBankCoin
Joined Nov 11, 2007
1,458 Blog Posts

Depressed Relative Strength: Bulls Have the Edge

In the previous post Floating Relative Strength: Bears Have the Edge, we examined the results from a study which had one selling short the SPX next open anytime RSI(2) closed greater than 90 for 3 days in a row. The study also showed the results for buying the SPX anytime RIS(2) closed greater than 90 for 3 days in a row.

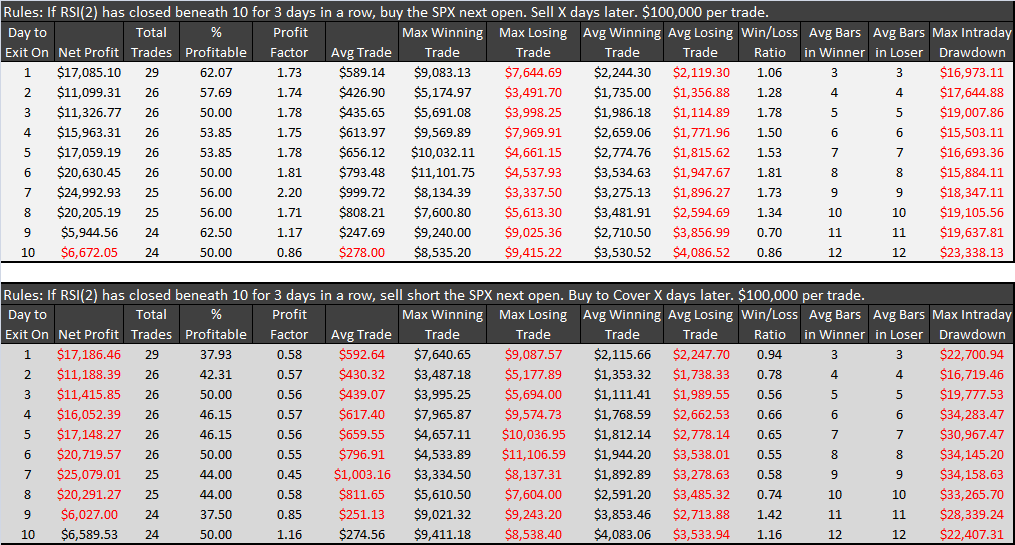
The current study will examine the opposite of the previous one. Anytime RSI(2) closes beneath 10 for 3 days in a row, one will buy the SPX next open. We will also look at the opposite side which is to sell short the SPX after the entry criteria is met.

As expected, the contrarian purchase after a depressed RSI(2) has the edge. Selling the opening of the 8th day yields the highest net profit.

On the short side, one would have to suffer for at least 10 days after the entry in order to see any positive expectancy.

The measure “Day to Exit On” is calculated in a way that might be confusing. The buy/sell short is made at the open of the day following the 3 days of depressed RSI(2). The day of entry is treated as day 0. The next day is treated as day 1. The trade is sold on the next open, following the Day to Exit On. If the Day to Exit On is day 0, then the trade is sold on the next open, which is really the open of the 2nd day, counting the entry day. Hence, Avg. Bars in Winner is calculated at 2.

It may be worth noting that this setup has had 11 fewer trades than the opposite setup, which is 3 days of RSI(2)>90. This is likely due to the upside bias of the markets.

Finally, the SPX is showing an RSI(2) reading of 12.22

The Market Rewind Blog has a similar study published here: RSI Mon Sez – Falling RSIs, Think Ahead! This study shows immediately higher odds of a next day gain after a depressed RSI.

Comments »

Handpicked Hot Charts

I’ve included some breakouts, pullbacks, gaps-off-bottoms, and some fixin’-to breakouts. There is likely something for everyone.

I considered looking for some bearish charts as well, in case the market responds unfavorably to the employment report tomorrow. Then I remembered I hate looking at breakdowns.


Comments »

What A Release!

After putting on my initial short SSO position Friday, and then doubling it on Monday, today’s action was quite a relief. I was starting to imagine how it would feel to have my first two trades of the year get stopped out. Instead of relinquishing control and giving in to my fear and emotions, I took another system trade this morning, shorting DIG at the open.

Both SSO and DIG shorts will be covered at Thursday’s open.

As for where the markets stand…The indices are nearing a good spot to put on some dip buys, but they are not quite oversold enough for my tastes. I’ll take my fat tomorrow and leave the lean for someone else.

This doesn’t mean we can’t rally from here. It just means I don’t see any discernible edges, long or short, except for an opportunity to play a technical bounce from the 50 day moving average.

I’m not going to over-analyze things here. Today was a heck of a release after quite an intense buildup. I’m just going to enjoy the afterglow.

I do not want to leave anyone unsatisfied though, and so I want to leave a link to a really nice piece from the Market Rewind blog. It dovetails rather nicely with my post last night on RSI.

RSI-Mon Sez Pullback Was Overdue

Comments »

Floating Relative Strength: Bears Have the Edge

Of particular interest to those who trade with signals provided by RSI(2) is the tendency of the measure to portend a reversion to the mean. When RSI(2) crosses an upper threshold, it is often a signal to close longs or to sell short. Similarly, when it crosses a lower threshold, it is often a reliable signal to cover shorts and initiate longs.

What makes trading RSI(2) exciting is that when markets begin trending, rather than reverting to the mean, RSI(2) will often stay elevated, or depressed, for extended periods of time. When it stays elevated, it appears to me that it just floats for days at a time, not really moving up or down. Unfortunately, a floating RSI(2) can be painful when one was expecting a quick move in the opposite direction. I know the last 3 days have been painful for me, as I’ve been net short the S&P 500.

I decided to take a look at any edge this setup might provide. What I tested was going long or short the SPX after RSI(2) closed above 90 for 3 days in a row. The test then closed the trade out X days later.

 I was rather embarrassed after I completed the study to realize that today the SPX just missed having its RSI(2) close above 90 for a third day in a row. RSI(2) closed at 88.07 It is probably close enough to still make the study applicable to the next few days of trading.

Results are below and cover 10 years of data for the S&P 500.

The top sheet shows the results for going long the SPX after the setup, and the bottom sheet shows the results of shorting after the setup.

It appears that the Bears have the edge over the next 8 days, with the next 3 days showing a good likelihood of a pullback.

There are a few other metrics that should be of interest. I particularly find the difference between the drawdowns to be significant. Also, the profit factor for the shorts is roughly 4x that of the long side.

Caveats:

After 10 days, the longs start working much better and show good net profits which peak near the 25th day.

Had I looked back another 30 years or so, the long trade would have out-performed the short side, even over a shorter time frame. RSI(2) did not always work well as a mean-reversion measure.

__________________________________________________________________________________________________

I included the chart of DIG as it shows an excellent example of a floating RSI(2).

Comments »

Big Bamboo Update

After going into hibernation for over a month, the Big Bamboo is close to giving signals, on the long side.

The system has been waiting for a discernible trend in order to begin trading again. While it is not certain that the current trend will be maintained, the Bamboo is waiting for a pullback, before getting long. If it deems the pullback is orderly and not too brutal, it will start trading again.

Personally, I can hardly wait to see how it performs in an uptrend.

Comments »

Close Out MAXY Trade

In the post The Return of Strategy Trading I presented an entry and exit setup from a system that performed reasonably well throughout 2008.

The chart above shows the entry day. The rules of the system dictate closing the trade tomorrow, on the open. As this stock can open without a great amount of liquidity, I might suggest holding off a minute or two before placing the sell order. A limit order might work as well.

If one was able to get in MAXY as suggested at the open on Wednesday, December 31st, and can exit tomorrow near $9.00, the percentage gain will be roughly 5.5%

Comments »

2008 Year in Review: Part 2

After finishing my accounting for 2008, I will have to amend my numbers a tad from where I reported them in Part 1.  Take the report for what it is: not audited. The results include all commissions, charges, and platform fees. 

In May, I split my account in half, using one-half for only system trades and the other half to trade as I see fit. In 2009, these accounts will again be combined to only trade mechanical systems.

What Worked in 2008

  • I will always remember 2008 as the year of Reversion to the Mean. The system that I traded almost exclusively (except for 3 trades) in my system account is a mean reversion system. The metrics posted in Part 1 are a testament to how well these types of systems performed.
  • Strategy Development: With a lot of my own work and the help of other bloggers such as Damian, Michael, Brandon, and Rob, I was able to develop 6 mechanical systems. These systems are all due to be deployed in 2009.
  • Covestor: Registering with Covestor was an important development as it allowed me to demonstrate (we’ll call it auditing-lite) the performance of one of the systems as well as increase public interest in my blog and the systems.
  • Rhythm: In 2008 I finally hit a nice rhythm where I was able to balance the demands of working full time, blogging, trading and developing systems, and having a family. Credit to that goes to trading mechanically for most of the year as it required less time and emotional input than a discretionary approach.
  • Volatility Stops: I’m not going to expound on them right now, but these are the ultimate survival tool in markets like those we saw in the first three and last three months of 2008.
  • Position-Sizing: Again, no need to expound here, but effective position-sizing was the other key to surviving (and profiting) from 2008.

What I Could Have Done Better in 2008

  • More Risk!!! I should have taken on twice as much risk per trade. Almost all trades in 2008 were sized to lose .5% of total capital. In hindsight, it seems ridiculous, with a system that was right more than 75% of the time, that I didn’t risk more in each trade.
  • More Opportunity: As the indexes dislocated themselves daily, the systems began providing fewer and fewer opportunities. As Opportunity x Expectancy = Profit, fewer opportunities, coupled with too little risk, resulted in performance that was 1/3rd of what it could have been. In hindsight, I should have loosened the parameters of some the systems. This would have theoretically lowered expectancy. However, expectancy would still have been positive, and more opportunities in the volatile environment would likely have made up for the decrease in performance.
  • Lower Commissions: Unless you are trading a size that benefits from a flat fee per trade, per share commissions are the only way to go. I will not go through 2009 paying a flat fee per trade. Per trade commissions alone subtracted better than 2% from my total return.
  • Stupid Discretionary Trades: Even as I realized that I was failing as a discretionary trader, I continued to make some discretionary trades. This was not healthy for the account and has been discontinued for the foreseeable future.

New for 2009

  • Full 3rd Party Auditing on all master accounts and likely on individual strategies.
  • Better and more comprehensivetesting of ideas on the blog. I’m looking forward to having more time to spend looking at the strategies that other bloggers such as RipeTrade and BZB write about.
  • More live system tracking, similar to what I’m doing with The Big Bamboo.
  • Developments in scalability on some of the strategies.
  • A formal partnership and trading business, Algorithmic Capital, LLC. (More on this in the near future).

I have a distinct feeling that 2009 is going to be a very good year. To all the iBC bloggers and everyone else, I wish you the best and most prosperous year yet.

Comments »