The World Bank is out with its forecasts tonight, projecting grave deflationary pressures to persist in the commodity markets, despite all of the inflationary boogeymen under Janet “Grandmother” Yellen’s bed.
They’re slashing projections on all major commodities, especially harsh on fossil fuels and metals. They’re projecting $37 crude and a staggering 80% drop in U.S. shale production over the next two years, while maintaining very modest drops for OPEC members.
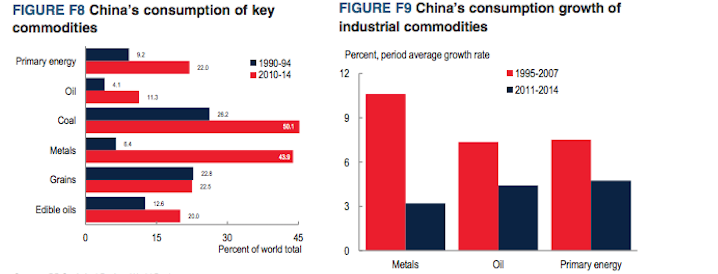
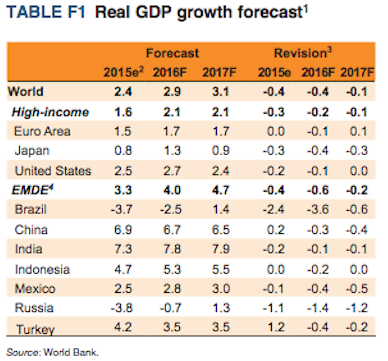
Naturally, it’s all about China.
Energy prices are expected to fall 25 percent from 2015, with oil prices projected to average $37/bbl in 2016 (a downward revision from $51/bbl forecast in the October 2015 Commodity Markets Outlook). From their current lows, however, a gradual recovery in oil prices is expected over the course of the year for several reasons. First, the sharp oil price drop in early 2016 does not appear fully warranted by fundamental drivers of oil demand and supply, and there may be some rebound in prices. Second, higher-cost oil producers are suffering losses, which could bring production cuts that off set additional capacity coming to the market. Third, demand is expected to strengthen somewhat with a modest pickup in global growth (Figure 2). Significant downside risks to the energy price forecast include higher-than-expected output from OPEC producers that prolongs the surplus in the global oil market, particularly if accompanied by weaker demand from emerging market economies. On the other hand, higher prices could result from supply disruptions among key OPEC producers mostly because of conflict.
Looking ahead, U.S. shale oil production could drop off sharply. Output from shale oil wells declines rapidly, falling by some 70 percent or more in the first year and more than 80 percent in the first two years. This requires substantial drilling to offset the shale’s rapid declines. While efficiency gains and technical innovation are expected to continue, future improvements may be more difficult. For 2016, overall non-OPEC production is expected to decline by 0.6 mb/d. The U.S. Energy Information Administration projects that U.S. crude oil production declines from 9.3 mb/d in the fourth quarter of 2015 to 8.5 mb/d in the fourth quarter of 2016. For 2016 as a whole, total U.S. production is projected to decline by 0.7 mb/d, with output in the lower-48 states falling 0.8 mb/d, partly offset by an increase of 0.1 mb/d in the Gulf of Mexico. Non-OPEC production outside the U.S. is expected to fall by 0.1 mb/d, with small declines in most regions only partially offset by increases in Canada and Brazil of more than 0.1 mb/d each.
The anticipated oil price recovery is forecast to be smaller than the rebounds that followed sharp drops in 2008, 1998, and 1986. In these declines, prices rebounded from their troughs by around 50 percent within about five months, and approximately doubled after 12 months (Figure 8). In 1998 and 2008, significant OPEC production cuts contributed to the price recovery, while in 1986 OPEC sought to regain its market share— somewhat similar to its current intent on defending its share. The currently expected price recovery over the course of 2016 is less than that in the previous episodes owing to large stocks and prospects for continued ample supplies (including from OPEC) and anemic demand. On balance, the price outlook remains subject to considerable downside risks. These include a larger-than expected increase in Iran’s exports and a possible recovery of exports from Libya. Short-cycle U.S. shale production may again turn out to be more resilient than currently anticipated if companies achieve further productivity gains. Ample supply would particularly weigh on prices if global demand were to also weaken more than expected. Prices may thus have to fall further to reduce production and investment, especially for short-cycle U.S. shale production. Upside risks include sharper-than-anticipated nonOPEC supply declines and slow expansion of exports from Iran. In addition, there are risks of disruptions among key OPEC producers mostly because of internal conflict. Higher-than-forecast global demand would also help reduce the stock overhang.
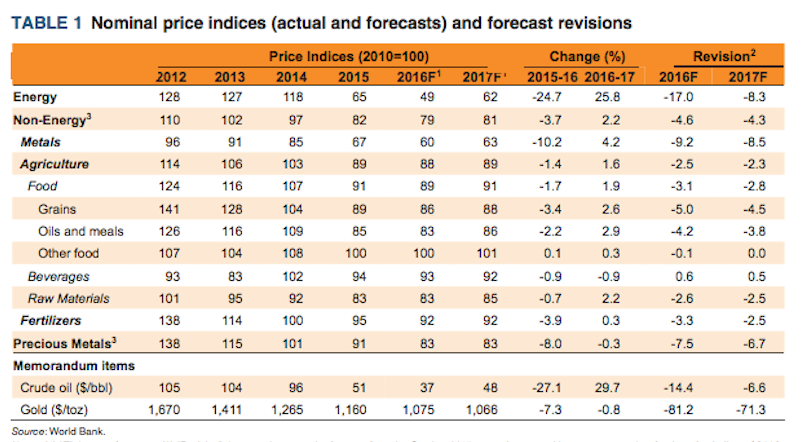
Coal prices are expected to decline 13 percent in 2016 to $50/ton, on continued weak demand and oversupply.
Natural gas prices are projected to fall in 2016, led by large declines in Japan (-19 percent to $8.5/mmbtu) and Europe (-17 percent to $6.0/mmbtu), on continued surplus supply and further competitive pressures on oil-linked import contracts. Gas prices in the U.S. are expected fall by 4 percent to an average of $2.5/ mmbtu, but are up from recent lows due to continued strong growth in demand, rising pipeline and LNG exports, and slowing production growth. Risks are mainly to the downside, however, given a global supply surplus and the resilience of production in the United States.
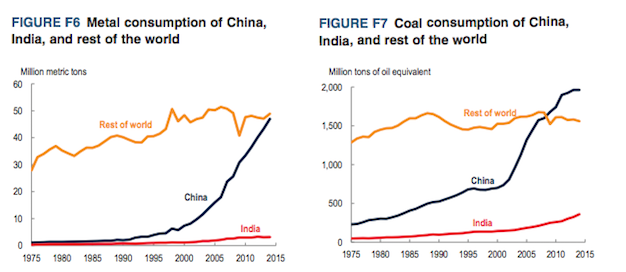
Metals consumption remains relatively weak in emerging market economies, particularly in China’s metals-intensive manufacturing and construction sectors. China’s share of global metal consumption rose above 50 percent in 2015 (Figure 22); the country has accounted for the most of the world’s growth for all major metals over the past 15 years (Figure 23). As the economy rebalances from investment to consumption, and from industry to services, metals demand is expected to slow. On the supply side, a number of production cuts have been announced to help stem oversupply. Reductions will be partly offset by increases in new capacity coming on-line from the large investment cycle that peaked in 2012. Chinese producers have also agreed to cut refined metal production at copper, nickel, and zinc smelters. Further mine closures are expected this year, as prices remain well into the cost curve for many metals. However, significant cost reductions (notably for energy), producer currency devaluations, and other considerations (such as high shut-down costs) are delaying the winding down of high-cost capacity. Figure 21 Metal prices, monthly Source: World Bank. Note: Last observation is December 2015. Figure 22 Refined metal consumption of key regions and countries Source: World Bureau of Metal Statistics. Note: Total of aluminum, copper, lead, nickel, tin, and zinc. Iron ore prices plunged 15 percent in the fourth quarter—down eight consecutive quarters and now barely one-fourth of the high reached in 2011—on continued oversupply, weak demand from the steel producing sector in China, and destocking of iron ore at Chinese mills. New low-cost iron ore capacity continues to come on-line in Australia and Brazil, and is forcing closures of higher-cost mines in China and elsewhere. Other capacity has been temporarily idled or curtailed, and some projects are ramping up at a slower pace than planned. In addition, a tragic tailings dam collapse at Brazil’s Samarco mine has caused the indefinite closure of annual production near 30 million tons (2 percent of total seaborne supply). Global seaborne iron ore demand may be nearing a peak due to China’s transition to a less-metal intensive economy, and as a result of rising scrap metal availability. More low-cost iron ore capacity awaits development in Australia, and will continue to displace high-cost output in other areas.
If you enjoy the content at iBankCoin, please follow us on TwitterMetals prices are projected to decline by 10 percent in 2016 due to slowing demand in emerging market economies (especially China), and increases in new production capacity. Iron ore prices are projected to decline most (down 25 percent), due to reduced imports from China’s steel producers and new capacity in Australia and Brazil, followed by nickel (down 16 percent) and copper (down 9 percent). Most other prices are also expected to fall, as markets remain well supplied with elevated stocks. Markets are expected to tighten in the medium term due to reduced investment in production capacity, stronger global demand, and some specific factors, including the continued impact of Indonesia’s ore export ban and closure of large zinc mines due to exhaustion. Downside risks to the forecast include slower demand in China and higher-than-expected production induced by cost reductions and currency depreciations in producer countries. Upside risks are centered on stronger global demand growth and supply shortfalls from project delays and disruptions, falling ore grades, environmental constraints, higher costs (such as for energy), and accelerated closure of high-cost capacity.


More like .37 crude, lol.