Our sector oscillator in Exodus is the mean of all the technical ranking scores of the underlying sector. In this case, we’re examing the basic materials, which encompasses everything from copper to gold to oil to chemicals. The chart is below and all instances of outlier events, based off the chart, are listed below — accompanied by the share price of $XME at the time of the event and 5 days afterward.
Based upon all events over the past year in basic materials, trading solely off Exodus yielded a 90% win rate — the last of which was just flagged on Friday.
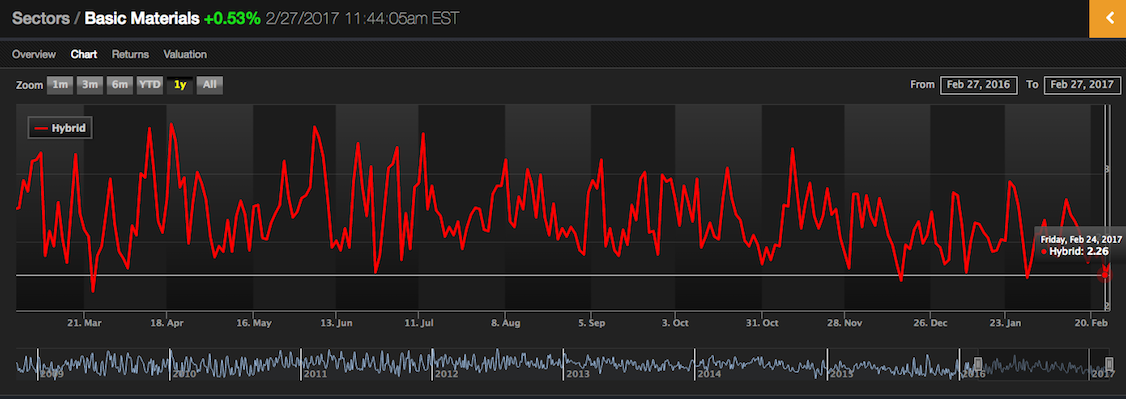
2/24/17: 2.26
price $32.33
1/30/17: 2/24
price: $33.27 (5 days later) –> $34
1/09/17: 2.28
price: $31.37 (5 days later) –> $32.32
12/15/16: 2.22
price: $31.90 (5 days later) –> $31.07
11/29/16: 2.31
price: $30.99 (5 days later) –> $33.11
10/31/16: 2.34
price: $25.41 (5 days later) –> $26.43
7/5/16: 2.37
price: $24.41 (5 days later) –> $27.20
6/28/16: 2.28
price: $22.66 (5 days later) –> $25.06
4/5/16: 2.31
price: $19.98 (5 days later) –> $21.64
3/23/16: 2.14
price: $19.45 (5 days later) –> $20.29


The gold stocks may be oversold but their relative strength vs the actual metal itself has not been good the last several weeks and that has usually been a sign of at least a downdraft coming soon in the metal.
Is steel ok fly?