One of the things I’ve mandated with The PPT 2.0 is for it to be very visual, aesthetically pleasing. I love the current version and consider it my 4th child, but this new version blows it out of the water.
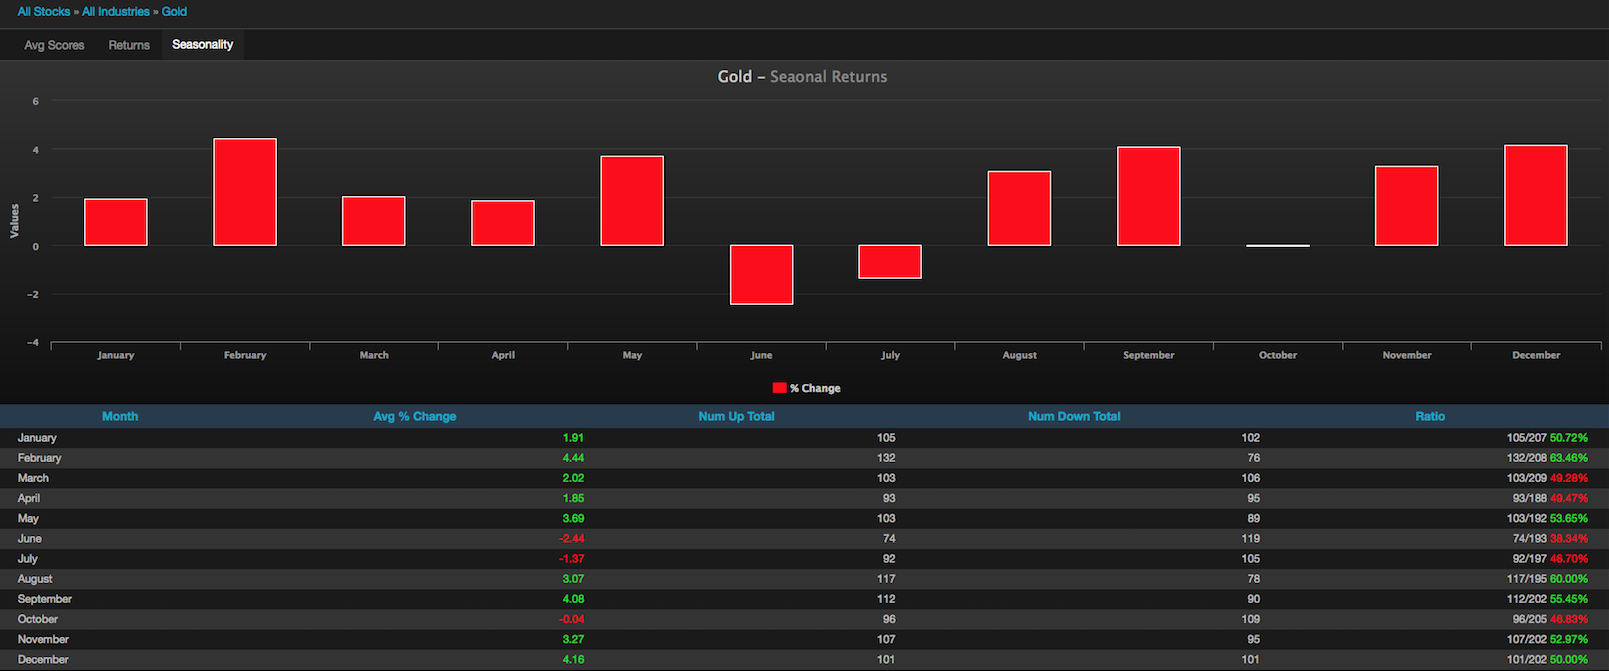
Before you sell all of your stocks and chase that gold and silver stock that is already up 25% for the year, look at the above chart. Understand what it means. Do not base your macro-trade analysis off of it; but consider it useful insight into the seasonality of gold and silver and how it trades down nearly 70% of the time, over the past decade plus, in the month of June.
If you enjoy the content at iBankCoin, please follow us on Twitter


this time will be different, Jake the Gint was overheard saying from toilet stall #4 at Heathrow Logan as he boarded a Boeing to head back victorious after concluding another deal under the Obama administration. His 29th during his tenure.
Toilet stall #4? I was in toilet #3! They be after me dubloons. Arrrgh…
http://www.judicialwatch.org/press-room/press-releases/judicial-watch-new-documents-show-irs-hq-control-tea-party-targeting/
Doh! 😮
WHAT A RIDE TODAY!!
Added
To
AUY
I got lucky after hours yesterday and filled at 8,15
oops 7,15
Gold and silver stocks are for losers.
Very last year with that opinion, but it is funny.
Tell that to my 3% GAIN..BABY!!!
Everything is great. The bond formerly known as a growth company(CSCO) is up in post market. Now take a nap or go see a doctor for no apparent reason.
Good Dr.
Thanks.
Whatever Fly!!!
*snuggles with NUGT calls*
Where’s Pops tonight?
*kicks NUGT calls to curb* Good thing that was a small % of portfolio YOLO buy.