“As most of us can remember that Iceland was the first country that went down during the last Global Financial Crisis in 2008. During that time Iceland had done something remarkable and that is during the five years prior to the crisis, managed to transform its economy from a fishing industry to a mega hedge fund country. Many of its citizens left their traditional trade which is fishing to become fund managers and salesman. As a result Iceland’s banking assets (physical assets + Loans + Reserves + Investment securities) grown to more than 10x its GDP of $14 billion. With such high leverage, when the financial crisis struck it is unable to defend its economy and hence its house of cards collapsed.
The purpose of this article is a post-event analysis of the performance of the Icelandic economy that refuses a bailout as compared to Greece which went for a bailout with the injection of funds from Troika. To simplify matters, we shall coin the bail-in and bail-out as (BIBO)for short. Of course in the short term it helped stabilized the Greek economy for a while but we want to know to what extent it had transformed the Greek economy in the long run with the accompanying terms and conditions and austerity measures. In this article we shall compare the performance of both the economies of Iceland and Greece with the economic indicators or metrics below from the year 2002 to the present. We believed we have been fed with too much toxics by the mainstream medias which are also own by them that capitalized on the age old investment axiom of good-to-good.
Does Government do what’s right for us?
We have led to believed or should we say brought up with the perception that when someone does well then he/she will be blessed in return. Hence it gave rise to an old age investment axiom of good-to-good and bad-to-bad reaction which can be translate to good action leads to good reaction. So we always believed that whatever our Government does it will be for the better of us. So when they bailed out the banks, we believed that they are doing the right thing and we should leave everything in their good hands and expect good reaction. Right? WRONG ! We shall show you on our analysis below that whatever our Government does is not necessary the right thing to do. We have based our analysis on the following indicators or metrics.
- GDP per Capita
- Inflation rate
- Balance of Trade
- Government Debt to GDP
- Government 10Y bond
- Government Spending
- Consumer Spending
The following is a review of the Icelandic economy which not only refuses a bailout of its banks but instead bankrupting them. They are taking a big risk to take things into their own hands instead of letting the bankers running their country. They are going off the beaten path and from our analysis we reckoned that they have done the right thing. Below we compare the economies of two different countries that have taken different paths – one that receive bailouts (Greece) and the other (Iceland) refuses bailouts. The first metric we are using is the GDP per Capita.
- GDP Per Capita ratio
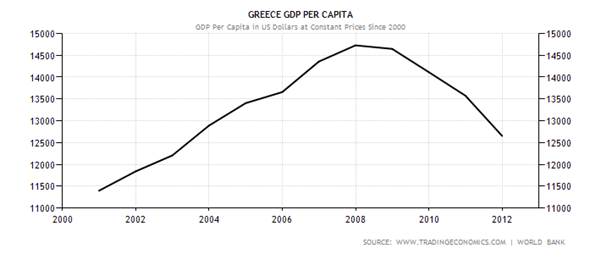
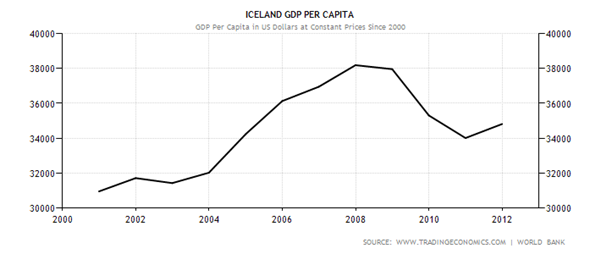
The first metric that we are going to compare is the GDP/Capita ratio. GDP/Capita also shows the standard of living of a particular country and a higher ratio normally denotes a higher standard of living. As you can see from the charts 1a & 1b below Greece seems still to be on the plunging mode and somehow there seems to be no slowing down in sight and hence a floor has yet to be set. Whereas Iceland seem to be going on a firmer footing when its GDP/Capita ratio seems to be stabilizing around 2011 and it seems to be on the uptrend. Iceland’s current (2012) ratio seems to be heading back towards the 2006 level whereas Greece’s is heading backwards to the 2003 level.
Chart 1a & 1b (GDP Per Capita)
- Inflation Rate
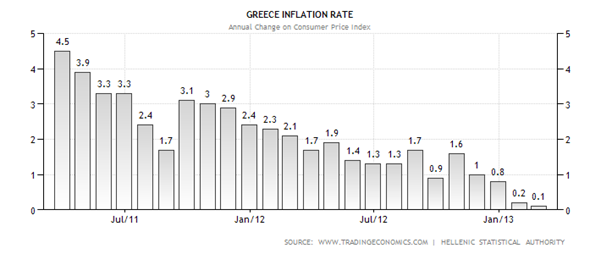
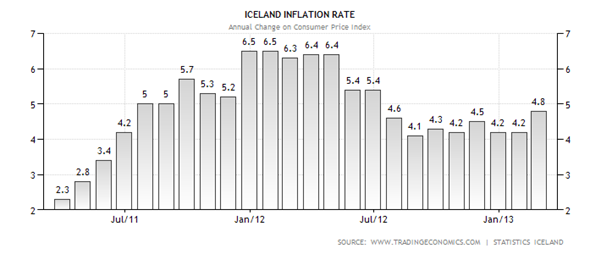
The second metric is the Inflation rate. From Chart 2a below it seems like Greece’s might be facing the risk of a deflationary spiral as happened to Japan in the 1990s. Its inflation rate has fallen from 4.5% in April 2011 to 0.1% in February 2013. Once the economy sets it path on a deflationary mode it is very difficult to reflate it back to the preferred long term inflation rate of 1-2 % above zero. Japan will be a good example when its economy was gripped by the deflationary forces since the 1990s, eventually it ended with 2 lost decades of growth. Only recently newly elected Prime Minister Mr Shinzo Abe is committed to reflate Japan’s economy at any cost. On the other hand Iceland’s inflation rate is now at 4.8% which is hovering around the mean of (4.7%) for the past three years and considered to be manageable and essential for economic growth.
Chart 2a & 2b (Inflation Rate)
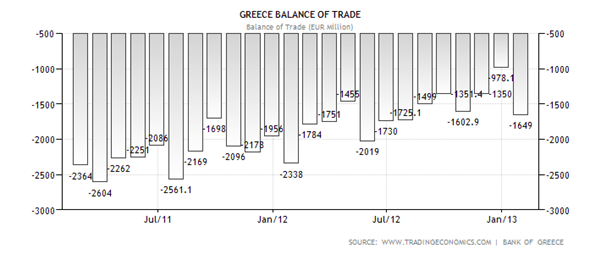
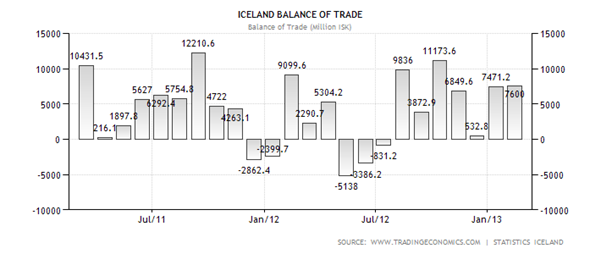
- Balance of Trade
The third metric is the Balance of Trade which is also can be defined as difference between the exports and imports in monetary terms. From Chart 3a it is very obvious that Greece has been running trade deficits for the past 24 months consecutively. Negative trade deficits means there is a net outflow of money from Greece. This means that Greece may need to borrow more in future in order to finance its government expenditure and hence will incur more debts in its coffer. As for Iceland it is a different story where out of the 24 months 19 of them are experiencing positive balance of trade. Positive balance of trade means positive net inflow of funds and hence it enable the Icelandic government either quicken their repayment of debts or embark on new government fiscal expenditures without resorting to more borrowing.
Chart 3a & 3b (Balance of Trade)
- Government Debt/GDP
Next is the Government Debt/GDP ratio or the total amount a country has as in percentage of its GDP. It seems that Greece’s Debt/GDP ratio is currently way above 100% and as of end of 2012 it at 161.6%. A high Debt/GDP means more funds are needed for interest payments and hence less will be available for development. We will foresee this trend will extend much further into the future because 1) its ratio is still considered dangerously high and 2) many of its economic indicators are still recording negative readings and hence may dampen its ability to quicken its repayment schedule….”
If you enjoy the content at iBankCoin, please follow us on Twitter
