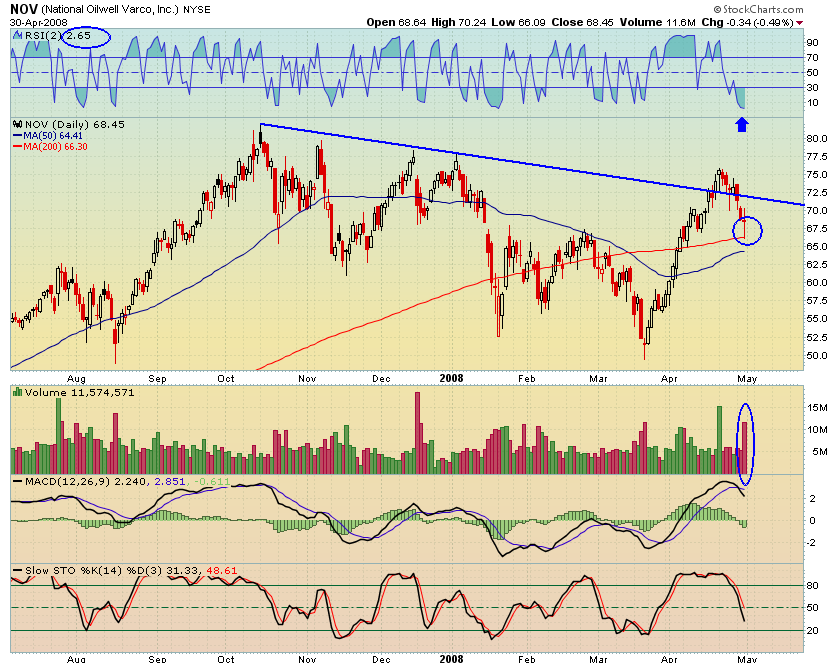
Both these stocks are cheap, with PEGs near .35, and have pulled back to support. [[NOV]] released earnings today.
UPDATE 2-National Oilwell Varco 1st-qtr profit up 44 pct.
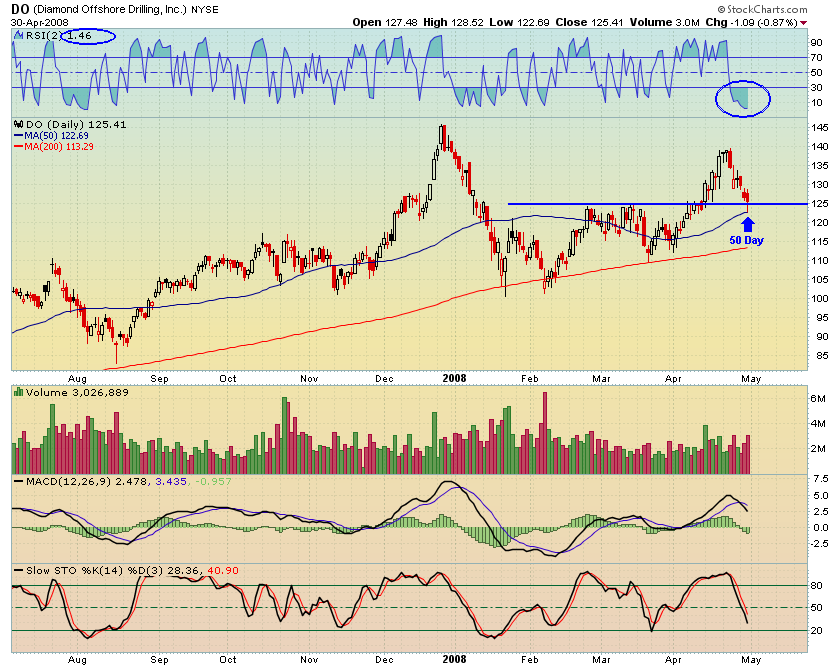
Both stocks closed up in the after-hours market.
Comments »
Both these stocks are cheap, with PEGs near .35, and have pulled back to support. [[NOV]] released earnings today.
UPDATE 2-National Oilwell Varco 1st-qtr profit up 44 pct.
Both stocks closed up in the after-hours market.
Comments »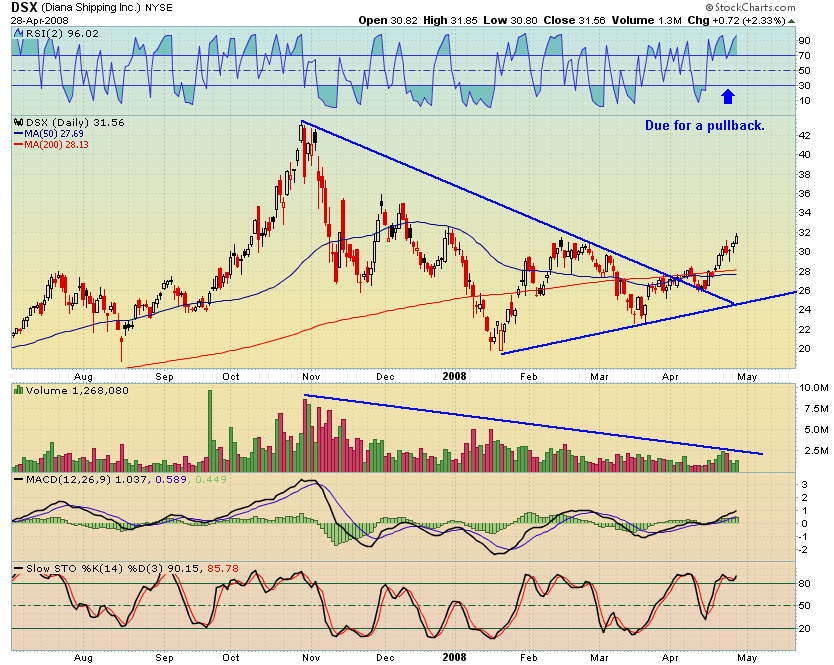
Diana Shipping is beginning to work on the right side of a huge base. While the stock is due for a pullback, should the uptrend resume after a pullback, we want to see volume swell on the up days.
Should DSX form a base and breakout, I believe the move could easily produce a double from here.
Comments »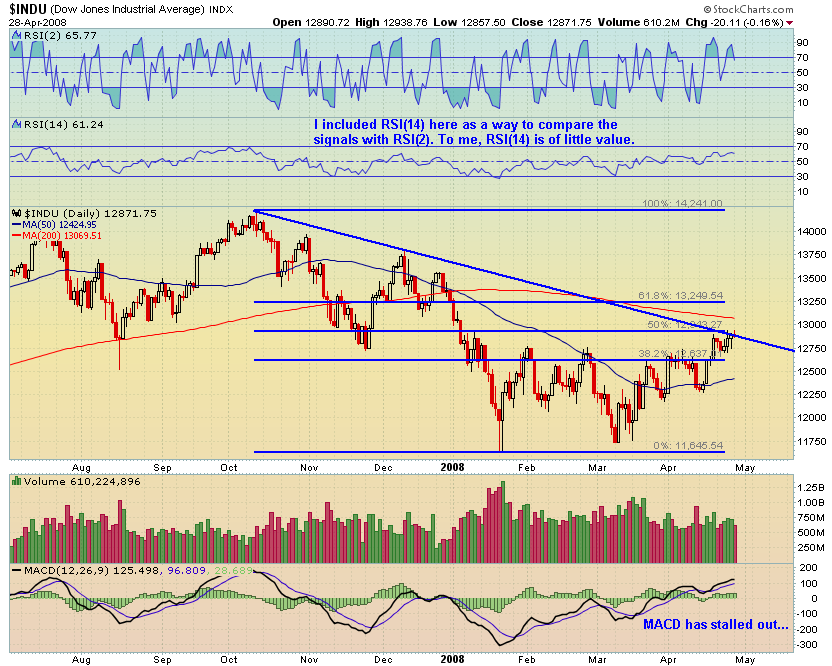
My targets for the indexes, as outlined numerous times, have almost been reached. Momentum is slowing here, and the indices are overbought. However, the trend has not turned, yet. Hopefully you are taking some profits, and considering putting back on some short positions in stocks that are overbought.
I included the Fib lines on the Dow Jones chart above to show that the Dow has retraced almost exactly 50% of its move down. I think this provides a good exit area for traders and fund managers who are still worried about the fundamentals of the economy.
I included the RSI(14) for Big Mike. Mike, you’ll see that RSI(2) works well over an average swing trade timespan of a few days to a month. I really can’t make much sense of RSI(14), and I’ve read that it has no statistical edge, but your mileage might very with that particular indicator.
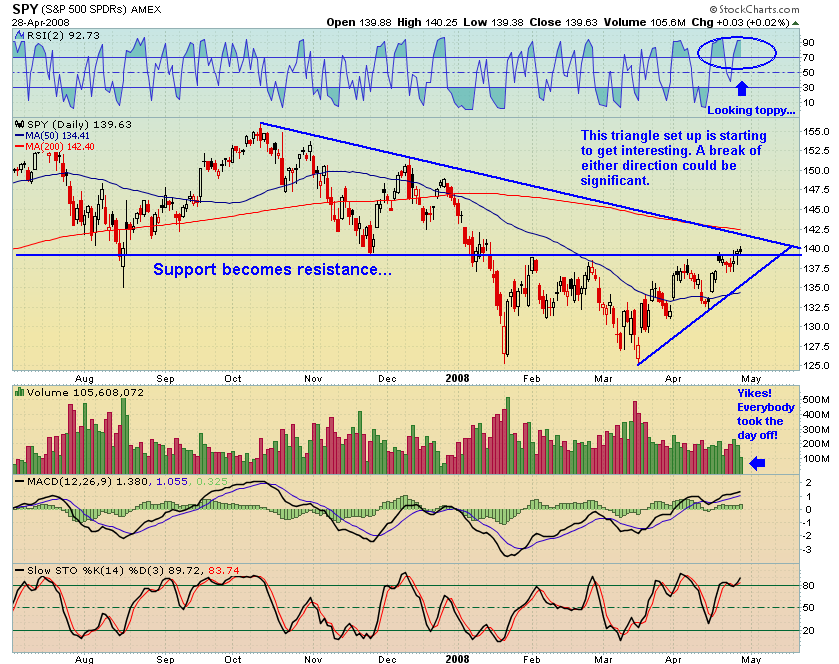
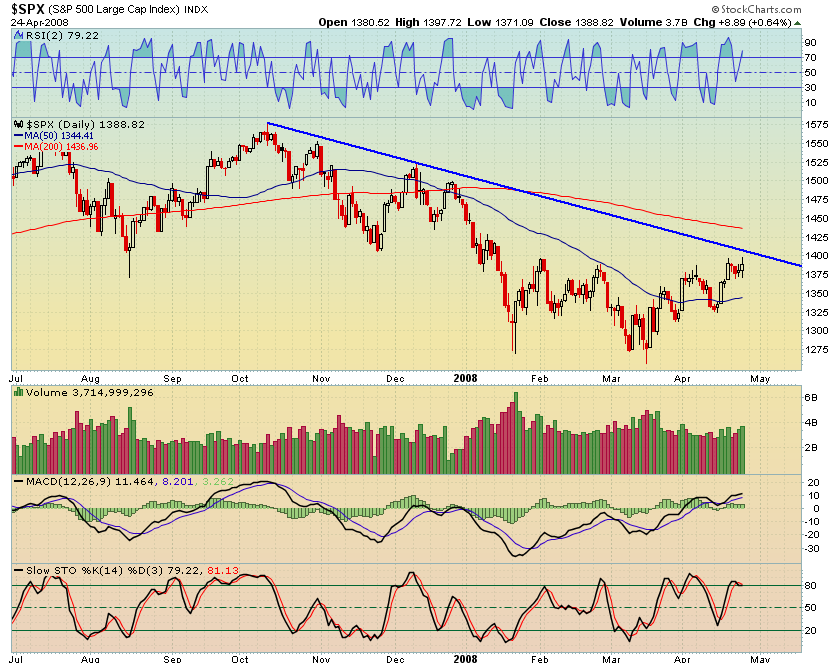
The SPY is looking very toppy here as it is having trouble overcoming resistance, and the RSI(2) is still firmly in overbought territory. At the very least, I think it is safe to expect a visit and test of the uptrend line. SPY could mingle with the $136.00 area. Volume was very very slight today as the index recorded the least volume of 2008. This could be because traders are waiting to see what the Fed does. Also we have the ADP report Wednesday and the Employment Situation on Friday. Due to the market moving potential of the Fed and the Employment Report, it makes sense that traders are reducing size, hedging, and taking easy profits here.
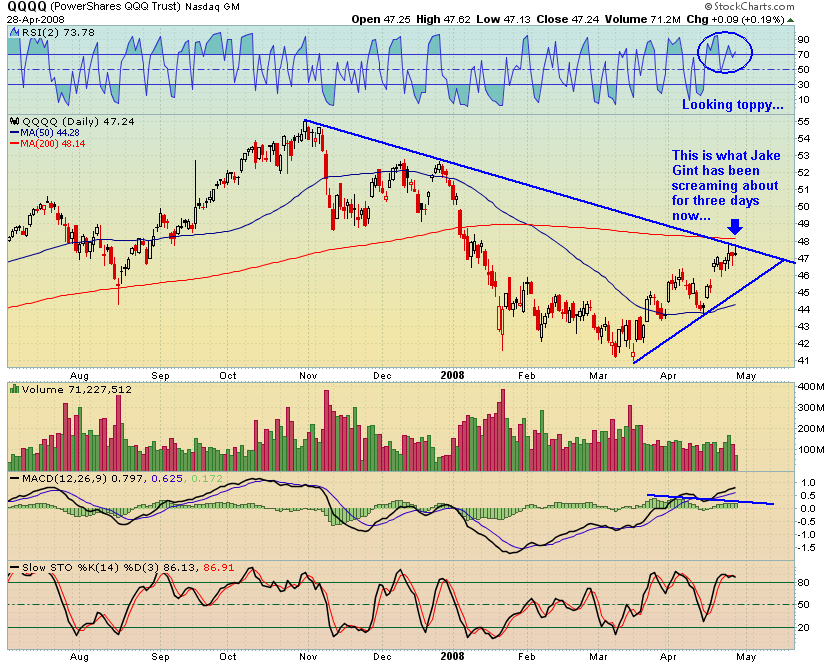
I decided to look at the QQQs instead of the Composite Index as the QQQs are outperforming the benchmark. Also, it is uncanny the way the etf has been refused almost to the penny at the downtrend line. Notice the index is trying to make new highs with a declining RSI, MACD, and Stochs. It could certainly blast higher from here, but I doubt it. I’m looking for a pullback to around $45.50-$46.00.
Generally, a pullback seems most probable here as traders position cautiously in front of the Fed and the Bureau of Labor and Statistics. Watch closely to see how the indexes perform should they trade near the bottom of the triangle.
Comments »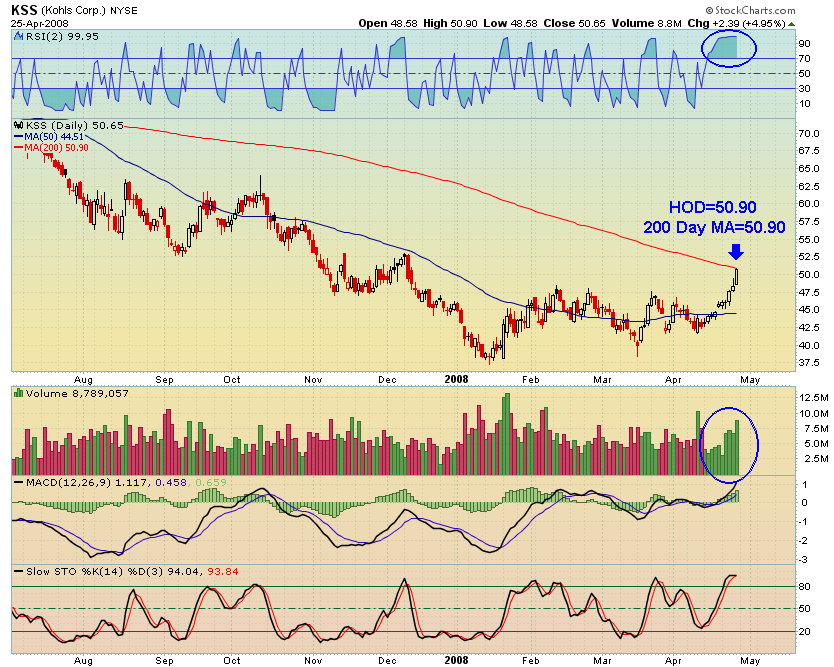
Coincidence? Or maybe this is just another example of Technical Analysis being saved by randomness?
KSS has become extremely overbought. As it has met moving average resistance, I expect it will reverse, soon. Because the downtrend has clearly been broken, we would want to look for a long position on any significant pullback where the RSI(2) < 10.
Comments »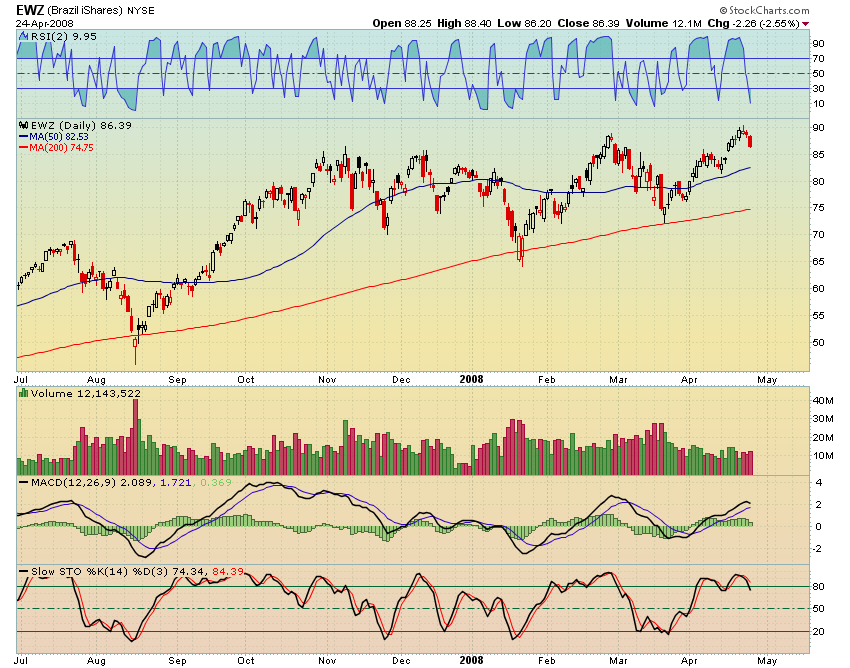
I see no reason not to buy this pullback in [[EWZ]]. There seems to be strong support at $85.00, and the 50 day average is at $82.53
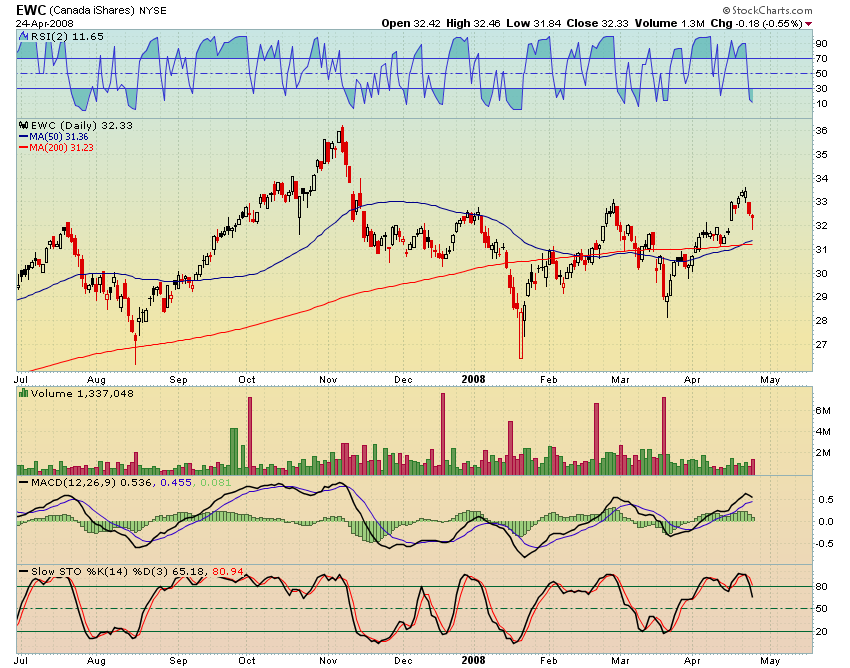
Canada [[EWC]] printed a bullish hammer today, and filled a recent gap. Seems like a good place to buy some.
I’m trying not to consider the fundamental backdrop and just concentrate on the technicals. Don’t mess with my fantasies.
Comments »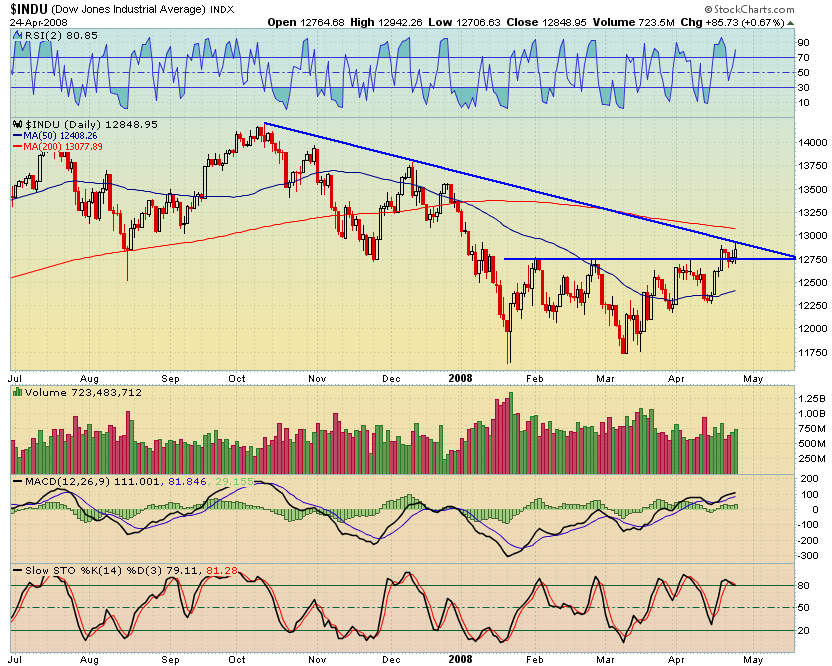
It is hard to believe that just one month ago the indexes were flirting with making new lows, and now, they are ready to break through the primary down trend.
Everything about this move up has been just right–look at the volume, for example.
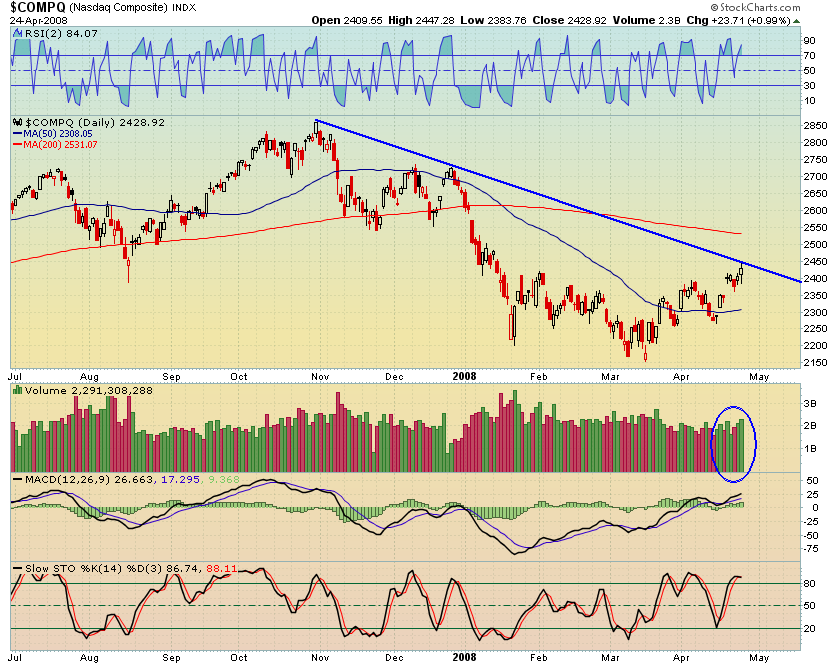
Nasdaq volume has been especially interesting. As I mentioned a few weeks back, it had been punished the most and therefore stood a good chance of rallying the most. The tech index has indeed rallied, right to the bottom of its primary downtrend line.
Technically, since the indexes are still trading beneath their 200 day moving averages, they are still in a bear market. I guess, too, that until the downtrend line is broken, that the indexes are still in a downtrend. It seems like splitting hairs, at this point.
To me, it all seems surreal. I’m left feeling that I’m not sure if its worth it to ever be net short again, for more than just a trade or two. The Fed has made it clear that the market is not allowed to correct, and stocks must always stay over-valued. Companies that have made decisions which should have bankrupted them are aided and abetted ensuring their survival. It seems to me that it will be easier to develop strategies that buy extreme weakness and capitulation, rather than trying to get short early enough and stay short long enough to see real profits.
Comments »RSI(2) buy signal was generated yesterday for [[FXP]].
This will be sold on the open following the day when RSI(2) crosses 80.
Comments »