iBankCoin
Joined Nov 11, 2007
1,458 Blog Posts

Advancers Lead Decliners: Bullish or Bearish Over Next 5 Days?

Advancers led decliners by almost 3:1 today on the Nasdaq and almost 5:1 on the NYSE.

In the book How Markets Really Work, tests run from 1989-2003 show that a bullish advance/decline ratio is actually bearish for the markets over the next week.

Here are some charts from the book that illustrate the quantitative disadvantage facing the bulls over the next week:

 Nasdaq with 3:1 Advancers to Decliners

The chart below shows that the A/D combined with the 200 day MA points to the possibility of even more downside, over the next 5 days.

Nasdaq Advance and Decline beneath 200 day average

Be aware that I have not seen the results of these tests over the past 5 years. Any edge may have been diminished or eroded entirely over this time period.

Comments »

The Daily Breakout: Number of Breakouts Explode

A proprietary screening system has identified 19 breakouts from a cup with handle pattern. 19 is the most breakouts this system has identified in one day since October 2006.

Here are some of my favorites from the screen.

KSU

[[KSU]]

NSC

[[NSC]]

RKT

[[RKT]]

SOHU

[[SOHU]]

MXI

[[MXI]] Odd that this ETF is breaking out…

I do not recommend buying these names tomorrow. I would wait for a pullback. After a day like today, where breadth was extremely bullish, weakness is more likely than strength, over the next five days. More on this in the next post.

Comments »

Dow Jones, Nasdaq, SPY, Back Beneath 50 Day Average

Nasdaq

I think the bears were little over-zealous in their celebrations on Friday. Regardless, my strategy has me leaning short or in cash on a failed test of the 50 day average. It is important to note that the moving averages should not be taken literally, to the penny. The latest closes are just beneath the average. If, over the next day or two, the indexes regain the averages, this might be considered a successful test. We’ll just have to see what happens.

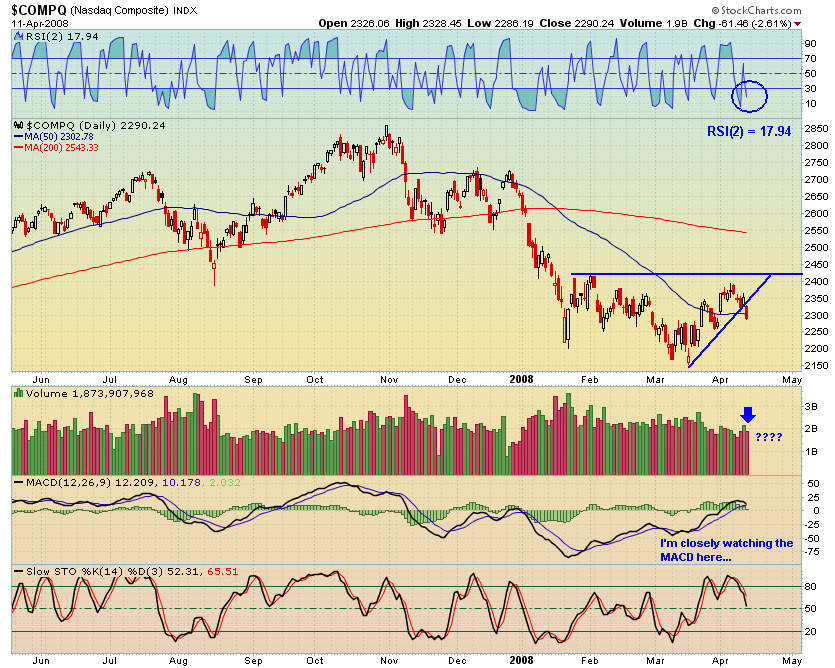
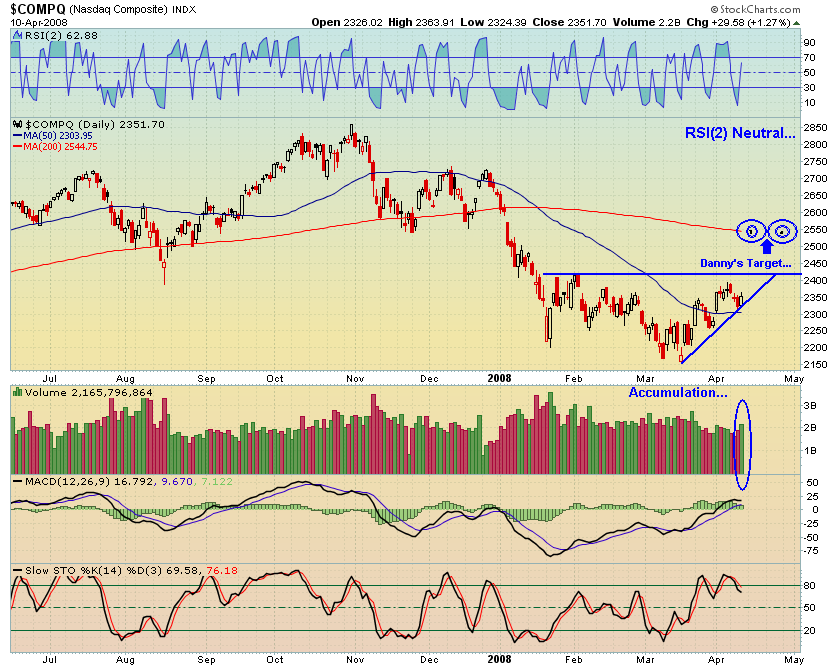
I want to note that the Nasdaq is not yet oversold, and had weak volume on Friday. Curiously, the [[QQQQ]] is still above the 50 day average. I’m not sure whether this means there is more downside coming or whether it should be interpreted as strength.

SPY

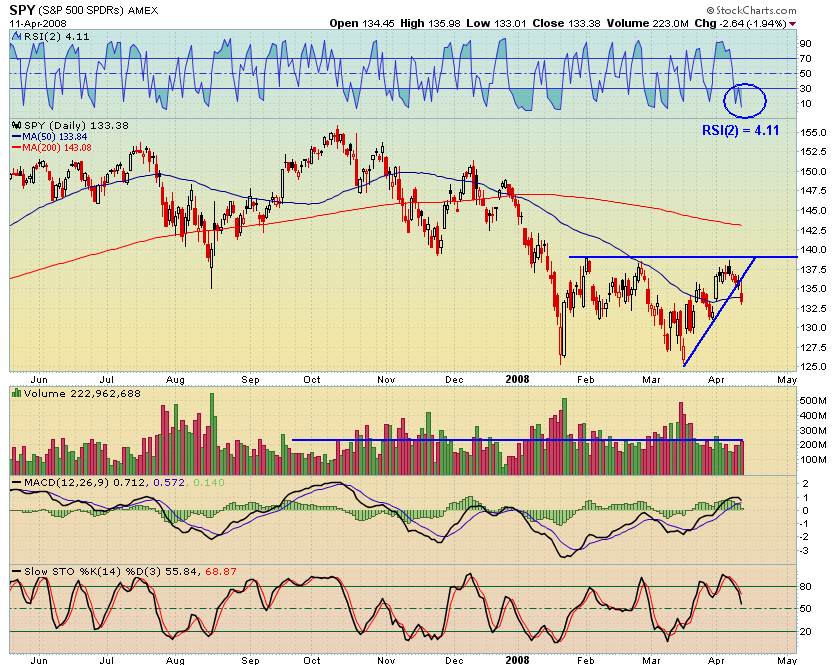
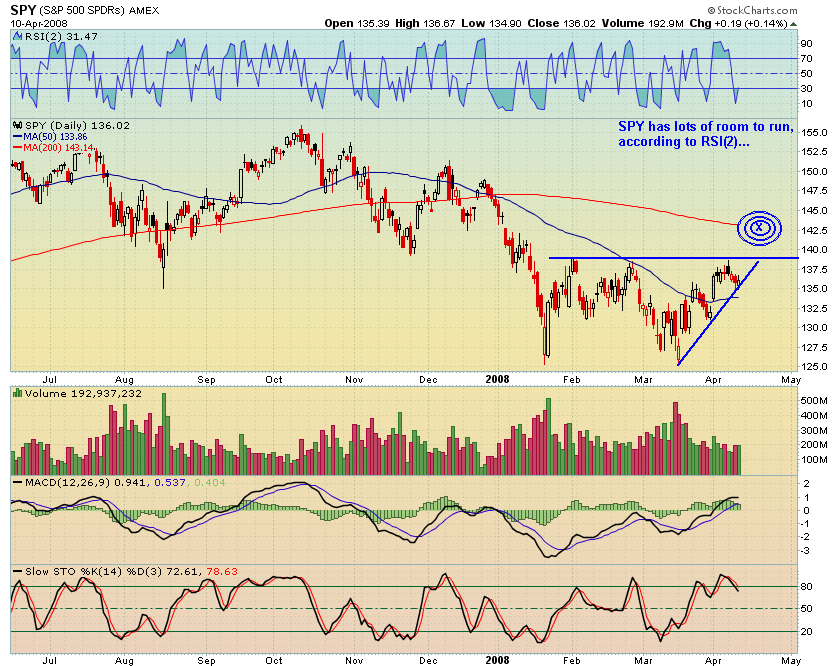
RSI(2) on the SPY leads me to believe there will be some stabilization or even a bounce, soon. Do note, as I’ve highlighted before, in a bear market, the indexes stay oversold for longer than they stay over bought. RSI(2) could stay at this level or lower for a day or more.

Dow Jones

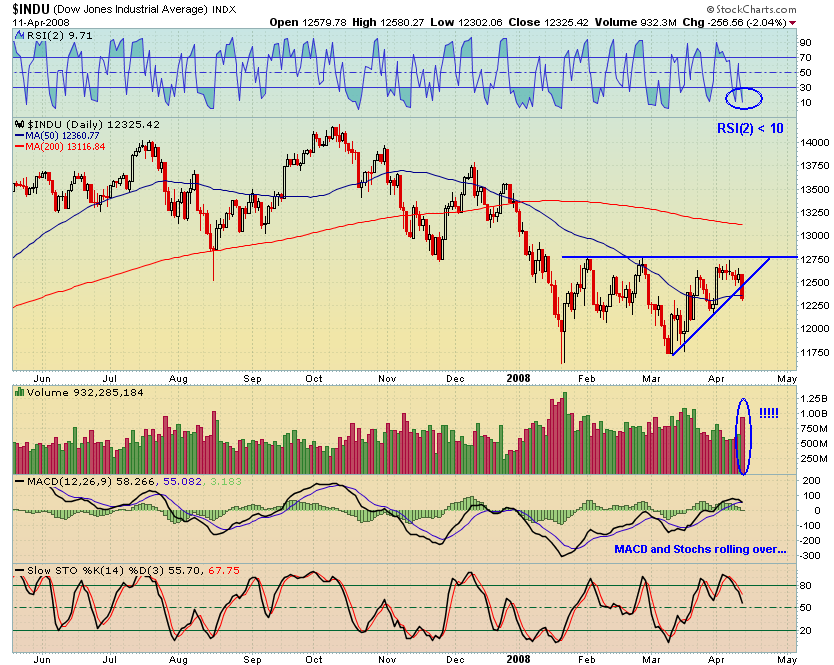
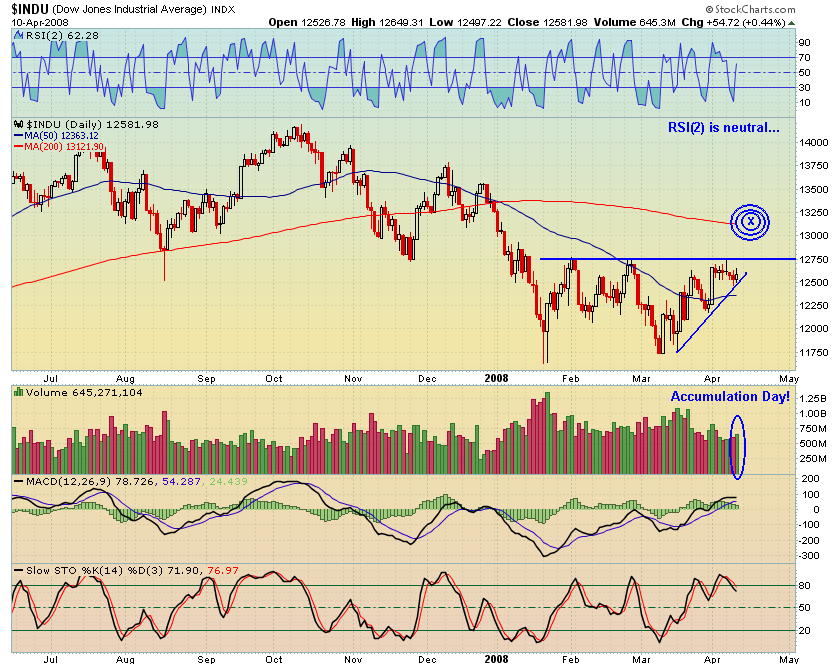
The Dow Jones is the most interesting to me as volume grew significantly. RSI(2) is near reversal levels. My first thoughts were that this level of volume is bad sign, on the move down. However, I’m now considering a different scenario.

Here is what we know:

  • According to IBD, NYSE short interest is at a 5 year high.
  • VIX closed right at its trendline.
  • The indexes are near short-term oversold levels.
  • 1 month trendline was broken Friday.
  • Indexes are beneath the 20, 50, and 200 day averages.

While I still have my downside hedges in place from last week, I’m not looking to add to any inverse etfs or establish any new short positions, just yet. As I alluded to in the beginning, I think the bulls might have some surprises in store for the bears. If nothing else, I do not think we will see a return to the high volatility like we saw in the 1st Quarter, at least not next week.

Comments »

Back Testing RSI(2)

As I have been using RSI(2) extensively to guide my discretionary trading, it seems only logical that I back test it. For this I am using Tradestation. Being a new user of the platform, it is taking some time to learn how to use it properly. Results will be forthcoming.

In the mean time, two other traders, Dogwood and Crazy Eddie have run tests of the RSI(2) strategy, and their results are significant. However, I encourage you all NOT to visit their blogs and want to emphasize that you should NOT trade this strategy as I would really like to get my automated trading set up before you, the internet stranger, ruins the edge for me.

Dogwood’s back testing is here.

Crazy Eddie’s back testing is here.

Both traders have run subsequent tests, so be sure to check out their home pages for the latest updates.

To read the original post on the RSI(2) strategy, which sort of kicks off the methodology, read this: Improve Your Timing With RSI(2).

Late Addition: Bill Rempel has contributed in the comments section some research he has completed on RSI(2). It is very interesting…. Read it here: About that 2-Day RSI.

Comments »

Insert Your Bullish Headline Here

Nasdaq

Bears, the Nasdaq is gearing up for a 200 point move. The SPY has 7 points of likely upside, while the Dow Jones is fixin’ to climb 600.

SPY

Sure, downside exposure is probably greater than upside profit. However, each trader has a different squeal point. It is likely that most of the squeal points will be hit, just as the rally has reached its apex. The confluence of these traders (shorts) covering and buyers buying may push the indexes past my targets as the markets capitalize on erroneous psychology.

The worst case scenario for the bears is that the indexes pass the February highs. If they do, every lemming with an idiot box and an internet connection will be hearing and reading about a double bottom. Nothing sucks in the retail schmuck and 401K’er like a compelling story smuggled inside a technical chart pattern. Look out bears. I believe a double bottom will bring in money from the sidelines.

Dow Jones

Just like every star that hides on the back of his tour bus is just waiting for his cover to be blown (references to alt. country rockers Uncle Tupelo), the bulls are cautiously making bets in the face of headline risk. I told you explicitly several weeks ago that bad news will be good news. What the bears need to watch for is a change of this sentiment. When bad news begins to be treated as bad news, it will likely represent an intermediate turning point.

You all know how extensively I use RSI(2). Dogwood posted some backtesting on using RSI(2) to swing trade QLD and QID. Read it here.

Comments »

I’m Long Lazy, Short Work

I had a helluva day at work, not getting home until after 9:00 p.m., and then I went over to the recording studio to begin mixing a project we started this past weekend.

I do not want to be a lazy goat fucker, so I’ll work in a quick post, sans charts.

I will likely get rid of my downside hedges tomorrow.

The indexes were pushed off their lows today, closing above the 50 day moving average. They are oversold, and the RSI(2) is at levels associated with reversals. The short-term trendline, started in March, is still intact.

Volume grew today, which means there was distribution.

I expect tomorrow to see support near the 50 day, with the indexes closing flat to up. I want to stay long here as long as we are making higher highs and higher lows, staying above the 50 day average.

Comments »