iBankCoin
Joined Nov 11, 2007
1,458 Blog Posts

An RSI(2) Strategy that Trades Just 3 Index ETFs

Stockfetcher RSI(2) Index ETF Strategy Results

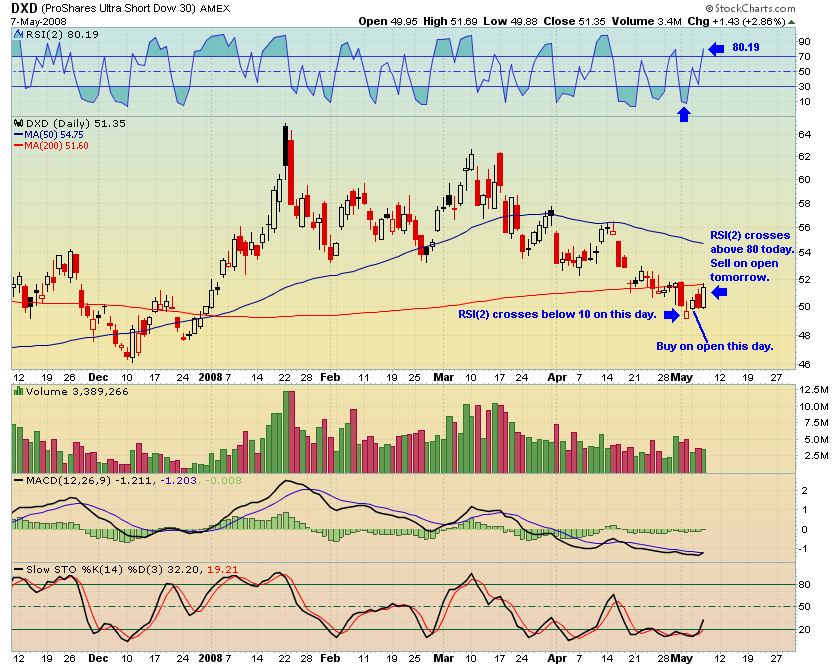
This strategy buys one or more of [[DDM]] [[SSO]] [[QLD]] [[DXD]] [[SDS]] [[QID]] when the RSI(2) crosses below 10. The buy is made on the open the day following the signal. The essence of the system is that the ultralong and ultrashort ETFs put the trader in the Dow, S&P, and Nasdaq when they are overbought or oversold, just before a reversal.

The trade is closed when the RSI(2) crosses above 80. The sell is made on the open the day following the signal.

Only 3 positions can be entered per day, and the system allows a maximum of 3 positions at one time.

A stop of 15% was used.

Starting Capital: $100,000      Ending Capital $140,545.59

Take a look at the actual trades here. Long/Short Index ETF RSI(2) Trades

Further testing needs to give consideration to another type of stop. Perhaps if an entry is made, and RSI(2) rises back above 10, but then crosses below 10 again, a stop is executed.

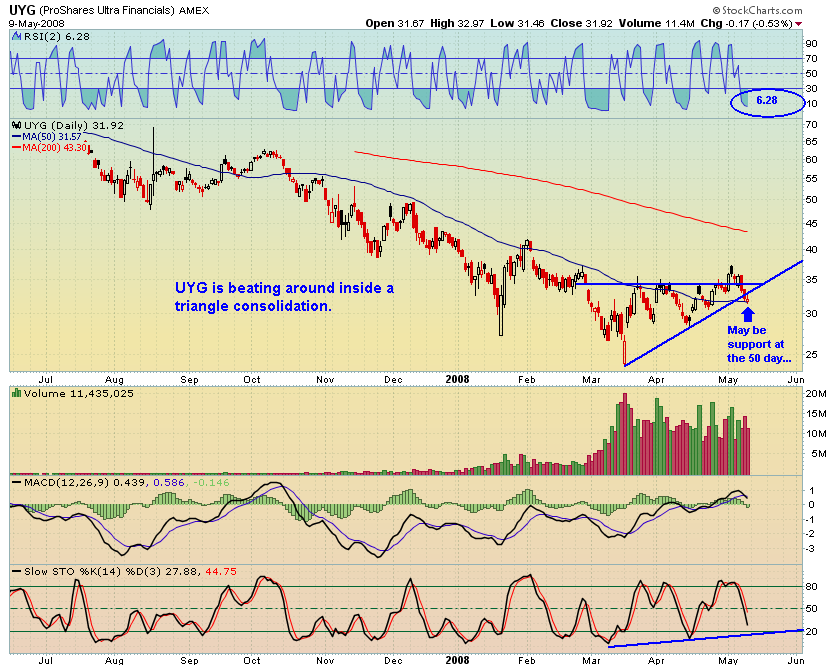
As this RSI(2) stategy relies on a pullback or reversal to achieve gains, subsequent testing may reveal that the addition of a moving average filter may avoid entries when the market embarks on a strong trend, with very few significant pullbacks. An example of this kind of trend is the sharp decline in early January and the recent sharp uptrend that started in March. In a strongly trending environment, the first RSI(2) trades that occur after the trend reversal result in drawdowns.

Comments »

Would You Buy This Chart?

CPST

Capstone Turbine Corp. [[CPST]] broke out of a six-month base in early December, 2007. Volume was ~4x the average of the previous 4 months.

  • The huge run after the breakout lasted for a month. CPST pulled back on decreasing volume, testing the 200 day average in January. The stock also bounced from the tip of the triangle, which it broke out from 1.5 months prior.
  • For the first half of February, the stock consolidated gains. A Bollinger Band, Average True Range, or NR7 system would probably have screened the stock during this time. It is easy to see the triangle forming, with volatility and volume decreasing.
  • On February 25, Capstone Announces New Distributor Agreement for Ecuador. Whether it was this news or the volatility squeeze, it is hard to say, but the stock breaks out on an increase in volume.
  • Throughout March, CPST consolidates on support from the January high, eventually bouncing off the trendline established from the January low.
  • This bounce leads to a +40% run.
  • In late April, CPST pulls back, and for a brief moment RSI(2) < 10. For the rest of April and early May, the stock consolidates within a triangle continuation pattern. Volume increases as the stock moves up.
  • Today Merriman initiated coverage with a Buy. Volume swelled, and the stock has plainly cleared the triangle continuation pattern.

 Would you buy this stock, on Tuesday?

Would you wait? If so, for what?

Comments »

Ultra-Financial UYG Testing 50 Day Average

UYG

The Ultralong Financial ETF [[UYG]] has pulled back into a temporarily oversold condition. UYG has been beating around inside a rough triangle pattern, but may find support as it tests the 50 day average. Depending on where one draws a trendline, UYG could be still trading within a triangle formation.

This index is similar to many others. They have found a bottom, rallied above the 50 day average, and are now pulling back near the average.

I’m seeing quite a few indexes that are short-term oversold, as measured by RSI(2). I’m expecting a bounce, or at least some stabilization, over the next few days.

Dogwood has a recent post about trading sector specific ETFs using RSI(2).

Comments »

RSI(2) Strategy Triggering: DDM Buy On Open

This is just a quick intra-day note telling you that [[DDM]] has an RSI(2) of ~6 today. This will trigger a buy-on-open for Monday of DDM, the ultralong Dow 30 ETF. I will take this signal Monday morning. Best case scenario, the Dow gaps down Monday morning and you pick up DDM even cheaper.

Keep watching [[SSO]] and [[QLD]] for an RSI(2) cross below 10.

Don’t forget to vote for Fly, which, incidentally is also a vote for me and the other loyal band of iBC tabbed bloggers.

Comments »

The Daily Breakout

RSX

[[RSX]] From Russia, with love. Yet another foreign ETF that is breaking out. If you are into the foreign ETF thing, be sure to check out Alphadawg’s post on ETFs.

EP

[[EP]] El Paso Corporation operates in the natural gas transmission, and exploration and production sectors of the energy industry in the United States.

What a fantastic breakout from a huge base. This one will run for a while.

DTV

[[DTV]] The DIRECTV Group, Inc. provides digital television entertainment in the United States and Latin America.

After today’s doji print, a retest of the pivot is in order. Watch closely for a bounce from ~$26.50-$27.00. Failure to bounce could mean this breakout will fail.

Its my birthday today. I’m taking the rest of the night off to do some fun shit. See you people in the a.m.

Comments »

Bears Defend the 200 Day Average

It should not be a surprise to any readers of this blog that the indexes are pulling back after meeting resistance at the 200 day moving average.

SPY

Both the [[SPY]] and the Dow Jones find themselves in precarious positions. They must defend the levels just below Wednesday’s close, or they will find themselves trading back within the Jan-April range. Both indexes closed just above the support provided by the double-bottom breakout. Should this support not hold, we will watch the uptrend line to guage strength.

DJI

Like the SPY, the Dow Jones is in danger of sinking back below its double bottom breakout pivot. Should this pivot not hold, the indexes may find themselves in Failed Breakout mode.

QQQQ

The Qs, however, are still very strong, and are trading above the 200 day average. Will it hold on this pullback?

Bottom line, this pullback was to be expected, as is a test of the uptrend line. Pay close attention to how the market is reacting to negative news. Should negative news continue to be discounted, I expect this pullback to be of the buy-the-dip variety.  But when in doubt, keep your eyes peeled on the uptrend line and the pivots established at the top of the 3 month trading range. Should all those break, the indexes are back to being rangebound.

Comments »

Closing Out Two RSI(2) Trades Tomorrow

Tomorrow I will be closing out 2 trades on the open. These trades were based on a RSI(2) strategy that I’m testing.

FXP RSI(2)

The above chart details the trade in [[FXP]]. I opened the position on April 24th, buying 50 shares at $62.56 The trade gets closed out tomorrow as today the RSI(2) traded above 80. If FXP opens tomorrow where it closed today, the trade will gross 7.3%

DXD RSI(2)

I opened the trade in [[DXD]] on Monday, May 5th. Again, the trigger was the RSI(2) crossing below 10. I will exit this position on the open tomorrow as the RSI(2) has risen above 80. I bought 200 shares at $50.00. If DXD opens tomorrow where it closed today, the trade will gross 2.7%

I have transferred half my capital, 50K, from my bullshit Scottrade account over to Tradestation. My intent is to automate the strategy on Tradestation’s platform. I will update iBC on the testing and results, but if things continue to go as well as I think they will, I will eventually have to go into stealth mode on this strategy to prevent internets leeches from sucking away any edge.

Comments »