Coincidence? Or maybe this is just another example of Technical Analysis being saved by randomness?
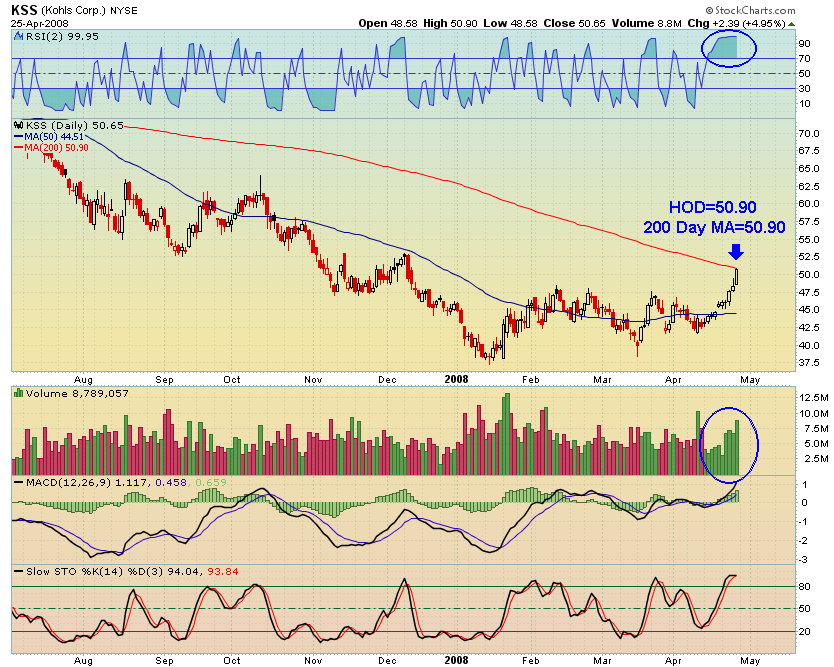
KSS has become extremely overbought. As it has met moving average resistance, I expect it will reverse, soon. Because the downtrend has clearly been broken, we would want to look for a long position on any significant pullback where the RSI(2) < 10.


But rebate checks are going out! According to Bush, they will push KSS to 64.
That’s right juice. I forgot about the rebate checks!
Hey Wood,
Looks like SP500 and XLF have broken out…can you confirm this? Dow Jones has broken as well, although I have a slight bit of nearing oversold levels via RSI(14)…not seen since Oct. 2007.
I am looking to buy some long hedges, but the market has gone up so much without some consolidation. You think it’s a counter trend rally?
Mike, I’ll do a post on this later tonight, but here is what I think, in brief.
The Dow, SPY, and Nasdaq have broken above the 3 month trading range. However, they are all pausing right at the downtrend line, which starts from the Oct. high. Also, they are all still beneath the 200 day average, which for technicians means we are still in a bear market.
XLF is sitting right at resistance as well, and has not broken above its recent trading range.
I would not be surprised at all to see the market fall back within the 3 month range and stay relatively range-bound for another 3 months. I still think a break of the lows is possible this Fall.
Turn off that RSI(14). It has no edge, whatsoever. Instead, replace it with RSI(2) and then use your Stochs or MACD to judge the present against previous levels.
Wood, Why RSI(2)? I tend to hold my positions a bit longer than most people, usually within 2 weeks to a few months.
This book I read told me to use RSI(14), since everybody references on that.
Dennis Gartman also uses RSI(14); since your the expert in charts, I would appreciate if you could give me your inputs.
Thx