My targets for the indexes, as outlined numerous times, have almost been reached. Momentum is slowing here, and the indices are overbought. However, the trend has not turned, yet. Hopefully you are taking some profits, and considering putting back on some short positions in stocks that are overbought.
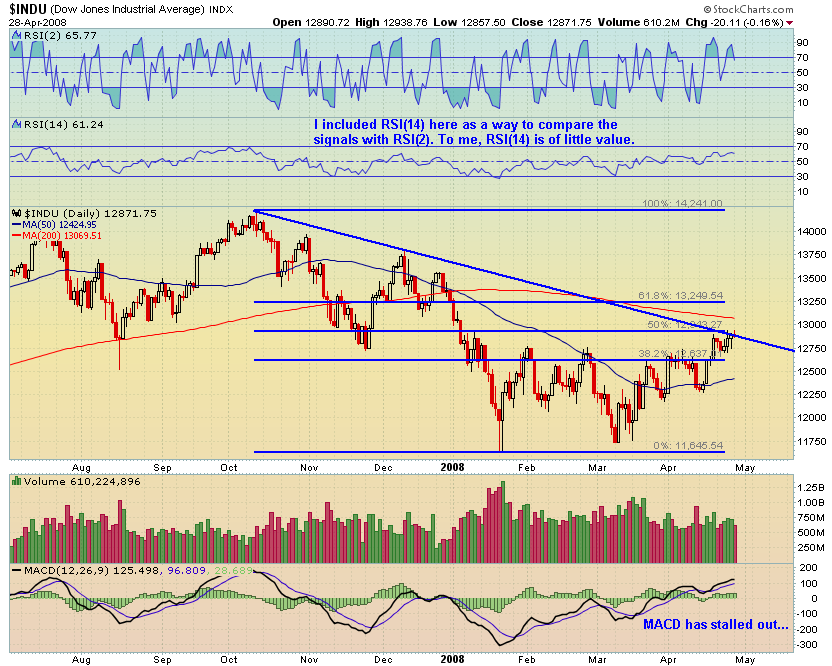
I included the Fib lines on the Dow Jones chart above to show that the Dow has retraced almost exactly 50% of its move down. I think this provides a good exit area for traders and fund managers who are still worried about the fundamentals of the economy.
I included the RSI(14) for Big Mike. Mike, you’ll see that RSI(2) works well over an average swing trade timespan of a few days to a month. I really can’t make much sense of RSI(14), and I’ve read that it has no statistical edge, but your mileage might very with that particular indicator.
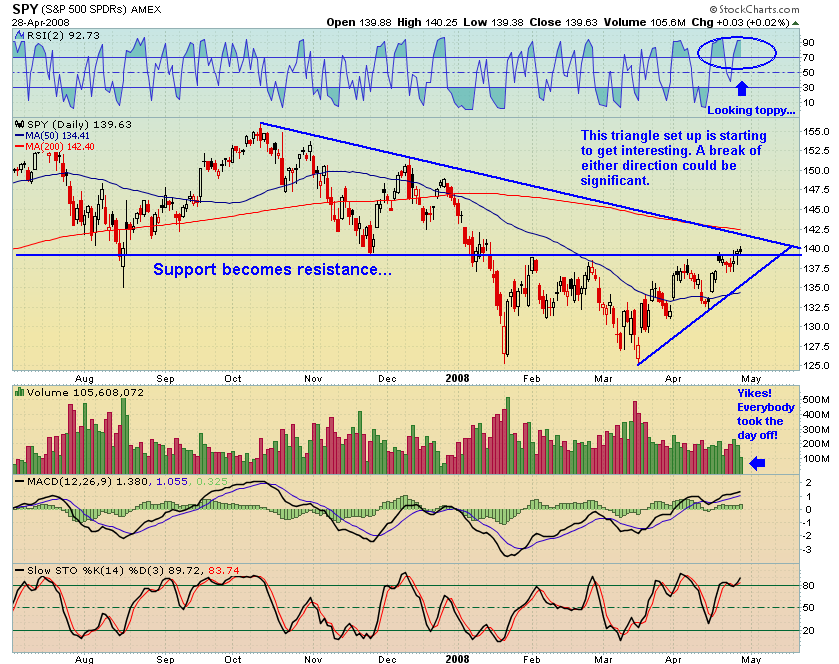
The SPY is looking very toppy here as it is having trouble overcoming resistance, and the RSI(2) is still firmly in overbought territory. At the very least, I think it is safe to expect a visit and test of the uptrend line. SPY could mingle with the $136.00 area. Volume was very very slight today as the index recorded the least volume of 2008. This could be because traders are waiting to see what the Fed does. Also we have the ADP report Wednesday and the Employment Situation on Friday. Due to the market moving potential of the Fed and the Employment Report, it makes sense that traders are reducing size, hedging, and taking easy profits here.
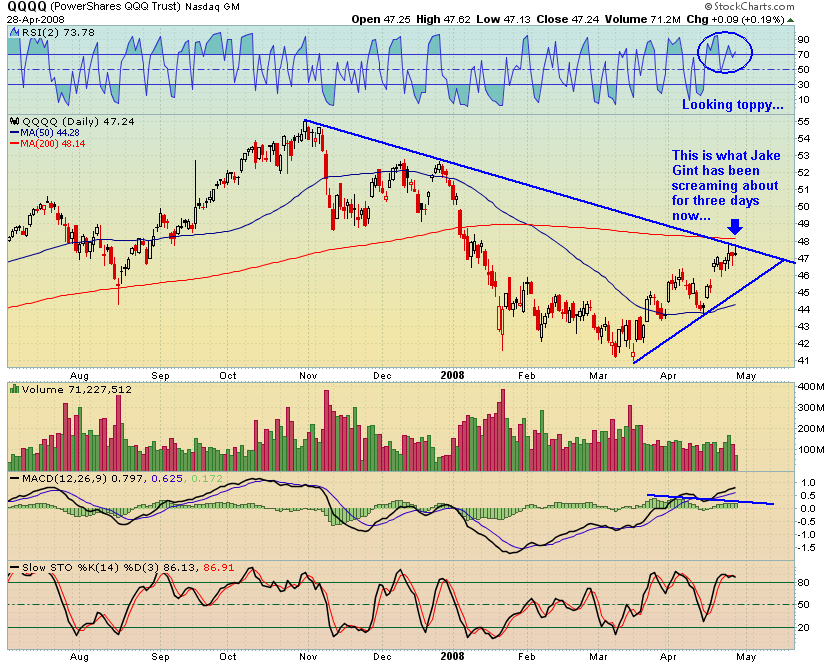
I decided to look at the QQQs instead of the Composite Index as the QQQs are outperforming the benchmark. Also, it is uncanny the way the etf has been refused almost to the penny at the downtrend line. Notice the index is trying to make new highs with a declining RSI, MACD, and Stochs. It could certainly blast higher from here, but I doubt it. I’m looking for a pullback to around $45.50-$46.00.
Generally, a pullback seems most probable here as traders position cautiously in front of the Fed and the Bureau of Labor and Statistics. Watch closely to see how the indexes perform should they trade near the bottom of the triangle.


Good charts Woody, I am 50% short and the rest in cash on the overnight. Haven’t been posting due to changes I made with my trading. Upgraded my pc and monitors to watch the charts – feel better trading this way lately, however no time to read or write during the day. Shorting the gaming names and the people who make the machines for tomorrow.
Good stuff, Cow. I’ll have to check out the gaming names and the machines.
Wood,
A pullback to 45-46 is normal and expected in this environment. The bulls should get a little concerned if Q’s break below 44, though.
Alpha, I agree. That is what I’m looking for.
However, I’m also considering that the right combination of Fed speak and job data could push us back into our recent ranges.
Throw an EMA 200 on the COMP chart and you get the same line of resistance as the Qs.
Thanks for the mention, Woodchipper, and I hope none of you or yorn were blown away in yesterday’s “tornada” (sic).
Two things in addition on the Cube trade.
1) The intermediate term fib chart (starting at the base of7/14/06 and stretching through the peak of 10/31/07) puts the 38.2% fibo line right at $47.63, which is also right on yesterday’s downtrend touch.
2) There are two good sized gaps to fill on the 60 day chart — right down to $44.00.
Hey Wood,
Thanks for all the hard work; Was out all day yesterday, therefore was not able to comment earlier.
I use the RSI(14) under extremes level of overbought/oversold signals; DBA (overbought) for instance, or the DOW (oversold) in the January’s panic.
Look at Potash too..When that signaled being overbought, it was only for 2 days before it started to crashed downward.
This morning GDP’s number caught me by surprise; I’m thinking about going Long Tech/Short Ags? What’s your trading strategies these days?