iBankCoin
Joined Nov 11, 2007
1,458 Blog Posts

The Fly Top

DJI 4/23/08

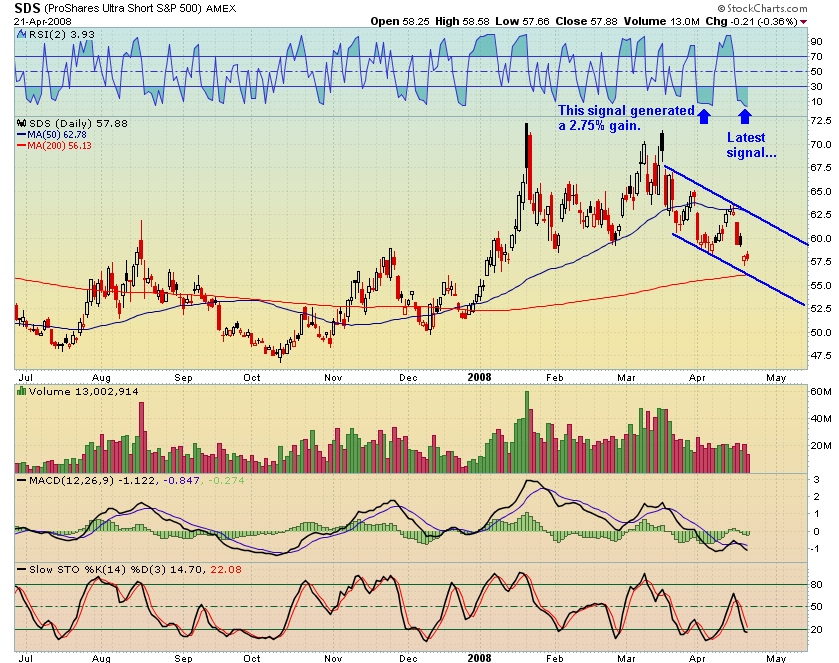
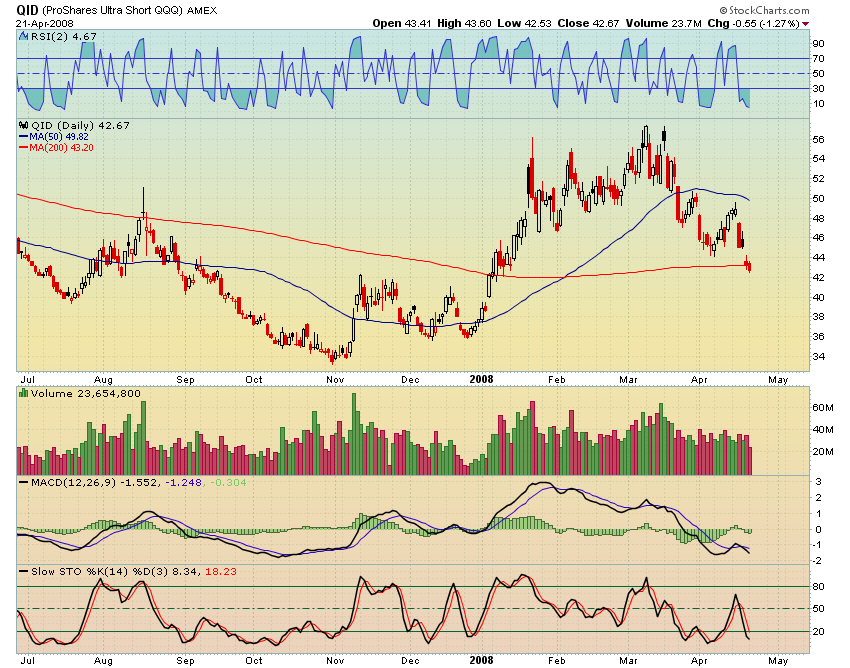
To be honest, I sold my [[QID]] before the close, and sold half my [[SDS]] and [[DXD]]. All the bulls needed was a good [[AAPL]] and [[AMZN]] report and I would have been punished. As you know, both AAPL and AMZN closed down in after hours trading, and the futures are down as I’m writing this. I’m beginning to think that we may be looking at a retracement to the uptrend line, for starters.

Nasdaq 4/23/08

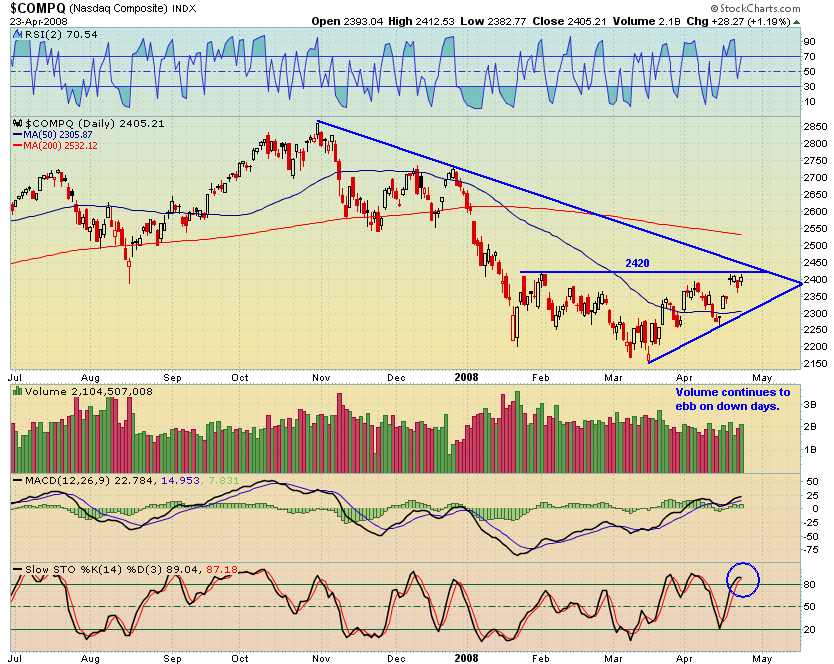
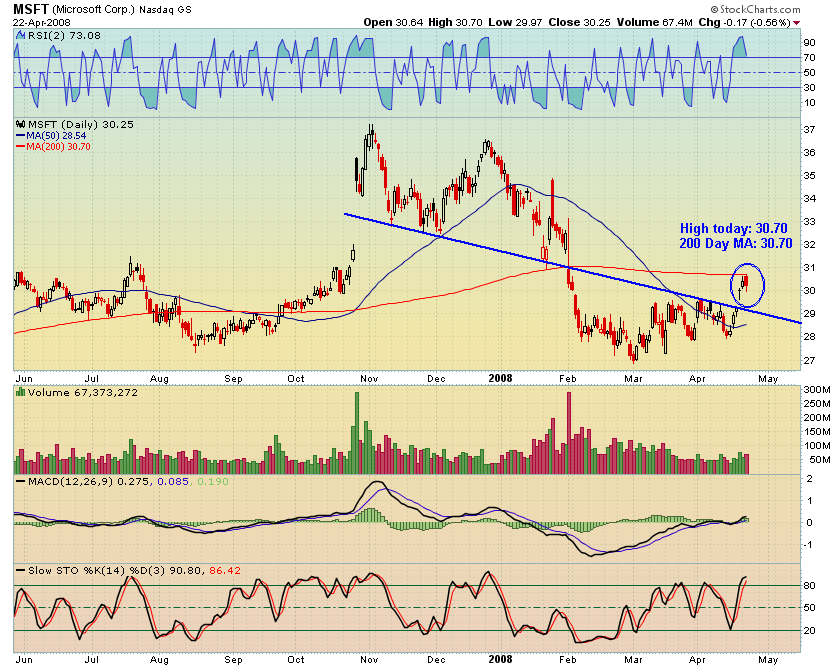
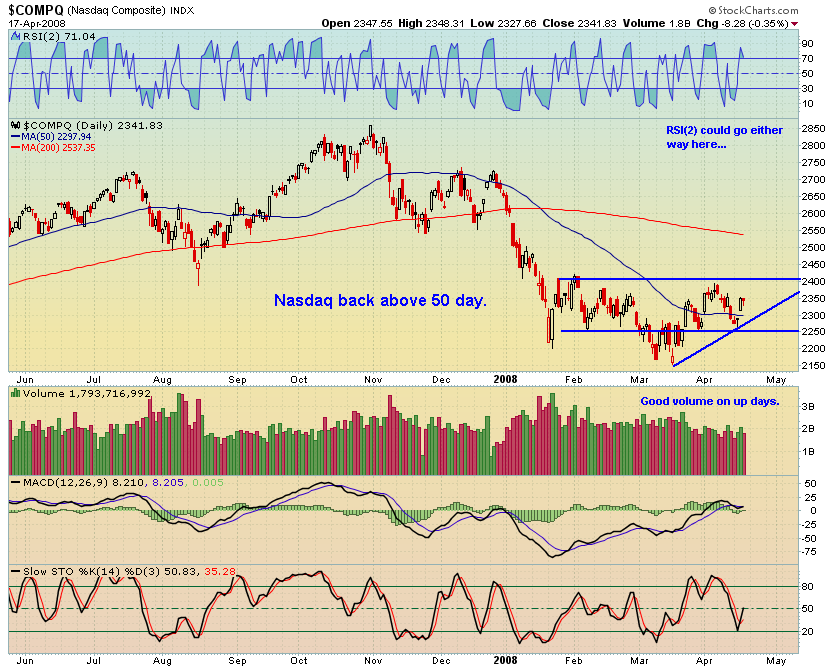
The Nasdaq continues to have good volume on up days.  [[MSFT]] reports tomorrow, and it seems to have become a supposed safe haven for bears who are trying not to fight bullish headwinds. With AAPL, AMZN and [[GOOG]] reports out of the way, if MSFT does not blow the roof off, I’m not sure what is left to ignite Tech during the rest of the quarter. However, the index is still making higher highs and higher lows, and so until this changes, one will have to stay very quick to take profits on shorts. Similarly, I’m wondering if the bulls aren’t starting to get a bit apprehensive with the indexes hanging around resistance here. Truly, the bulls can’t afford to sit around here doing nothing for very long.

SPY 4/23/08

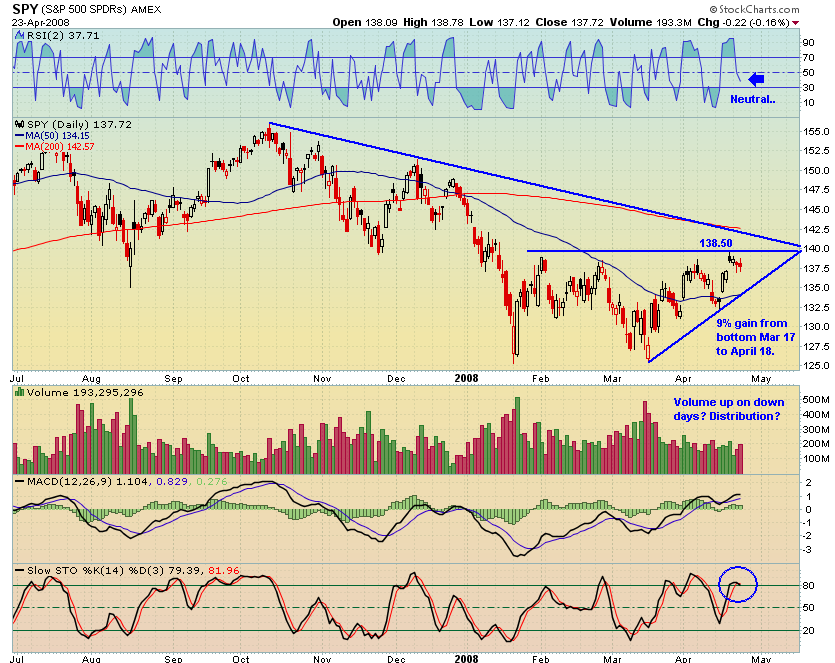
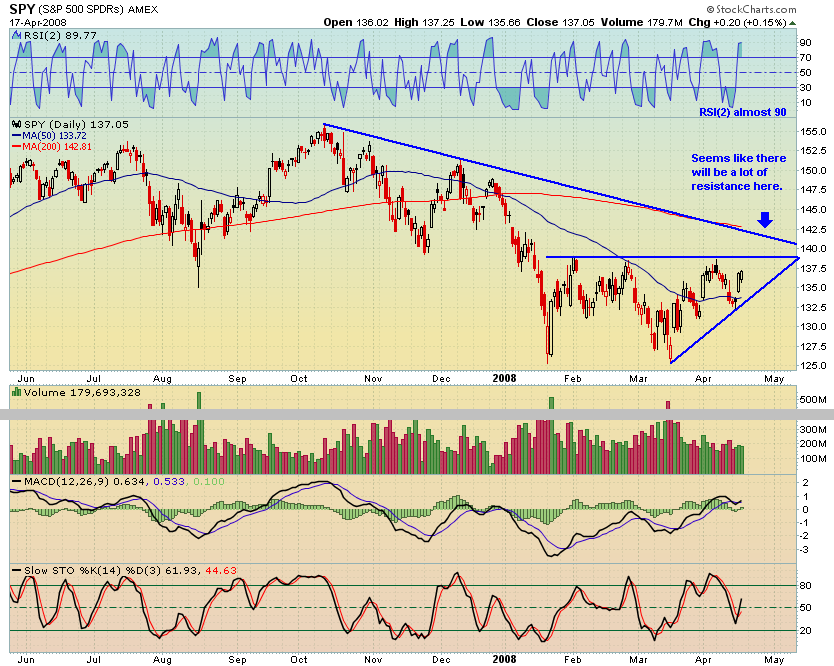
With Friday’s close representing a 9% rise from the bottom, a pause here would not be surprising, as 10% is fairly standard for bear market rallies. And as others have mentioned here at iBC in the comments section, seasonality is nigh….sell in May and go away…

SDS

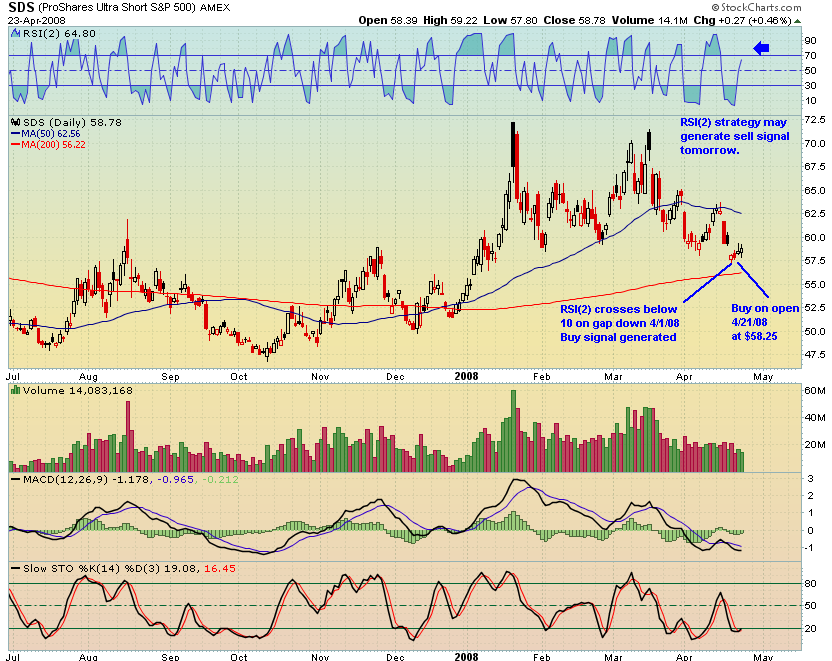
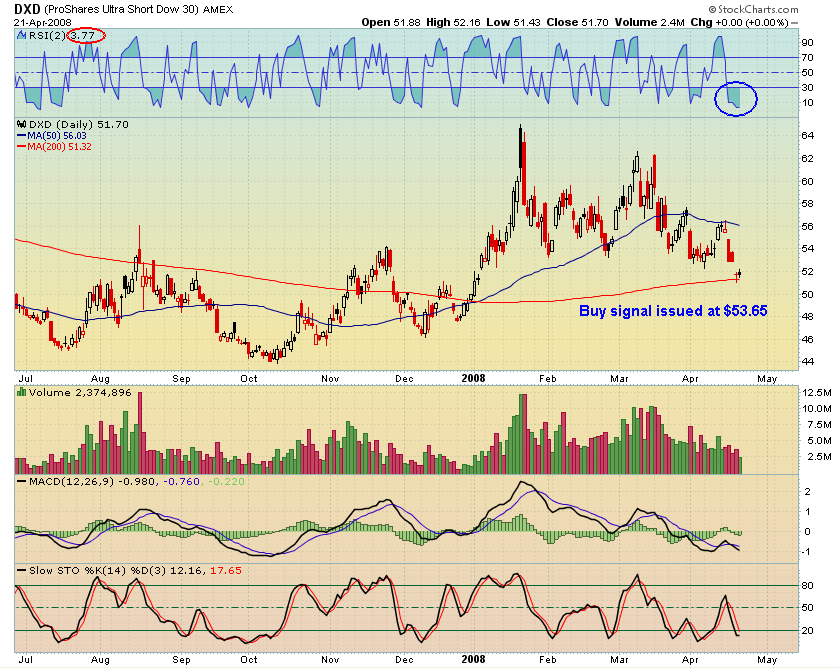
The inverse ETFs have generated some controversy as to their profitability for traders. I can tell you that being on the right side of these trades, over the past year, would have produced generous returns. Above is a graphic representation of one of the latest buy signals for the RSI(2) strategy. The signal was generated Friday when RSI(2) crossed below 10. The trigger has one buy the next opening. The trade is currently in the money by .53 points. If RSI(2) crosses 80 tomorrow, a sell signal will be generated, which will mean one will sell Friday morning.

[[FXP]] generated the same signal today. We will record the opening price tomorrow and follow the progression of the trade.

Comments »

Pheonix Technologies: The Picture of Pain

PTEC

This one hurt me today.

8:14AM Phoenix Tech beats by $0.07, misses on revs (PTEC) 15.36 : Reports Q2 (Mar) earnings of $0.08 per share, $0.07 better than the First Call consensus of $0.01; revenues rose 89.0% year/year to $17.1 mln vs the $17.4 mln consensus. Co states, “…Combined with deferred revenues, our total order backlog for the quarter is now nearly $55 million, or 92% higher than year-ago levels. This positions us well for sustained revenue growth over future quarters as we begin to invoice and recognize this revenue.”

I knew the report was mixed, but I never expected to see a 15% haircut.

There is yahoo message board speculation that Ramius Capital Group is selling out the rest of their shares, as some sort of punishment to Pheonix for refusing their buyout offer of $5.25/share in January 2007.

What was clear today is that someone was selling [[PTEC]], almost every minute of the day. Despite my index shorts working hard for me today, this move down eclipsed those gains.

The 200 day average is now the line in the sand.

Pheonix…ashes….blah blah blah

Comments »

Crack My Spread: TSO

Some of you today started talking about the refiners, and specifically [[TSO]].

I do not understand why the refiners have been punished as crude has moon shot. I do not know what a crack spread is. Basically, I rarely trade oil, because I always seem to lose, and obviously I do not know dick about the fundamentals.

Anyway, I know the technicals.

TSO is interesting, technically.

TSO Weekly

 The 3-year weekly above shows a nice divergence setting up on the MACD. The MACD is my favorite indicator for identifying possible bottoms in stocks that have persisted in downtrends. Also, volume is swelling, which may show capitulation or actual buying interest.

TSO

The daily chart shows that the MACD has already crossed. Stochs have turned up. RSI(2) is a tad overbought. A natural target is near the previous April high and the 50 day average. If you think the fundamentals have changed, maybe you stay in the trade longer.

Buying the stock near 27.50, with a stop below 25.00 and a target of 34.00 provides near 3:1 reward to risk.

Now, can somebody explain to me why refiners have been punished? Also, what the hell is the crack spread?

Forgive me as I’m lazy and ignorant.

Comments »

Statistics Favor the Bears

On Friday I doubled my [[QID]], [[SDS]], and [[DXD]] positions. These ultra-short etfs are very oversold and due for a bounce. I am now net short the indexes by the largest amount, year-to-date.

If these trades turn out the same way as the recent testing suggests they might, I can expect an 88% win rate and an average gain of 5%. (Check out Pennings of an Analyst for the original test). Note though that the Stockfetcher tests are rudimentary and exploratory. I have not worked out or tested an entire system for this strategy, but I believe in the signals enough to take these trades.

DXD

[[DXD]]

SDS 

[[SDS]]

QID

[[QID]]

The strong, bullish days of the past week have set up a situation where a pullback is likely. The average drawdown of the trades tested was -3.2%. The DXD trade is currently drawn down -3.7%

Comments »

Even More RSI(2) Research and a Stock Pick

IBDindex has posted some new research on an RSI(2) strategy.

Read it here: Trend Following RSI(2).

The results have me extremely excited about building a system around this simple strategy.

Below is a chart of [[TMX]].

Note the RSI(2) is .21

A simple play is to buy [[TMX]] tomorrow and sell it when RSI(2) > X (You might use between 75-90). I like this particular stock because it has been oversold for several days and it may be sitting just above support. Be careful though, as earnings is Tuesday the 22nd.

TMX

If you buy [[TMX]] because of this post, it may stay oversold for the next 13 days, and result in a severe debanking.

Comments »

Dow Jones, S&P Again Nearing Congestion

SPY

The indexes appear poised to make a 4th stab at piercing resistance. The SPY could rally another 5 points and the Dow Jones another 400 points before encountering the down trend line and the area of the 200 day average. I continue to strongly believe that the markets will not be able to trade above this area for very long, if at all.

Dow Jones

Still, one cannot fight the bullish tape. I think it makes sense to expect a break of the immediately overhead line of resistance. I expect that a break of this area will create a situation that is ripe for the resumption of the downtrend. It would not be surprising to see the indexes flirt with breakeven on the year, just to cause the most pain for shorts and to trick the longs into blowing their wads, before reversing.

Nasdaq

The Nasdaq is still the most beaten down index. It could certainly rally higher here, break resistance, and still have a ways to go before the 200 day average and the primary downtrend line.

If the markets are going to break resistance in the next couple of days, they are going to have to find the strength to continue moving into a further overbought condition.Â

I am still long biased but have kept my hedges as they were added near the last top. As such, they are not causing too much pain, yet, although my QID is starting to worry me a bit.

Comments »