iBankCoin
Joined Nov 11, 2007
1,458 Blog Posts

Lazy Man: Testing Exits on an ES System, Part 2

Part 1 outlined the purpose of this series and established baseline results for the long entry when paired with a time-based exit, and again when paired with an EMA cross.

In Part 2 I show the results of using the short entry coupled with the same exits (time-based and an EMA cross).

At the end I include two equity curves: One with both long and short entries and the time-based exit and one with both long and short entries and the EMA cross exit.

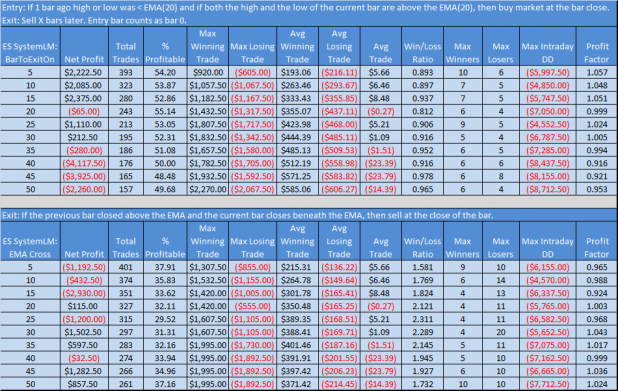
Below is the spreadsheet that shows the results from the time-based exit for the short entry.

Compared to the results from the long entry, this is a huge improvement. Assuming 10K of starting equity, this makes an easy triple-digit annual rate of return.

Below is the spreadsheet that shows the results from the EMA cross exit for the short entry.

Not as good as the time-based exit, but still respectable. Note the win % is very low, but the average winner is better than twice the size of the average loser.

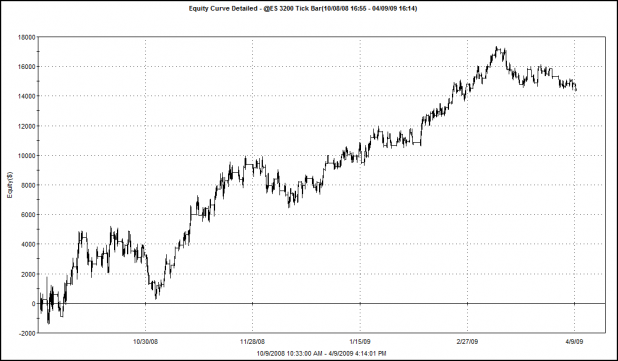
Below is the equity curve of the time-based exit for the short entry.

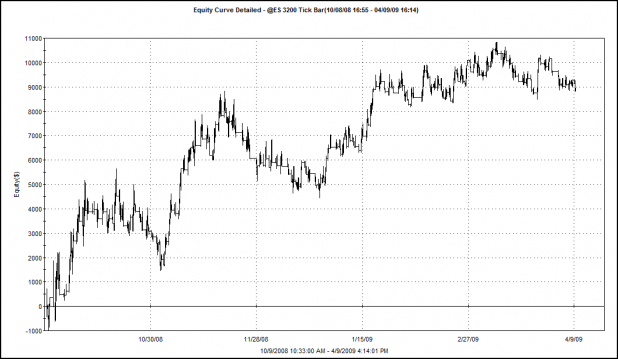
Below is the equity curve of the EMA cross exit for the short entry.

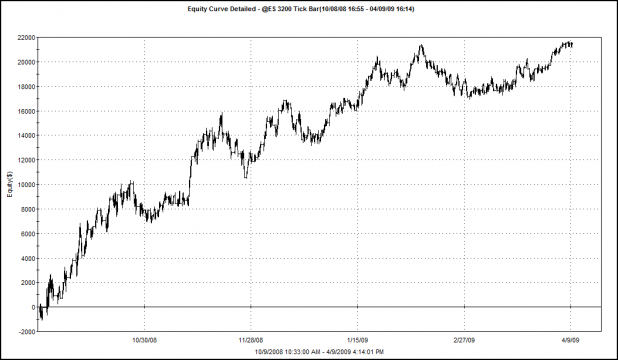
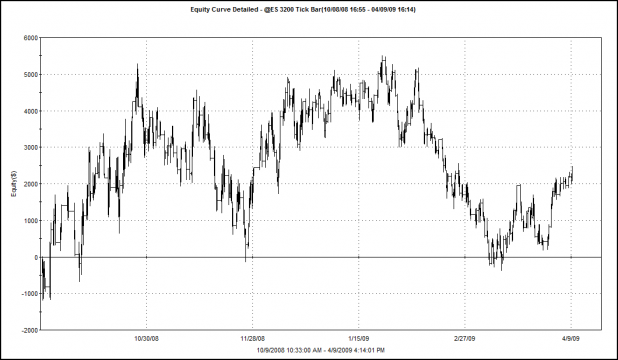
Below is the equity curve of the long and short entries paired with an optimized time-based exit of 50 bars for the longs and 20 bars for the shorts.

This represents an annualized return of 229.87%, assuming 10K starting equity.

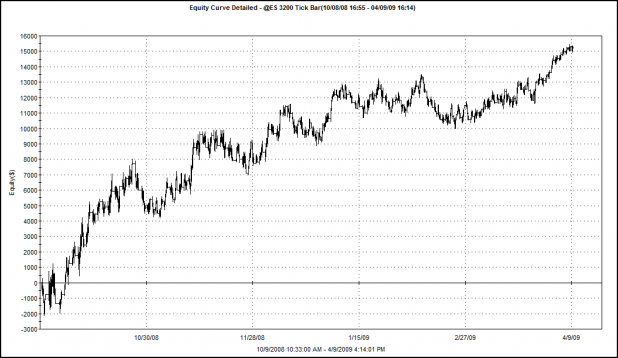
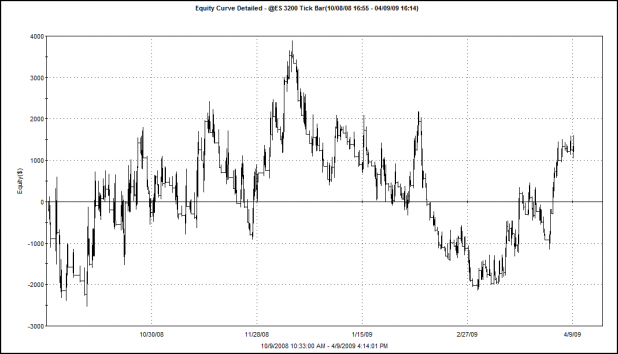
Below is the equity curve of the long and short entry paired with an optimized EMA cross of 50 bars.

Note that this represents an annualized return of 185.80%, assuming 10K starting equity.

Takeaways:

While I am well aware that time-based exits are very susceptible to curve-fitting, I am still somewhat surprised at how much they outperform the EMA cross. This seems to add weight to Lazy Man’s belief that the entry makes it possible to catch trends.

What’s Next?

Part 3 will investigate the application of two more exits for the long entry: A RSI exit and a Bollinger Band exit.

Comments »

Lazy Man: Testing Exits On an ES System

Lazy Man began leaving comments on a recent post, Short Term Mean Reversion Still Working.

He asked for some help improving exits on a system he uses to trade futures. The comments section of the post will show how the idea for the project developed.

Because I’ve never worked on an intra-day system for futures using tick charts,  I decided to see what I could come up with. It seemed as if it might be a good opportunity to help someone else out while providing me a chance to practice coding and backtesting.

Lazy Man’s System

For ES, a 3200 tick chart is used.

9:30am to 2:30pm entries only.

Trades are entered at the close of the first bar that trades completely above (long) or completely below (short) the 20 period EMA.

The high and low must not touch the moving average. The previous bar must have at some point traded beneath the 20 period EMA. (The entry is a variation of the classic moving average cross).

Trades are closed when any of the following are true:

1. 3pm

2. Any bar extends to the wrong side of the MA by 50% or more.

3. He feels like the trend is over – and there is the problem – too much emotion. Lazy says he often exits too early or too late.

Let the Testing Begin

A baseline must first be established.

1 contract will be traded. $2.50 per trade commissions are included. The period tested was from 10/08/2008 to 4/09/2009.

I chose to start testing the longs first, coupling the entry with a simple time exit.

The results are in the top half of the spreadsheet below.

With the time exit results established, I then tested an exponential moving-average cross. The EMA cross exit triggers when price crosses and closes beneath an EMA. The results are in the bottom half of the spreadsheet.

Below is the equity curve that resulted from the baseline results, optimized to exit on the 15th bar.

Below is the equity curve for the moving average exit, with the EMA used for the exit optimized to 30.

So far, neither exit looks very promising.

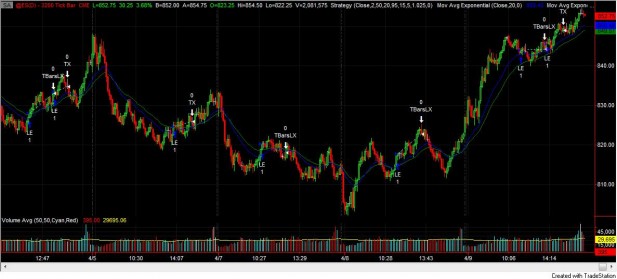
Recent Trades are Below:

TBarsLX = 15 bar exit; LE = Long Entry; TX = 3:00 o’clock exit

What’s Next?

I am going to keep testing exit signals until either I get bored with them, or I can no longer code them due to their complexity.

Lazy’s stops must also be tested.

Eventually, a smooth(er) equity curve may be produced.

Comments »

C’mon Back

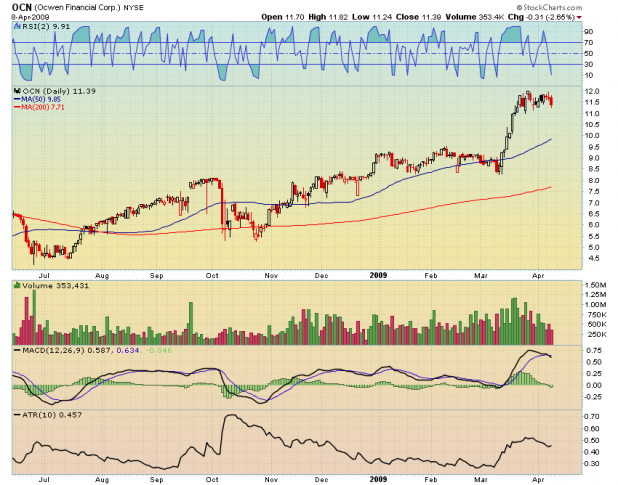
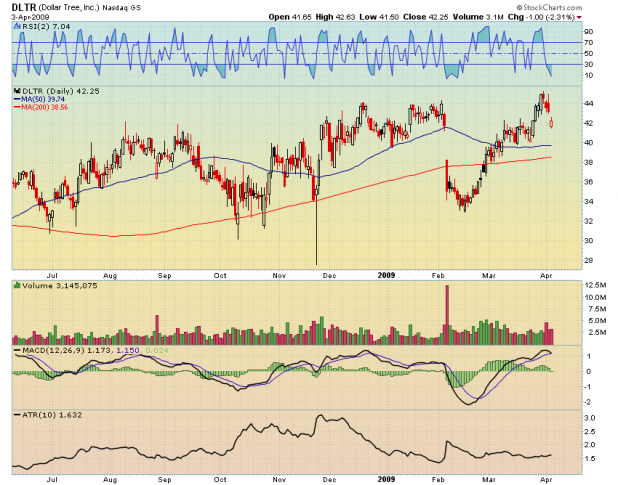
As long as the markets are firm, I will keep posting these pullback plays. They have been peforming well during the bear market, but when we get these bear market rallys, they can be outstanding.

Remember, the idea is to take profits quickly on these, ideally when RSI(2) closes above 70.

Do not forget a stop loss, 8% should do, just in case a bounce never comes.

Comments »

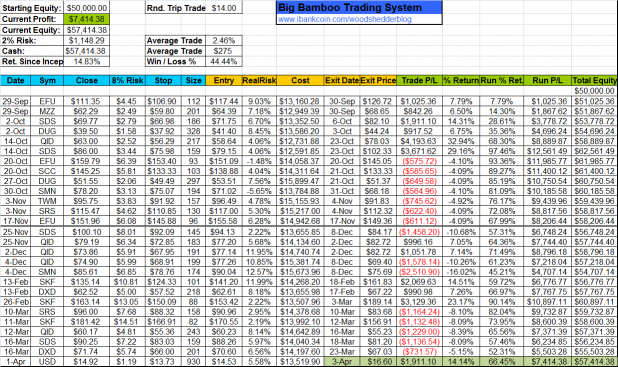
Big Bamboo Update

Last Friday, Big Bamboo closed out the USD trade for a handsome 14% gain. (I know, I’m late updating).

Surprisingly, there have been no signals since then, although the indexes have made some nice pullbacks. I’m not sure what that says about the quality of the pullbacks. Probably nothing.

I’m still testing to determine whether the Big Bamboo will ultimately survive as a viable system. More on that soon.

Comments »

Two More Pullbacks for Monday

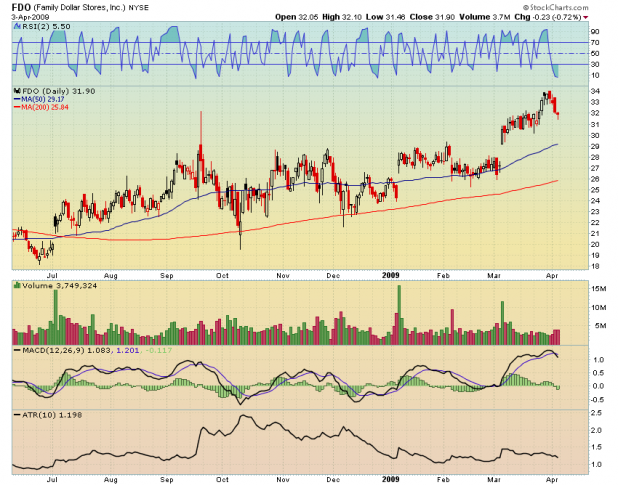
Note that these stocks have bucked the downtrend pretty well. I’m assuming this is due to the belief that during a recession, discount stores will see increases in sales.

While I am biased short, should the trend not bend too far to the south, these pullback setups should work well.

Comments »

Short Term Mean Reversion Still Working

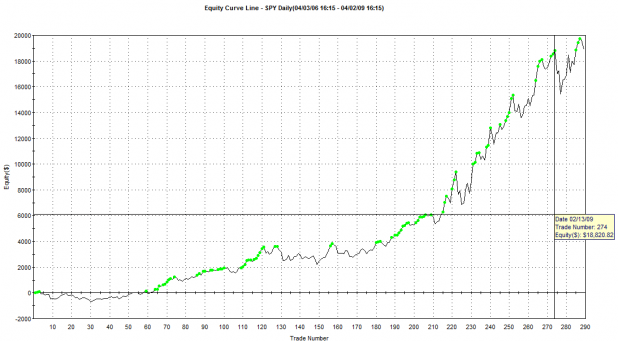
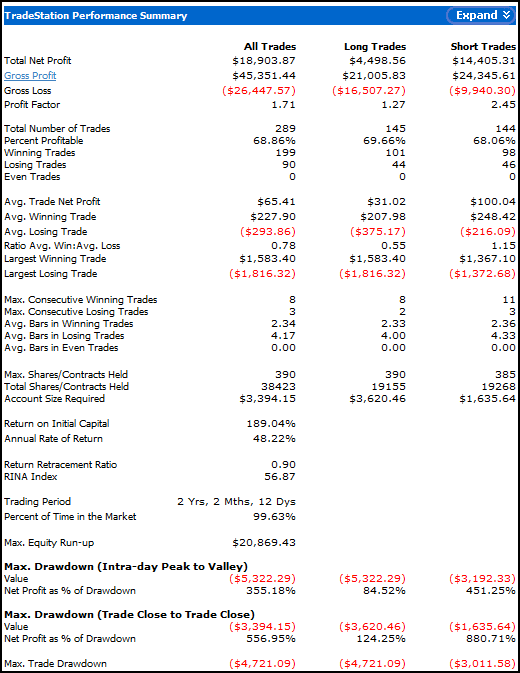
The equity curve shows the results of buying the SPY first close beneath the 2 day moving average (dma) and then closing the long position on the first close above the 2dma. It also sells short the first close above the 2dma and covers the short on the first close beneath the 2dma. In short, it is in the market all the time, trading around the 2dma.

The system uses 10K starting equity, and compounds gains. No stop losses were abused in the making of this system.

Results do not include commissions or slippage, and adding commissions of $7.00/trade lowers the win rate to 62.2% and drops the annual return to 31.80%, reducing net profit by almost 9K.

The point is not to consider this is a viable system, but instead to observe and ponder the anomalies that come and go. I have been wondering for some time now how long it will be before this pattern changes.

If nothing else, when such a simple system works so well, for as long as this one has, I think that certainly the hardest part of trading is mastering the psychology. For example, I doubt even one person reading this has been trading a very short term moving average, religiously, despite the fact that the success of short-term mean reversion has been discussed by many bloggers.

I also wonder, if the same system was backtested during the previous (few) periods in market history where a very short term mean reversion system worked, and some ratios were developed to describe performance, with special attention applied to the ratios when it was outperforming versus ratios as it begin to fail, if a similar set of ratios would also exist for the current data.

Ultimately, the holy grail may be a simple system-health tool, able to be normalized across diverse trading systems, which would turn a system off before a meltdown. If such a tool were to exist, any new anomaly which lasted long enough to collect sufficient system-health data, could be traded.

Its fun to think about, anyway.

Comments »