iBankCoin
Joined Nov 11, 2007
1,458 Blog Posts

Two Sweet Pullbacks to Buy

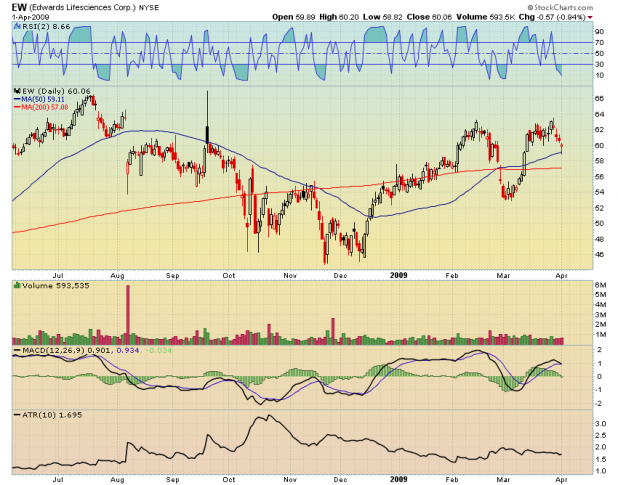
A nice candle printed today for [[EW]] and it bounced in oversold conditions from the 50 day average.

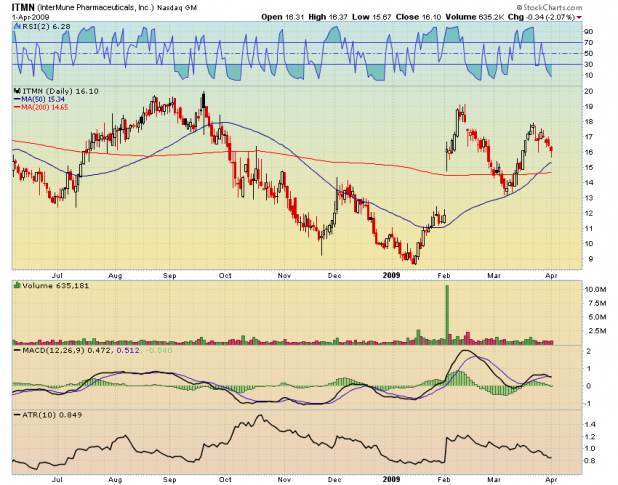
ITMN is a very similar setup to EW.

Both stocks recently had the 50 day average cross the 200 day from underneath. However, I would focus on a shorter time frame with these types of setups. I’m not looking to ride a trend here, just a bounce.

Keep in mind that I do not check for any news or earnings releases before I post these setups.

Comments »

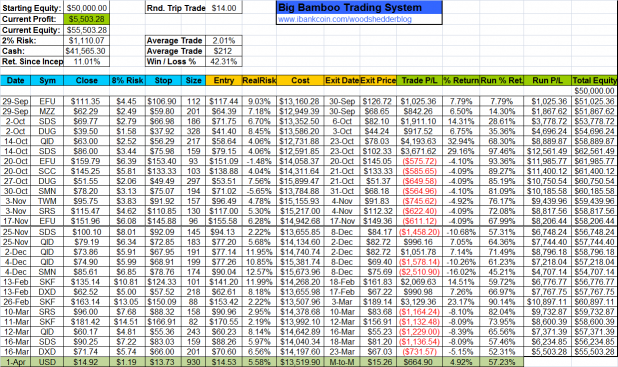
Updated Spreadsheet for Big Bamboo

Highlighted in a pleasing green hue is the latest Big Bamboo position: USD. Should this ETF have another strong close tomorrow, it will be sold on Friday’s open.

There were no new Big Bamboo signals for Thursday’s open.

Comments »

Big Bamboo Signal and System Update

On tomorrow’s open the Big Bamboo will go long USD, the Ultra Semiconductor’s ETF.

I will update the spreadsheet and post it tomorrow.

There has been quite a bit of stress-testing of the Big Bamboo entry signal, over the last several weeks. The entry has also been modified and tested as an exit, replacing the RSI(2) exit that is used for the Big Bamboo.

I am not very thrilled with the results. More specifically, the results show that while the entry and exit together create a system which has handily outperformed the S&P500, the system fluctuates enough that during extended periods of time it may become unstable. The drawdowns are acceptable; they just last for a long time. I’m not willing to put a lot of capital into a system that may be psychologically draining (it suffers extended strings of small to medium losses) when there are other, and possibly better systems to develop.

Bottom line: the Big Bamboo, even though it uses a different exit, may not remain a viable system. I am going to run more tests with the RSI(2) exit, but my suspicion is that the results will show that the entry edge is not stable, at least not as applied to SPY, DIA, and QQQQ. If it is not stable over the history of the underlying ETFs, I have little faith that it will continue to work on the diETFs, although it would be really nice to have the system catch bull run right here like it caught the bear raid in October and November of last year.

Comments »

Monte Carlo and the 357 System

Cuervo has posted over in the Peanut Gallery a simple trading system he calls the 357SPY.

Nothing can quite explain how the system trades like an equity curve, so I am including one below, of the 357SPY.
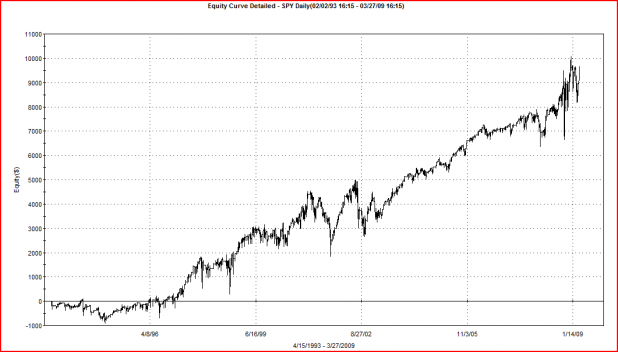
For these tests, I assume 10K per trade, without compounding gains, .01/share commissions, and no stops.
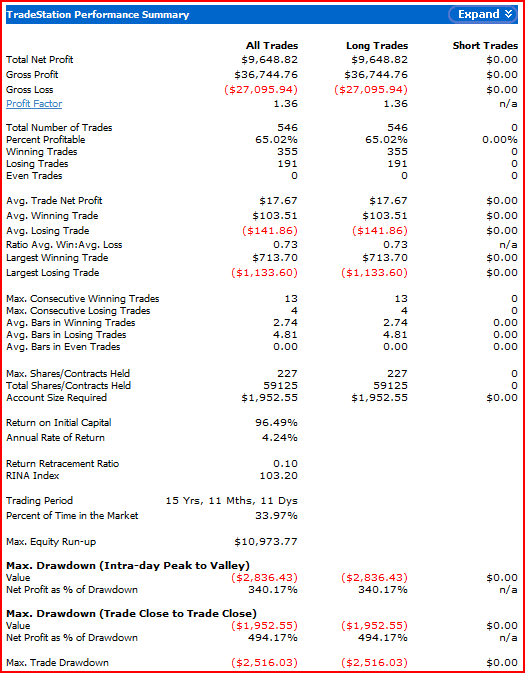
The results aren’t too bad. If nothing else, with a 65% win rate over 546 trades, the 357SPY may make a good timing indicator.

Still, we can run additional tests to determine how robust a system is.

Lately I have been experimenting with Monte Carlo simulations after discovering a neat, free utility called Equity Monaco. For the more discretionary traders out there, Equity Monaco will work for you as well because all that is needed for the calculations are the profit/loss figures from each trade, in a .txt file. For example, here are the results for the first 10 trades from the the 357SPY: -198.47 22.70 -85.80 39.96 24.64 81.00 28.99 17.84 -24.53 6.66

This Monte Carlo simulator takes the historical sequence of trade results from the 357SPY and scrambles their order, (randomizes them) then puts them back together, and re-calculates the results: The profit, drawdowns, wins in a row, etc., of the sequence of trades are then recorded. It then does this 1,000 more times, recording and plotting the results of each trial.

The Monte Carlo results will help us determine if the 357SPY’s results are due to chance, or because of a legitimate edge. In the tests below, starting capital of 10,000 was assumed.
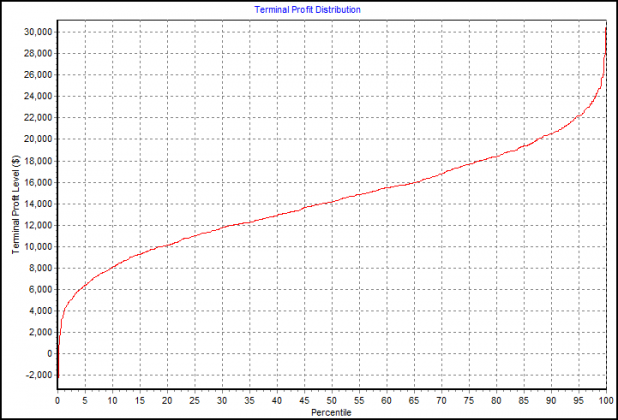
Terminal Profit Distribution shows that in 95% of the trials the 357 system made less than $22,000 in profit. However, in less than 5% of trials did it make less than ~$6,000.
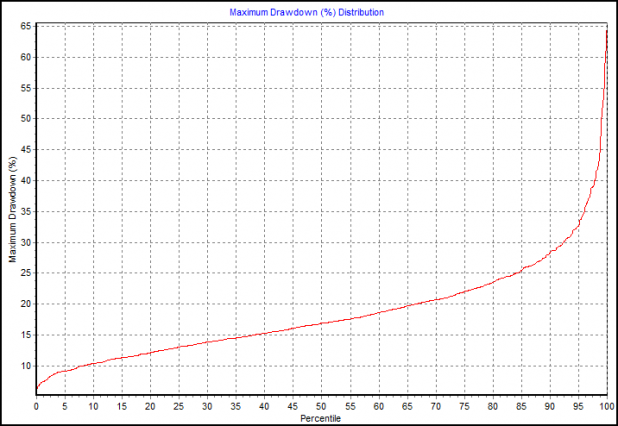
Max Drawdown (%) Distribution shows that 95% of the trials had drawdowns less than 34%.
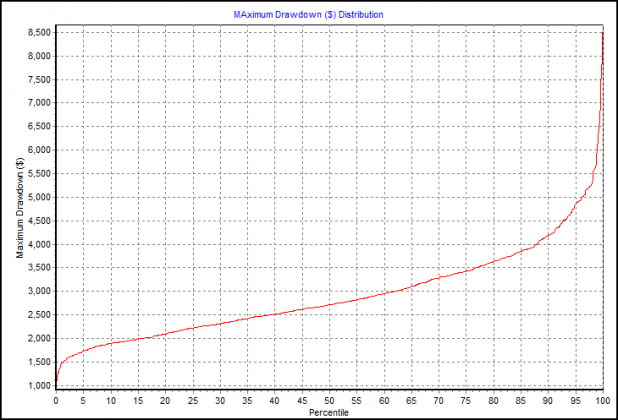
Max Drawdown ($) Distribution shows that 95% of the trials had maximum drawdowns less than $4,750.
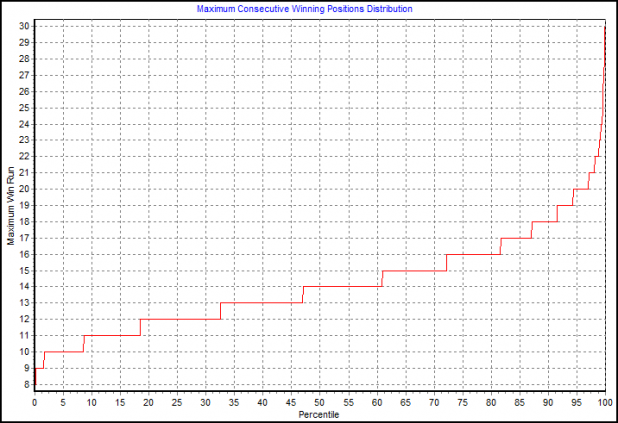
Max Consecutive Winning Positions shows that 95% of the trials had 20 or fewer wins in a row.
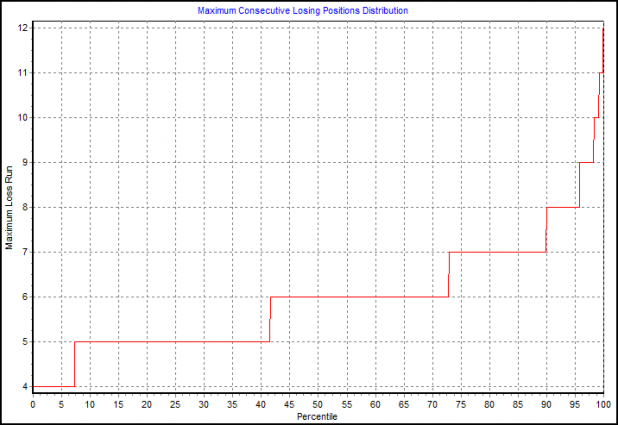
Max Consecutive Losing Positions shows that 95% of the trials had 8 or fewer losers in a row.
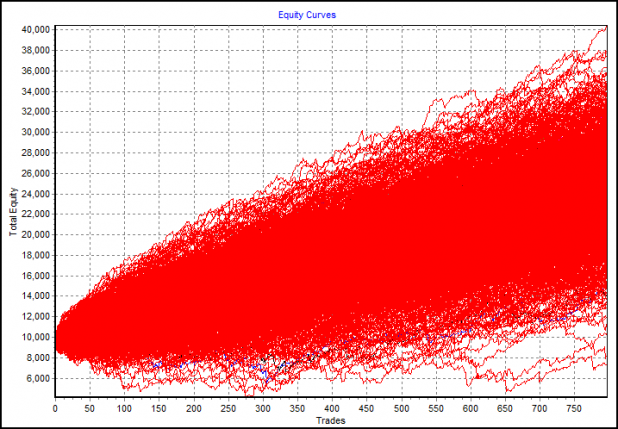
The Equity Curves show all of the possible equity curves from the randomized trade data. Of interest here is that only 2 trials had terminal equity of less than 10,000. (Look at the very right side of the chart for the two squiggly red lines beneath the 10,000 line.) A hand-drawn best fit line looks to me as if it might end somewhere between 22 and 24K. This would represent profits of between 12-14K over starting equity. The system, as tested on Tradestation shows a total equity of $19,648.82. While this might be slightly less than we would expect, the number still falls well-within the fat part of the distribution of equity curves.
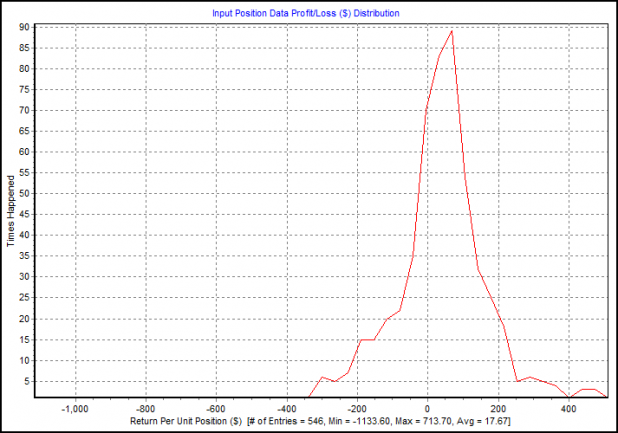
The distribution above is perhaps the easiest to understand. It shows the distribution of the raw trade data.

Summary

While the 357SPY can only be expected to earn a small but consistent single-digit return, one would likely not have lost money trading it (unless you were really, really unlucky) over the past 16 years (not including opportunity costs and inflation). In other words, one won’t get rich trading this system, but neither is he likely to lose money, if he trades it over a long enough period of time.

Of course the market is always free to undergo a regime change, which means that the 357SPY may stop working one day soon. However, the results of the last 16 years do not appear to have been achieved by luck alone.


Comments »

Red Hat Rally Caps

While I think the momentum may carry this rally farther, I am still looking to short it, sometime soon.

However, it is hard not to belly-up to the bull bar and drink from the gold chalice. Basically, who doesn’t love a good rally?

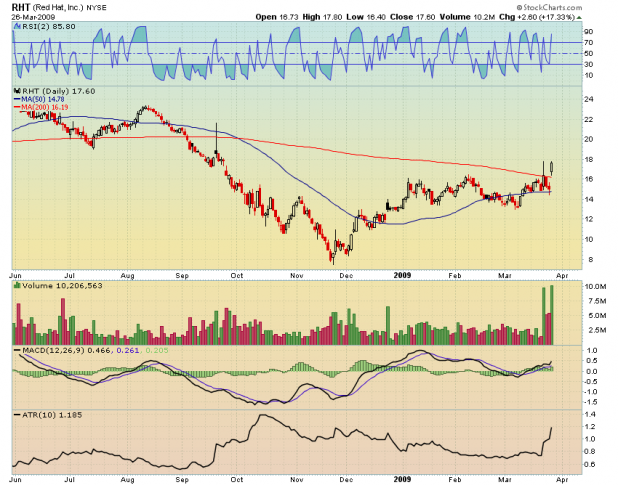
With those things in mind, I think it is good to keep an eye on what is working. One chart uncovered in my evening screens was RHT. I think this is a beautiful breakout. The volume coming into it has been incredible and has enabled the stock to break above a three-month-long flat base. Even though this is not a system trade, I’m not sure that I can refuse the allure of this particular chart.

The only problem I see is whether to buy it now as it approaches overbought, or wait (hope?) for a pullback.

Comments »

Buy the Close; Sell the Open?

I’ve been somewhat fascinated with a paper I found on the MarketSci blog. The paper is Returns in Trading vs. Non-Trading Hours: The Difference in Night and Day.

The paper is fascinating as it presents research showing a profitable trading strategy can be developed simply from buying the close of the QQQQ and selling the next open, day after day. The authors’ basic assertion is that the markets tend to be more bullish in the after-hours, at least on the QQQQ. Read the paper to understand why this strategy may not work as well on DIA or SPY.

Beyond presenting a profitable trading strategy, I believe the implications of the paper are that traditional strategies which trade open-to-open or close-to-close may be improved by switching to initiating positions at the close and liquidating them on the open. (This would certainly substantiate the aphorism that smart money trades the close while dumb money trades the open).

While it would be easy to take some of our existing strategies and apply a close-to-open scenario, I had hoped that I would first be able to get close to replicating the results presented in the paper. As of right now, I’m not close.

So all this build-up is not much more than an initial introduction to the idea of buying the close and selling the open, and an excuse for why I don’t have a great post tonight. Once I get closer to replicating the author’s results I will begin testing this idea across a few strategies and ETFs. Of course, I’ll share the results here.

Comments »

A Bullish Setup

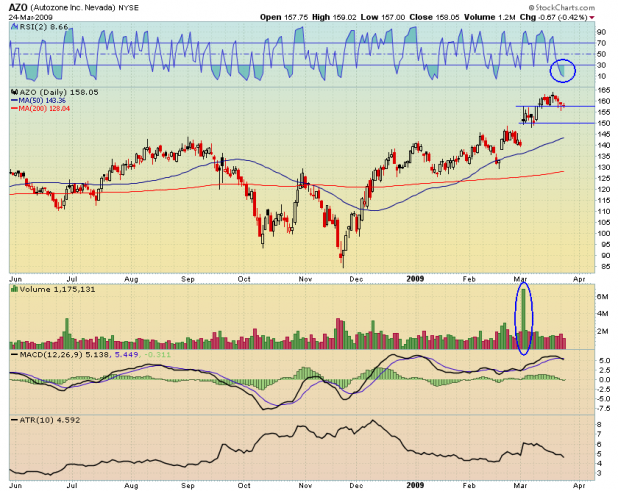
It has been quite some time since I posted a discretionary (non-system) setup. I was trolling this evening for some bullish looking pullbacks, as I’m considering some long exposure. This particular stock meets some system entry requirements.

The PPT ranks Auto Parts Stores 10th out of all industries, based on the technical score.

The PPT ranks AZO a buy based on the hybrid score of 3.03

I like the volume that came into AZO after the earnings release, which showed a 9% increase in quarterly earnings. I also like the stair-stepping the stock has been doing since the gap-up on earnings.

While I try not to think about the fundamentals, it makes sense intuitively that more people would be squeezing every last mile out of their vehicles, before purchasing a new(er) one.

A 1.5 to 2.0 ATR(10) stop would fit my style and risk profile. I would want to sell when RSI(2) rises above 70 or so, or after a couple of back-to-back up days.

Comments »