I’m not usually one to poach charts and images from other sources, but these were too good to pass up. A link to the entire .pdf is at the bottom of the page.
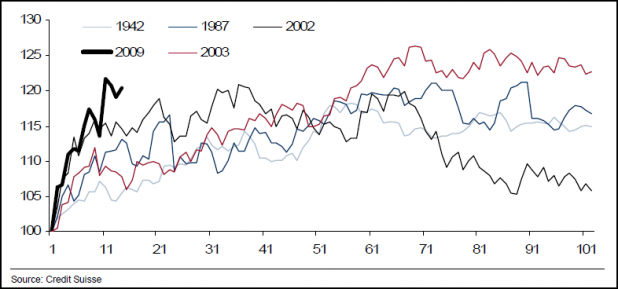
Exhibit 3: S&P 500 – 100 Days from Major Troughs
The commentary accompanying the charts is worth reading. The .pdf is here: Market Focus: The First 100 Days

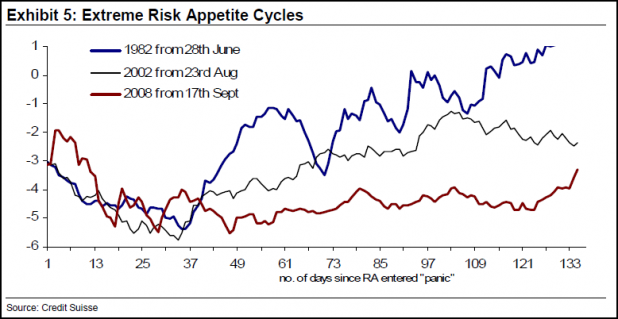
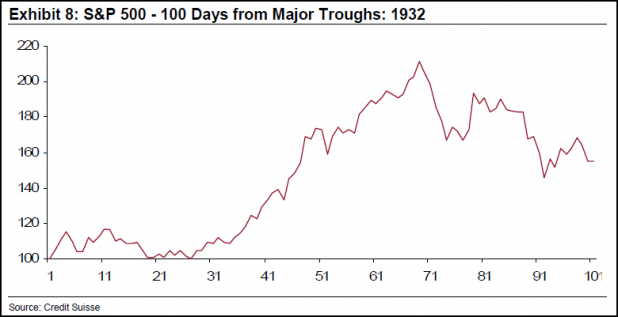


Interesting.
I’m not especially interested in long term entry until the DJI crosses 200 DMA.
Historically speaking, the DOW dipped below the 200 DMA on 10.21.29 (eight days before the crash) and had it’s first abortive attempt above the 200 DMA on 8.22.32 but didn’t really get it’s legs until 4.10.33
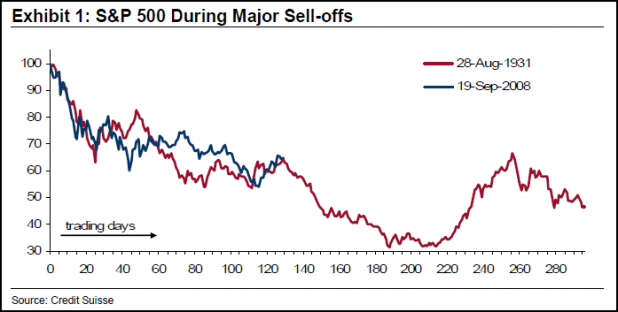
What concerns me is that first chart with the possibility of a really ugly slide about to hit again.
BTW, I ran an experiment and the inverse ETFs are mean-reversing as well. A 357DOG strategy would be up $34.61 a share since 6.29.6 whereas an inverse 357DOG (only buy when it crosses 3,5,7 and sell when it crosses downward again) would be down $26.22 a share since 7.7.6
very informative.
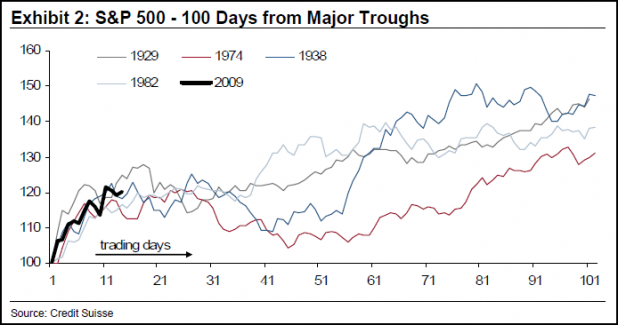
Exhibit 3, that sure would spook me out if i was long. 2009 has really deviated from the existing data, though we are going through a period that has no real comparison.
thx
Umm, the S&P500 doesn’t go back to 1931. I guess I’ll have to read the PDF to understand what the context and methodology of these charts are.