iBankCoin
Joined Nov 11, 2007
1,458 Blog Posts

Lazy Man: Testing Exits on an ES System, Part 5 Stops and Targets

As this series edges towards completion, we need to examine the effect of stops and profit targets on the system.

Lazy Man’s preferred stop triggers when a bar extends 50% of the length of the bar beyond the EMA20. (Remember the EMA20 is an important part of his entry criteria.)

I will be running the stop strategy with the time exit to get some baseline results. I will then optimize both the stop and the profit target.

What I will have then is an idea of what the best stop, profit target, and exit will be. The final installment will be to run the system on data from December 1st, 2008 to February 13th, 2009,  where the final optimizations will take place. After that, the system will be run on out of sample data, from February 16th to April 17th.

I will not include October or November in the testing due to the extreme volatility.

Results of Time Exits with and without Lazy’s Stops

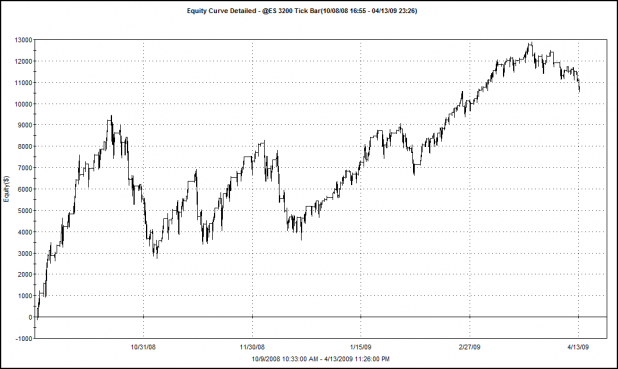
Long and Short Entry with Lazy Man’s Stop

Long and Short Entry without Lazy Man’s Stop

First of all, results with the stop and without the stop are not that much different. I figured this might be the case because the system is built to stop and reverse. What stop and reverse means is that if a long position is held, and the criteria for the short entry is met, then the long trade is close and the short trade is opened. This method has a stop built in. Therefore, adding a stop that triggers before the system reverses should theoretically reduce drawdowns while maintaining most of the profitability.

In fact, the results do show this to be true (somewhat). The average losing trade, with stops, is 12% smaller than the average losing trade without stops, while the average winning trade, with stops, is only 3% smaller  than the average winning trade without stops.

The downside to using Lazy’s stop with this system is that the average trade is 28% smaller than when not using stops. This is because some losing trades (which stopped out) would have reversed to be winners, before causing the system itself to stop and reverse.

Of course there are many benefits to using stops, with the psychological advantage being the primary one, but stops also allow for trades to be engineered to be more uniform, which lowers the standard deviation of results. Stops also allow for capital to be deployed elsewhere, rather than sitting in a losing trade.

All things considered, I’m not sure that stops are adding much to this system.

A Few Words About the Time Bar Exit

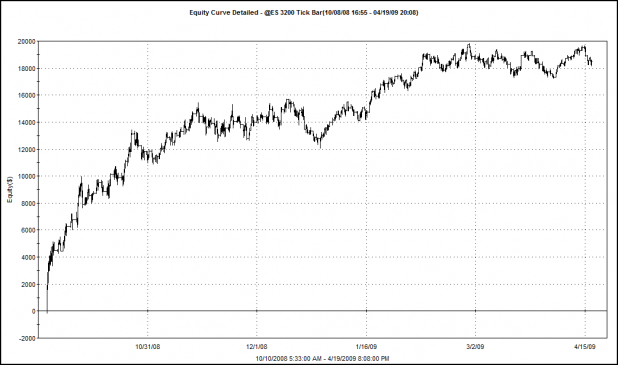
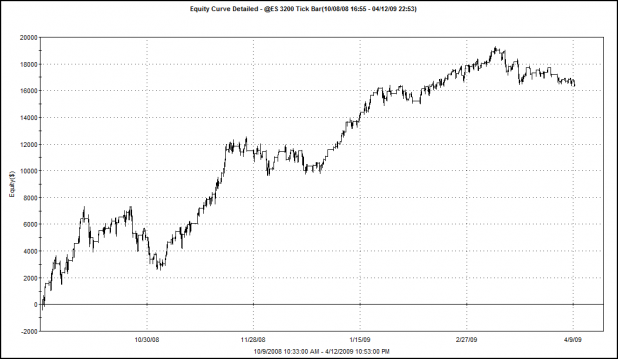
Without the time bar exit, but still using a stop, the system is profitable but the equity curve is ugly. The system gains about 9K but the swings are very volatile. Using the time bar exit allows us to see the system perform with stops, coupled with a very simple exit strategy.

Equity Curve: Long and Short Entry with Lazy Man’s Stop

I Had a Bright Idea…

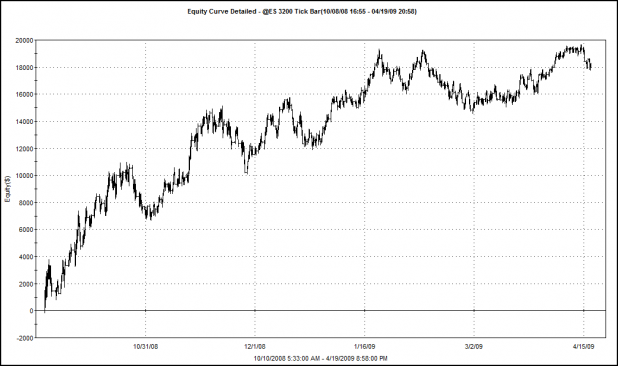
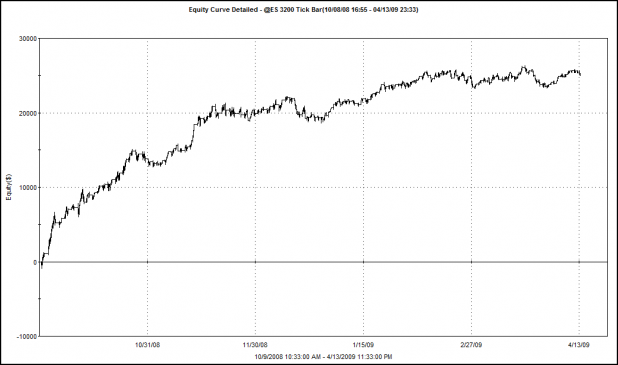
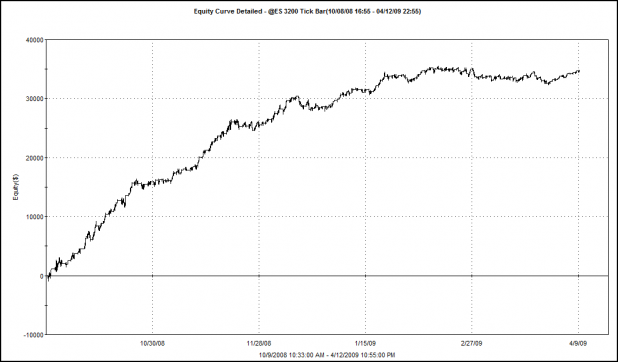
What if we let the system run, no stops, no time exits, constrained only by the nature of its stop and reverse entries and the 9:30a.m. – 3:00p.m. time frame? The equity curve is below. Note that the system makes almost as much money, and the equity curve is very similar to the system running with stops and time exits. What should be apparent is how the stops and exits smooth the curve.

Equity Curve: Long and Short Entries with No Stops or Time Exits

Summary:

Well folks, I had a lot more planned for this post, but it turns out that I have more ideas than I have time tonight to flesh them out.

The next installment will see the results of a different stop and some profit targets.

Comments »

Trying Out AmiBroker

I’ve been frustrated with Tradestation’s platform fees and the inability of the platform to test a strategy over a portfolio of securities.

After trying out AmiBroker over the last day, I am really impressed. Although it requires a data feed, the rest of the platform has been intuitive and a lot of fun to work with. I have a strong feeling that I will not need much else to take backtesting and system development to another level.

Look for some new AmiBroker generated reports soon.

As AmiBroker interfaces with Interactive Brokers for real-time data and charting, I am hoping that I can eventually get rid of Tradestation.

Comments »

iBC’s PPT

Fly has made available a one-day pass to the PPT for $2.00. Access will coincide with the final voting for the newest blogger. It looks like it is going to come down to Cuervos or Jake.

For 2 bucks, you can take The PPT for a spin, and participate in the democratic process, ensuring your voice is heard about the newest blogger.

Comments »

MACD and Volume Divergences Signal Caution

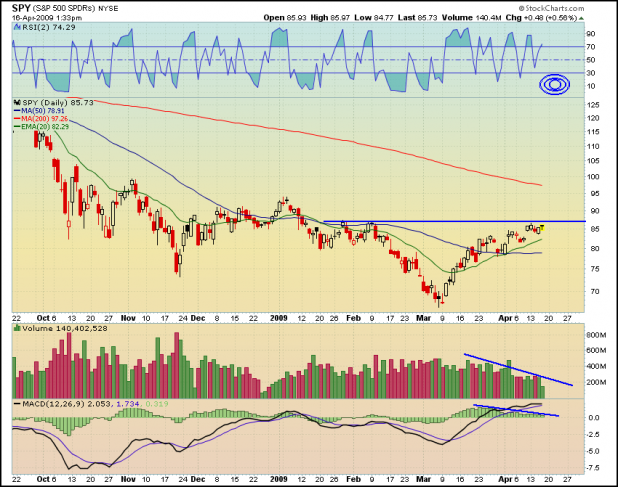
While I’m not a big fan of the MACD to guide short-term trading decisions, I do like to use it to highlight divergences. Right now there is a significant bearish divergence on the SPY, on both the MACD and volume.

The SPY is struggling to make new highs on ever decreasing volume, and the MACD is edging closer, day by day, to crossing beneath the zero line.

If you are heavily invested long, caution is advised.

At the very least, we may see some consolidation at these levels. If so, I’d watch the area of the 20 day simple moving average (exponential average shown on the chart) and the 50 day average. Both should provide adequate support, unless there is a swift change in sentiment.

I will be a dip buyer if RSI2 can get down towards the target area highlighted on the chart, and I will be selling-short should the market break to new highs, any day soon.

This area for me looks like no-mans land, and with the divergences highlighted above, I’m going to wait for lower prices before putting any money to work.

Comments »

Adding Three Links to Blogroll

All three of these bloggers have a systems trading or quant bent to them.

One of them, Trading The Odds, is fairly new, but Frank has doing a great job since day one.

BZB Trader has been around for quite some time, but I have just been lazy about adding him to the blogroll. He should have been added a long time ago.

Finally, Read the Prospectus has been writing script for Think or Swim. I know a lot of you use TOS, and if you are interested in systems trading with TOS, you should check out his blog. Some of you may remember that Prospectus used to post in the PG, and always used to receive high rankings.

Comments »

Lazy Man: Testing Exits on an ES System, Part 4

Part 4 will focus on using Bollinger Bands for exits.

Specifically, if the bar closes outside the upper (long entry) or lower (short entry) bands, the trade will be exited on the open of the next bar. This is a very basic exit, and could easily be tweaked. For example, an exit could triggered if the high (or low) of the bar is above (or below) the bands, rather than requiring the bar to close outside the bands.

The Bollinger Bands were built around a simple (not exponential) 20 day moving average.

Let’s look at the long entry first.

Bollinger Band Long Exits

The spreadsheet below shows the results of the long entry coupled with the Bollinger Band exit.

The standard 2 deviation band works the best. The % profitable is good, but the average trade of $16.65 means that 1/3 E-mini point will be captured, on average.

The equity curve below shows the entry coupled with a 2 standard deviation Bollinger Band exit:

Bollinger Band Short Exits

The spreadsheet below shows the results of the long entry coupled with the Bollinger Band exit.

The 1.5 standard deviation band was favored by the short entry. The % profitable is very high, and the average trade shows that each trade may harvest better than 1/2 an E-mini point. Still, the win/loss ratio is very low.

The equity curve below shows the entry coupled with a 1.5 standard deviation Bollinger Band exit:

Putting It All Together: An Equity Curve of the Long and Short Entry with the Optimized Exits of 2.0 For the Longs and 1.5 for the Shorts:

Net profit of $25,200 represents an annualized return of 252.20%. The % profitable drops significantly to 57.45%. Average trade is $38.74, or not quite a whole E-mini point.

The astute observer may wonder why, when the longs and shorts are combined, the equity curve smooths out, the % profitable drops, and the sum becomes greater than the parts.

From what I can tell after looking at thousands of these trades over the last week, when the system is allowed to go long and short, it will often close a short trade and go long, or vice versa, before an exit is triggered. Basically, it stops itself out and changes direction with the trend. This hints that when I start testing stops, they might actually improve performance (it is often hard to find a system that improves when stops are added).

I think this is very very important for traders to consider, especially those who do not like to use stops. The system does not care that it took a trade in the wrong direction. When it gets a signal to go in the opposite direction, it closes out the losing trade and attempts to catch a change in the trend.

Comments »

Lazy Man: Testing Exits on an ES System, Part 3

As I am running out of time to get this information out for Lazy Man to digest before the market opens, I am going to report on only one exit tonight: the RSI(2) exit.

I had to make some minor changes in the way the testing was performed. In prior tests, all trades were executed at the close of the bar in which the trigger occurred. In order to avoid some problems, I changed the code to have the exits execute on the open of the next bar. To be clear, the signal is still generated at the close of the bar, but the trade is not made until the open of the next bar. If this is confusing, let me know in the comments section and I’ll flesh it out a bit more.

The RSI(2) Long Exit

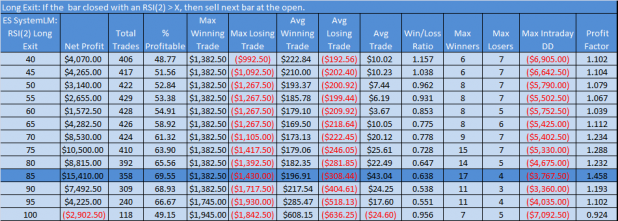
The spreadsheet below shows the results of the entry coupled with the RSI(2) long exit:

Note that using an RSI(2) exit of greater than 70 would have yielded decent results. Also note the % profitable is the best we’ve seen yet at almost 70%.

One potential problem is that the average winning trade is only 2/3rds as big as the average loser. It is possible that this will be improved when stops are added.

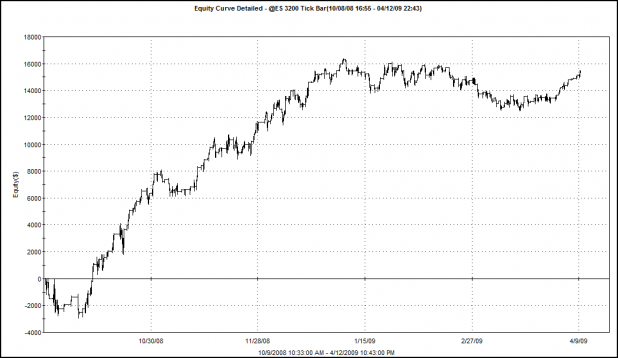
Below is the equity curve generated by the RSI(2) long exit.

The RSI(2) Short Exit

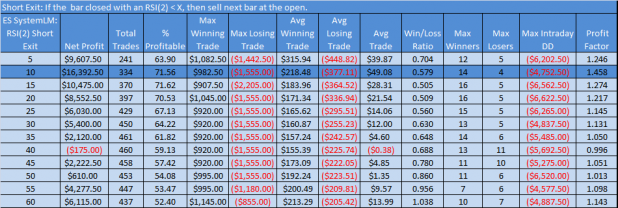
The spreadsheet below shows the results of the entry coupled with the RSI(2) short exit:

Similar to the long exit, exiting after an RSI(2) reading below 20 shows promise. The percentage of profitable trades is even better with some exits exceeding 70% winners. The size of the winners compared to the losers is still an area of concern.

The average trade is approaching $50.00 which means that each trade will capture (on average) one E-mini point.

Below is the equity curve generated by the RSI(2) short exit.

Longs and Shorts Combined

Below is the equity curve for the combined long and short entries and exits:

This represents an annualized return of 294.90% with a win percentage of 65.70%.

The RSI(2) trigger for the longs was set at 85 and the short trigger was set at 10.

Caveats:

Using an RSI exit with this system presents some difficulties. The primary problem is that an exit can executed on a bar which also fits the criteria for entry. What this means in backtesting is that the trade is closed on the open of the bar, but then re-opened at the close of the same bar. I did not re-do the code to work around this issue.

Another problem is that some trades are entered when the exit criteria has already been surpassed. For example, the system may enter long with RSI(2) that is already greater than 85. When this happens, the system waits for RSI(2) to dip beneath the trigger level (85) , and will sell once it crosses back above 85.

When the system runs both longs and shorts, a short trade is closed out if the criteria is met for a long entry. If the system is long and the criteria is met for a short entry, then the long trade is closed and a short is entered. This adjustment helped the long side trades which leads me to believe that stops might improve results when trading only one side (long or short, but not both).

What’s Next?

Bollinger Band exits have been tested and show promise. The next installment will present the results.

Comments »