iBankCoin
Joined Nov 11, 2007
1,458 Blog Posts

A Quick Look at RSI(14)

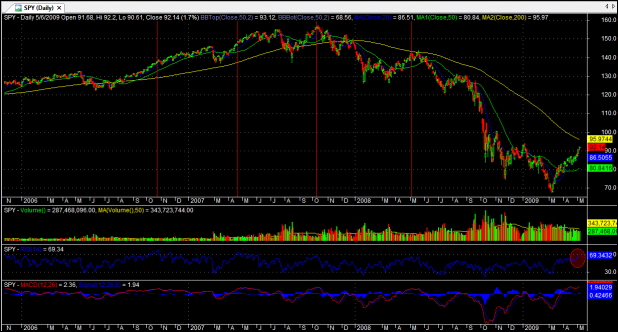
I have read that the standard Relative Strength Index setting of 14 is not very predictive, but I have never tested its effectiveness for myself. However, I was messing around with AmiBroker’s charts and noticed that it appears that RSI(14) has been effective in marking intermediate term tops.

The red, vertical lines mark RSI(14) peaks over the last 3+ years. The current reading is highlighted with a red-tinted oval.

I think it is notable that the current reading of 69.34 has not been achieved since April-June of 2007.

I will create a study soon to test the accuracy of RSI(14) for forecasting market turns.

Comments »

Confessions of a System Trader: 5/6/09

If I’m honest with myself, I’m officially pissed off about missing this rally. I’ve been telling myself for weeks not to worry about missing out, that I’m executing my plan. And I have been, faithfully, but it turns out that maybe it has been the wrong plan for the current conditions.

Mean reversion systems have been my development focus, since they have been working really well for the better part of a decade. Knowing full-well that MR systems tend to under-perform in a strongly trending market, a system based on momentum has been very high on my systems-to-develop list. I erroneously figured that there was no real rush though as 2009 would see continued volatility and would likely be characterized by mostly rolling, sideways action. Rolling, sideways action and volatility is excellent for MR systems.

As we all know, the first four months of 2009 have been very strongly trending, with very few spikes or pullbacks. The first two months were characterized by a steadily downtrending market which offered some shorting opportunities (if you didn’t mind shorting into oversold conditions), but any long-biased trades were killed.  From March to the present the market has been just the opposite: strongly uptrending, offering many long trades (if you don’t mind buying into overbought conditions). And of course, shorting since the March lows has been brutal.

Simply put, 2009 has been the year of Momentum. 20% straight down, and now 30% straight up. I have been sticking with my MR systems, and it has been the worst possible environment for these systems. My account is in a drawdown for the year. Not an awful drawdown, but negative for the year, nonetheless.

Regardless of the pain and account-envy I’ve endured over the last couple of months, I am going to continue to execute my plan, and that plan is to only trade when I understand the edge. In hopes of finding some balance before the year is lost to me, I am working to crank out a good momo system. By the time it is finished, I’m sure the market will be right back in reversion mode. That is just how things seem to go.

I am 25% short the SPY, as of Tuesday’s open. I have been desperate to pick up long exposure, and while I have a great system for picking up trending stocks, it was not designed for a market that does not pullback. I have no idea how much longer this trending will continue, but I know that it will certainly reverse as soon as I give up mean-reversion. Therefore, the beatings for me have to continue.

Comments »

Extremely Overbought Stocks

Below is a list of stocks with a RSI(2) reading above 99. If the market reverses tomorrow, I suspect these names will be hit with profit-taking, as they should be after the runs they’ve had.

However, with dip-buyers running rampant, I would not want to overstay my welcome, were I to short some of these names.

Please click twice on the list to see it much larger.

Comments »

SPY Fibonacci Levels and Other Thoughts

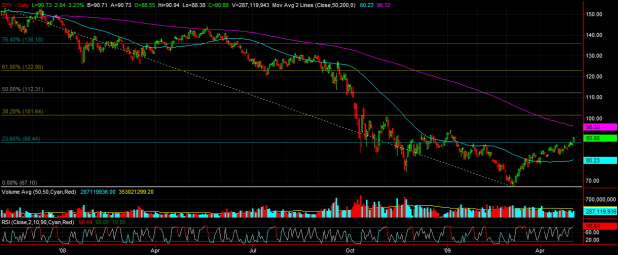
Click on the above chart to enlarge it. It shows the Fibonacci levels drawn from the October 08 top to the March lows.

What is about to follow is my own unscientific musings coupled with some proprietary edge stuff. Consider yourself warned as that is the recipe for a dangerous concoction.

It is my opinion that the SPY has climbed far enough and fast enough that the potential short-term upside is now about equal to the potential short-term downside, should a pullback EVER happen. I do not expect much upside above the 200 day, in the short-term, and I expect the 50 day moving average to be tested.

The 200 day moving average is, and has always been, a very obvious target. This average is also a very obvious place for a pullback to occur, as I would expect resistance to be strong. However, the QQQQ blasted right through the 200 day without looking back, so there might not be as much resistance there I as think. A rally to the 200 day over the next week will show the SPY gaining ~30% from the March intraday low.

The Fibonacci levels show the 38.2% retracement at $101.64, or about 10 points higher than today’s close. Should the SPY reach this level, it will have gained 34% from the March intraday low.

While I do not expect this to happen soon, I would not be surprised to see the market attempt to retrace all the way to the 50% level, or $112.31. This is just above the October Armageddon gap-down. A run to the 50% retrace would put the SPY 40% higher than its March intraday low.

Volume, relative to the last six months and the 50 day moving average, is low. However, compared to April 08, volume is slightly elevated. Frankly, it is the price action that has me more concerned than the lower volume.

Cryin’ won’t help you, prayin’ won’t do you no good,
Now, cryin’ wont help you, prayin’ won’t do you no good,
When the levee breaks, mama, you got to move.

So the question is, how much farther can the rubber band be stretched before it snaps back? I am positioning for the snap-back to begin soon. It may take a major moving average or Fibonacci level to initiate the pull-back, or traders may anticipate that these levels will provide resistance, which means the pullback may come before price hits the targets.

What is confusing me is that a proprietary abnormal market filter will stop me out of my impending SPY short before the 200 day is reached. To be clear, this proprietary measure is signaling that the market is on the verge of going parabolic, and I do not want to be short if/when that happens (does that mean the rubber band breaks?), but I also believe that a pullback is imminent.

Either way, when the levee breaks, you got to move.

Comments »

Three Pullbacks for Monday

The beatings for shorts will continue, it seems, forever. I have been trying to short a strong close, into extreme overbought conditions, and have been trying to buy a weak close, into extreme oversold conditions. Unfortunately, it seems that Mother Market knows my playbook and refuses to give me any kind of extreme conditions to play.

Oh well, the market keeps going up, so I will keep looking to buy pullbacks. Here are three for Monday.

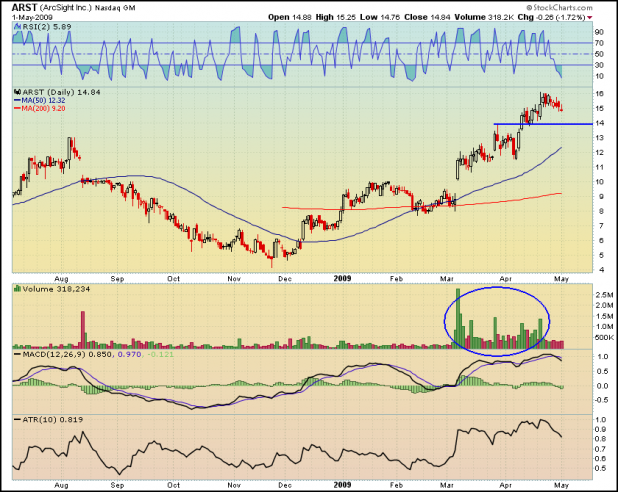
[[ARST]] Nice accumulation on volume. Its obvious that volume on up days is overwhelming volume on down days.

Is it time for this one to roll over, and consolidate? Or, does ARST have another bounce ahead?

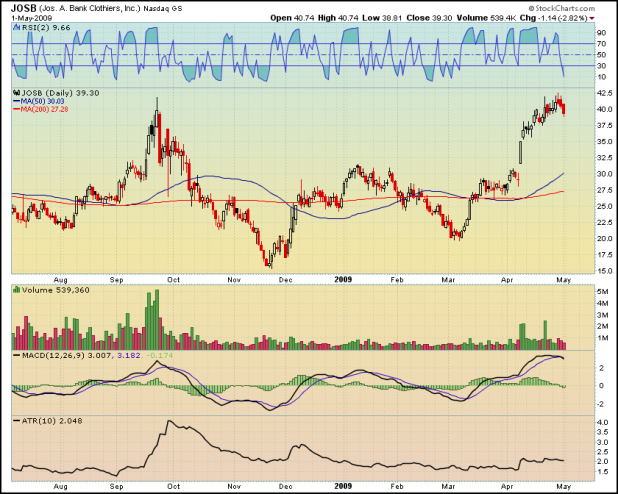
[[JOSB]] doesn’t have quite the accumulation on volume as ARST. However, this is the first pullback after a huge gap-n-run.

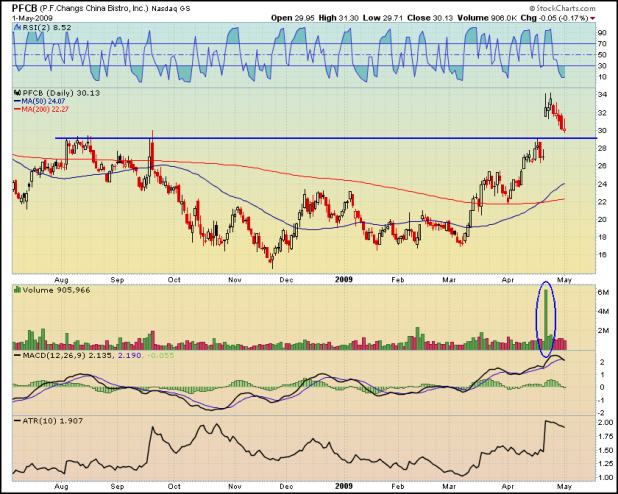
[[PFCB]] is in the middle of a really interesting looking pullback. I love it when a stock breaks out, and then tests the breakout pivot. Unless the volume surge was only shorts covering, this one might see some buyers move back in soon.

Comments »

Lazy Man’s ES System: Out of Sample Results

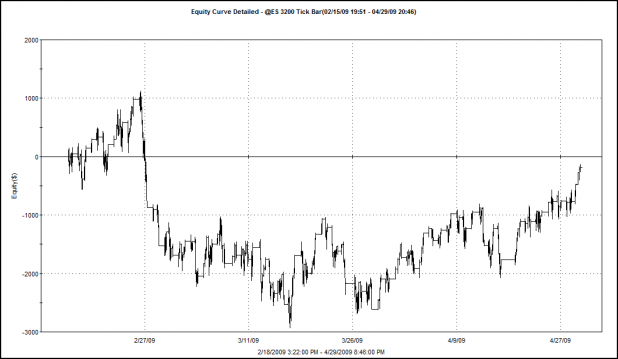
Equity Curve, Lazy Man System Out-of-Sample
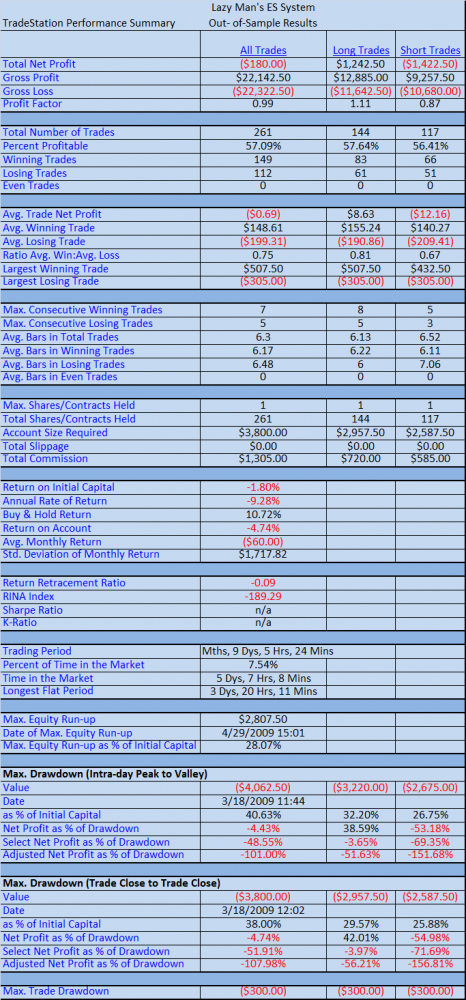
As evident from the above report, the system did not perform nearly as well during the out-of-sample testing. There are likely many reasons for this, but here are several that I’m considering:

1. The system is still working well but has just entered a drawdown or phase of under-performance. Or…

2. Due to the lack of more than 6 months worth of data, we do not know whether this type of under-performance is normal or abnormal. (More on this at the end) Or…

3. The system was curve-fit to the in-sample data set.

————————————————-

The system was tested on data from 2/16/2009 until today, 4/29/2009. The same parameters were used:

RSI Long Exit above 85 and RSI Short Cover below 10

Profit Target: $700.00

Stop: $300.00

Observations…

As I was looking over the trade-by-trade report, I noticed that not one time did the profit target trigger during this test. This means that every exit was triggered by the RSI level. Obviously, something changed between the in-sample and out-of-sample data. My guess is that the out-of-sample data was less volatile, meaning the profit targets were never reached. From December 2008 to the present, we know that volatility has decreased.

And this brings up an important point. When one uses static profit targets or stops, he or she risks that increasing or decreasing levels of volatility will render these static targets and stops ineffective, unless constant readjustment is applied.

Beyond the example demonstrated in this test, anyone using fixed-percentage stops and static profit targets during October and November of last year found out the hard way that both the stops and profit targets could have been doubled.

Why then would I use these stops and profit targets for this system? Primarily because Lazy was curious as to how the system would back test using them. I have to say that I was curious as well. In the end, it seems that this system should adjust with volatility.

What Now?

These experiments could continue for much longer than most normal people would want to read about in a blog. From here, it is natural to wonder though: Which of the exits (besides RSI), if any, performed well over the out-of- sample results?

I will stop here though, as I think the Lazy Man system needs to marinate for a time, and I need to move on to other ideas. I will soon put all of the posts about this system on one page to make for easy reading / referencing.

Loose Ends

It was suggested that a Monte Carlo analysis would help in evaluating whether a system is robust or not. I wanted to run a MC on this system, but had neglected to do so. Bman’s comment reminded me to do so. Below are a few graphs of the data from the first in-sample optimization.

Monte Carlo Simulated Equity Curves
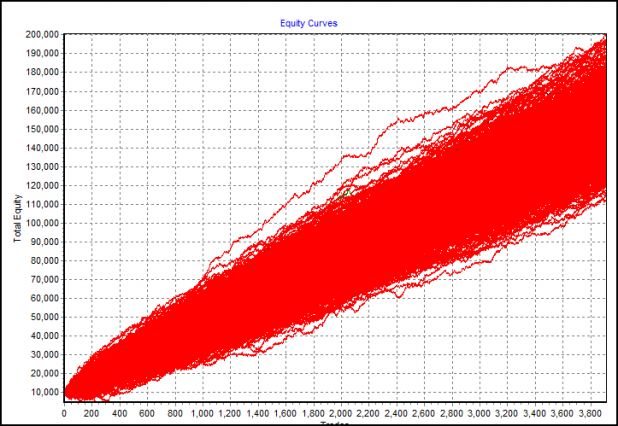
This represents 1000 different equity curves with each curve being made of a random ordering of the actual system trade results.

Looks great, huh?

Max Drawdown Distribution
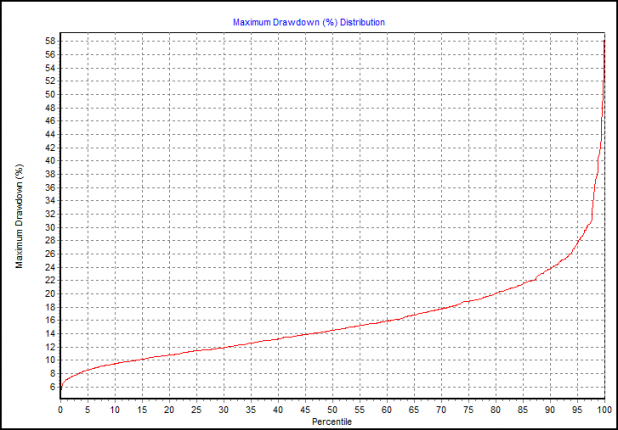
This graph shows that 95% of the trials had a percentage drawdown of 28% or less.

Looks great too, no?

It does, until these results are contrasted with the results from the out-of-sample tests where the system has experienced a drawdown from starting equity of 28.22%

Simply put, neither I nor the data know what we don’t already know.

The data set looks great, in sample, but the out-of-sample run produced is similar to one of the unlucky red lines in the very bottom-left quadrant of the equity curve graph. Look for the curves that immediately dip and lose money.

When I run the Monte Carlo on the out-of-sample data, the graphs demonstrate truly horrendous performances. The out of sample results show a system where 44% of the trials lost greater than half the starting equity. The Max Drawdown graph shows that 95% of the trials had a drawdown of 64% or less. This is quite a contrast to the Monte Carlo results from the in-sample data.

Without a doubt, more than six months of tick data is required for further development of Lazy Man’s system.

I will continue to monitor this system and post updated results and equity curves from time to time.

Comments »

Covestor Begins Accounting for Cash

The critics of Covestor have long opined that the site’s accounting did not present an entirely accurate picture of an investor’s skill as cash was not accounted for.  This discrepancy made the system easy to game as an investor could take a series of very small positions, and if the positions were winners (or losers), his or her account would shoot up (or get taken down) by the sum total of the percentage gains (or losses). For example, a trader with an account worth 10K could buy $100.00 worth of a stock, and if he sold the stock for a 10% gain, his account would show a 10% gain, rather than a gain of 1/10th of a percent.

It appears that Covestor has made the change to allow accounting for equities and cash.

If a visit is made to my Covestor fact sheet, the graph which shows my performance will now allow users to click on a tab which reports my performance with cash and equities combined, or with equities only.

Except for brokerage issues (Covestor does not allow auto-reporting from all brokerages, but they do accept auto-reporting from the majority of brokerages) this development makes it possible for every trader/investor who wants to prove his or her investing acumen to do it accurately and transparently.

If transparency is important to you, consider asking your favorite stock trader to prove him or herself on Covestor.

Comments »