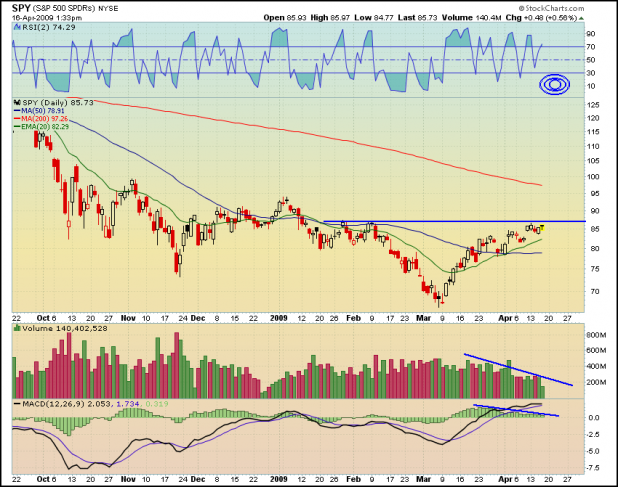
While I’m not a big fan of the MACD to guide short-term trading decisions, I do like to use it to highlight divergences. Right now there is a significant bearish divergence on the SPY, on both the MACD and volume.
The SPY is struggling to make new highs on ever decreasing volume, and the MACD is edging closer, day by day, to crossing beneath the zero line.
If you are heavily invested long, caution is advised.
At the very least, we may see some consolidation at these levels. If so, I’d watch the area of the 20 day simple moving average (exponential average shown on the chart) and the 50 day average. Both should provide adequate support, unless there is a swift change in sentiment.
I will be a dip buyer if RSI2 can get down towards the target area highlighted on the chart, and I will be selling-short should the market break to new highs, any day soon.
This area for me looks like no-mans land, and with the divergences highlighted above, I’m going to wait for lower prices before putting any money to work.


Wood what indicators do you use for short term trading?
Price levels only?
RSI, primarily. I also use moving averages and support and resistance.
Bull tail last 15 minutes?
Wood,
How do these indicators look for the Nasdaq 100?
Lazy you still long that ES position from yesterday?
Red, they look the same on QQQQ, except the Qs have broken through resistance and are going to take a stab at the 200 day average. Volume has not fallen off quite as much on the Qs as on the SPY, but there is still a divergence there, as well as on the MACD.
I have not taken a discretionary trade all year, but I may go ahead an put in a limit order to short the Qs right at the 200 day.
Redshark,
Nope – it hit my PT at 854.75 early last night for 14.75 pts.
I was itching to go long today based on the price action yesterday and last night (monster hits to the ask before the China news and them again this morning). I called this all out live in comments from the “part 4” blog.
Jumped back in at 848 (11:30) and out at 860 today.
Keep your eye out – Wood says he has an old ES strategy that picked up 9 points today – I’m curious.
Wood,
Respect was definitely given to that resistance line at 870. I want to see this punch 900 but…
Get this shit:
One day chart of the SPX – we are at the upper Bollinger Band (NOT TOUCHING YET).
Last punch through was Jan 5th – spent 3 days there and promptly sold off 130 points without pause.
Before that, we punched on Sept 2nd – one day there and sold off 260 points.
Before that you ask? 5/19/08 – the day before we began a 240 point sell-off.
We have NOT punched the band yet but it is pinching and we are getting damn close.
I normally don’t trade BB’s like that when I daytrade – I actually like to see it at the band as a trend strength indicator. This pattern, however, might be worth watching.
Woodshedder,
FXI is another similar chart. The breakout is more dramatic.
I would not be surprised to see SPY breakthrough, but I do not have enough conviction to be LONG of it. I would rather take my chances with QQQQ, and moreso FXI with stops in place of course.
Just my $0.02.
Nice call Wood.
You nailed the “dip” within a day.
We are now at our worst MACD level of this entire rally.