iBankCoin
The first hit is always on the house.
Joined Aug 2, 2009
1,847 Blog Posts

I AM RIGHT

The biggest tell at the table here is that our basket of growth names have only paused this week. Markets sell hard yesterday, these stocks pause. Market attempts to bounce here today, these stocks rip.

The action in these names will dictate the next 10% move in the market. This is why I wanted TNA yesterday. It’s action mirrors the behavior in stocks like TSLA, SCTY, YELP, P, KING, WDAY, etc.

Either way, this is an actionable battle ground here; long or short. The reason I am focused so heavily on these stocks, is that when the market moves, these stocks will move 3 to 4 times beyond what the market does moving forward. I hate being early, but its the cost to make the best gains on a move.

After hours, let’s revamp the watchlist for next week.

OA

Comments »

OA SELL: TNA

Despite a great fill, I can’t hold this overnight.

What’s killing me, is NONE of this is being reflected in all these asshole stocks we trade. VIX exploding, market waterfalling, and all these shit stocks are holding their lows this week.

Kill me.

Comments »

PLACE YOUR BETS

Take four things into consideration here:

How growth stocks are behaving this very moment.

The underperformance of the Russell 2000, as it pertains to a signal of risk appetite.

The speed of the market.

Crowd behavior and sentiment.

Long or short, where are you placing your chips?

Comments »

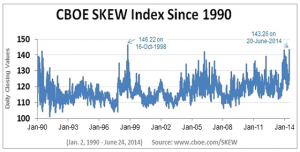
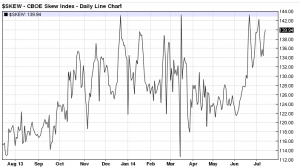
Chart of the Day

skew

skew2

There has been a year long argument, as to whether this is 1998 or 2000 redux.

In fact, we looked at charts of 1998 last night, and have done so all year long to serve as a reference and comparison.

What say you?


Note*** About the Skew Index…

Introduction to CBOE SKEW Index (“SKEW”)

The crash of October 1987 sensitized investors to the potential for stock market crashes and forever changed their view of S&P 500® returns. Investors now realize that S&P 500 tail risk – the risk of outlier returns two or more standard deviations below the mean – is significantly greater than under a lognormal distribution. The CBOE SKEW Index (“SKEW”) is an index derived from the price of S&P 500 tail risk. Similar to VIX®, the price of S&P 500 tail risk is calculated from the prices of S&P 500 out-of-the-money options. SKEW typically ranges from 100 to 150. A SKEW value of 100 means that the perceived distribution of S&P 500 log-returns is normal, and the probability of outlier returns is therefore negligible. As SKEW rises above 100, the left tail of the S&P 500 distribution acquires more weight, and the probabilities of outlier returns become more significant. One can estimate these probabilities from the value of SKEW. Since an increase in perceived tail risk increases the relative demand for low strike puts, increases in SKEW also correspond to an overall steepening of the curve of implied volatilities, familiar to option traders as the “skew”.

Comments »