The data is the data. It isn’t what you want it to be or think it might mean. The term ‘overbought’ is often synonymous with dangerous or overvalued. If I didn’t have Exodus available to me to crunch these large data sets, I’d likely be in the dark–just like the lot of you. But, unlike the misers and the scoundrels out there who refuse to join the league of top hatted gentlemen, I am afforded the data and I parse it…regularly.
On Tuesday, May the 24th, 2016, I posted this inside of Exodus, alluding to the systemwide OB signal that had been festooned all over the site.
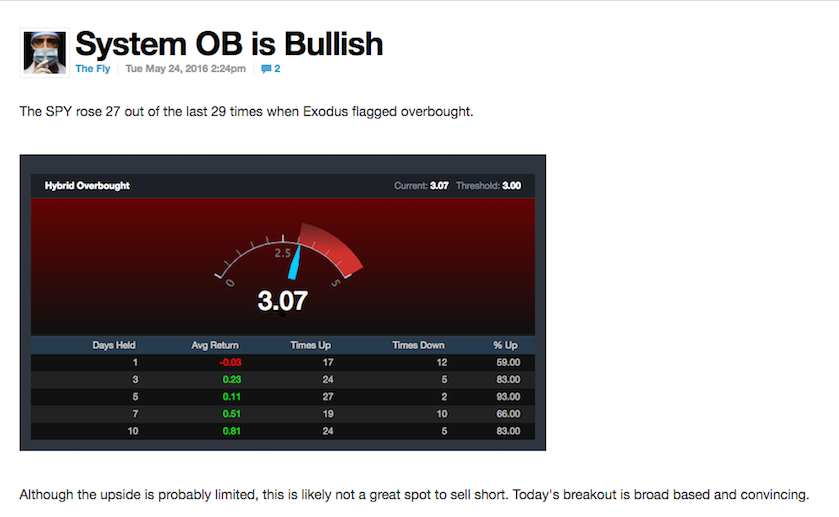
Those numbers are even better than the oversold stuff I tout. Buying into an Exodus overbought signal has yielded a 93% win-rate over the past 3 years. Plainly, it’s as good as gold. This isn’t Fly trying to have it both ways, being bearish as shit and then pointing to his time machine that was bullish, always right and never wrong.
The algos aren’t my opinions. My opinions, wrought with emotions born during a stark childhood that was rife with wanton violence and mischief, were indelibly misplaced over the past week.
As of the close on Friday, just 43 stocks were considered to be overbought, that had any backtest meaning. Only a handful of stocks were oversold.
My free cash flow portfolio screen is up nearly 12% over the past 3 months. It automatically includes companies rich in cash flow, high in growth, and with great gross margins. Believe me, I’ve studied just about every combination of fundamental analysis to produce the best possible returns and this one reigns supreme every single time.
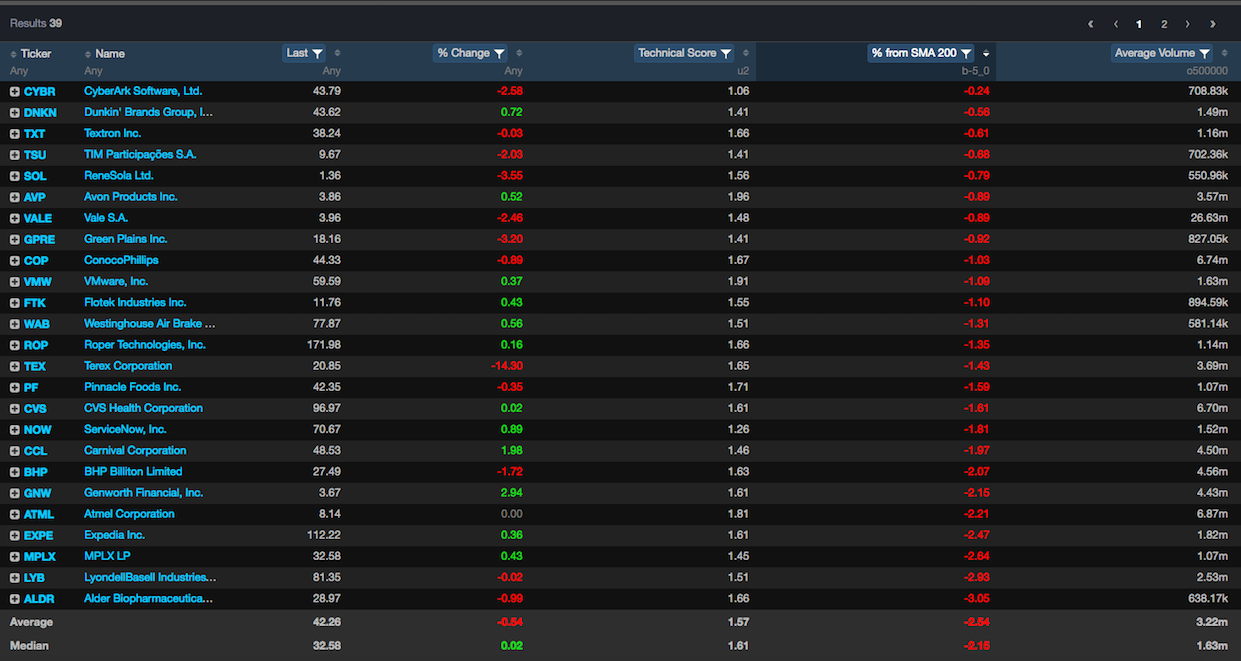
Another favorite screen of mine is the 200 day. This finds weak stocks vacillating at the 200, typically a place where support might be found.
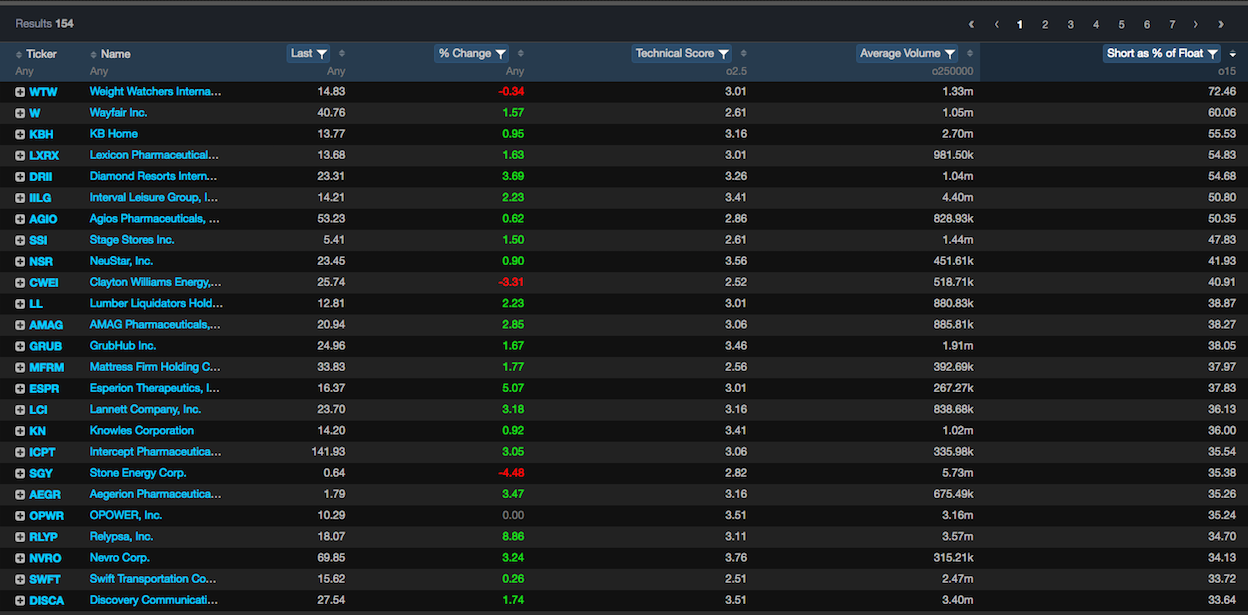
In mind-numbing bull markets, short squeezes were always a favorite denizen for my money. Here are some heavily shorted stocks in my short squeeze screen. I’d attack the ones with the higher technical scores first. A rating of 5 is tops, and 1 is the worst.
Lastly, this is the final week for the 15 stocks in my GAPR index. They will be replaced on June the 1st. For those uninformed, this is a semi-annual portfolio that I update twice per annum. As you can see, the returns have been lackluster, up slightly for 2016–hamstrung by a few dogs.
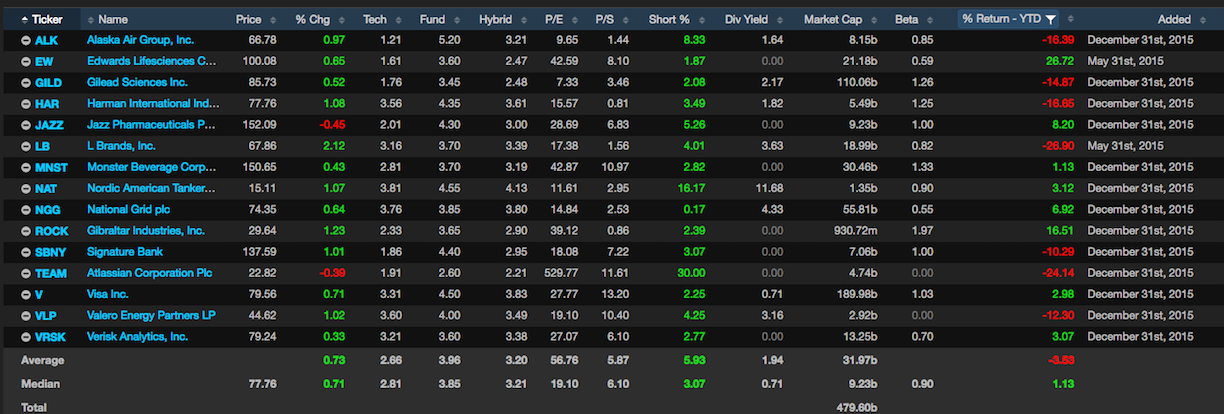
I’ll likely build an entire portfolio from scratch for the June index.
In short, overbought is good. Risk is still reviled, on a year to date basis. My bubble basket is down 17% for the year, which is my chief barometer for risk. According to the data, markets should remain firm through next week.
If you enjoy the content at iBankCoin, please follow us on Twitter


This makes absolutely no sense whatsoever.
nO sHIT
And Another Week Of Selling: “In 2016, Equity Funds Have Lost The Largest Ever Outflow For The Asset Class”
The stats are what they are. Math is.
pretty funny, how stupid you are.
“Chart: For all those claiming there is money on the sidelines or that this is the most-hated rally… Net Longs in S&P Futs and minis are at their highest in 18 months…”
http://www.zerohedge.com/sites/default/files/images/user3303/imageroot/2016/05/24/20160527_EOD6.jpg
They can get this higher. But be clear. It is merely/solely/only being dragged/pushed/propped/yanked/forced/foisted. By those who want that narrative. &The ‘manicbuying’ on a lot of the index charts this week including friday hanky-panky greatly reflecting this