iBankCoin
Home / Tag Archives: #OIL

Tag Archives: #OIL

CANADA – PLACE YOUR BETS

Things generally get done quickly in Canada. Elections are not drawn out, overly expensive affairs. Prime Minister Justin Trudeau (office assumed 11/4/15) has brought his debut budget via Finance Minister Bill Morneau, and while some are aghast at the scale of the near C$30bln (US$22.7bln, equiv. to approx 1.5% of CDN GDP) planned budget deficit, it was largely what got the Liberal party elected. Trudeau promised C$125bln of deficit spending over 10 years (up from $65bln planned by the prior no USA State Dinner “Melba toast”, Lego-haired Stephen Harper led Conservative government).

The planned Canadian deficit is much smaller than what the USA is running. On a GDP/per capita basis Canada’s deficit would translate to a US$225bln deficit for 2016 versus the US expectation of -US$616bln, 4.1% of GDP (up from -US$439bln in 15′). The US passed their first budget in 6 years in 2015. Obama, admittedly through the highly thorny Global Financial Crisis (GFC), has presided over 5 of the 6th largest deficits in the history of the United States, several of which breached $1tln (2009 deficit was $1.4tln, or 9.8% of GDP).

The recent rally in all things Canada seems to have outpaced all rational thought, even for a Canadian (hand held high, Cape Breton, Nova Scotia native). The pheromones released by young (44) Justin Trudeau do not explain all of the recent exuberance. Valeant aside, Canadian institutions have a reputation for being more prudent, more conservatively managed than their US and Global peers.

Canada is clearly a levered bet on a recovery in the resource sector. The equity market cap weighting of oil & gas and mining & metals for Canada at 35% is nearly 2X the USA’s 18%. The Canadian banking landscape is similar to Australia in that it is essentially an oligopoly, with an 80% share held by the top 5 players. Canada’s largest bank, Royal Bank of Canada recently overtook Goldman Sacks to be the 5th largest Bank (ranked by assets) in North America. RY trades at a P/E multiple of 11.2x versus 8.4x for GS. RY yields 4.3% to GS’s 1.7%. RY’s price to book is 1.8X versus 0.86X for GS. Notably, most US money center banks trade at a discount to GS, making the comparisons more stark.

77265855-d05f-44f6-96af-8ec7731ed251

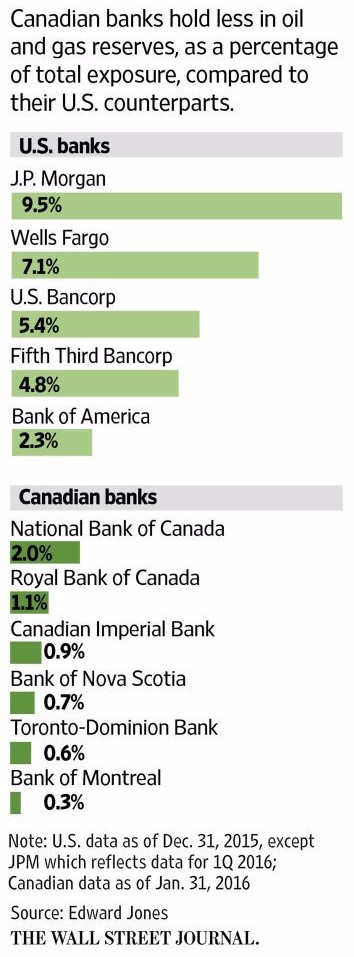
International comps are even less kind. The Bank of Nova Scotia is Canada’s “Emerging Markets” bank with it’s top 3 leading markets outside of Canada/USA ranked Mexico, Peru and China. Perhaps a better global comp for BNS is embattled Standard Chartered ($STAN.L). BNS trades at a P/E multiple of 10.8x versus N/A (non currently profitable) for STAN. BNS has a dividend yield of 4.5% versus 2.1% for STAN and BNS trades at 1.5X book versus 0.4x for STAN.

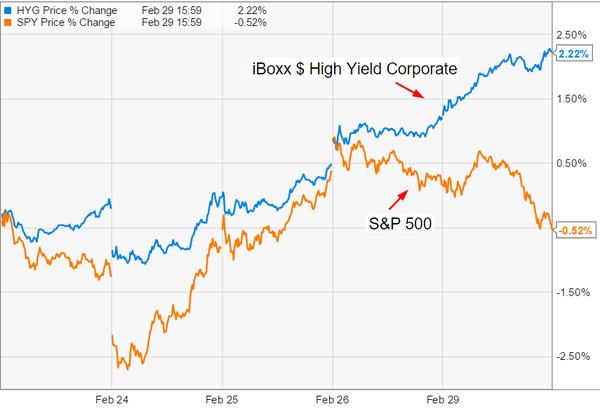
Broadening the net somewhat, XIU the S&P / TSE 60 is up 3.6% YTD versus 0.2% for the largest EFT currently,SPY (S&P 500).

The most recent ebullient rally has brought USD/CAD to 1.3250, a rally of >9% in 2 months from the 1/19/16 low of 1.4579.

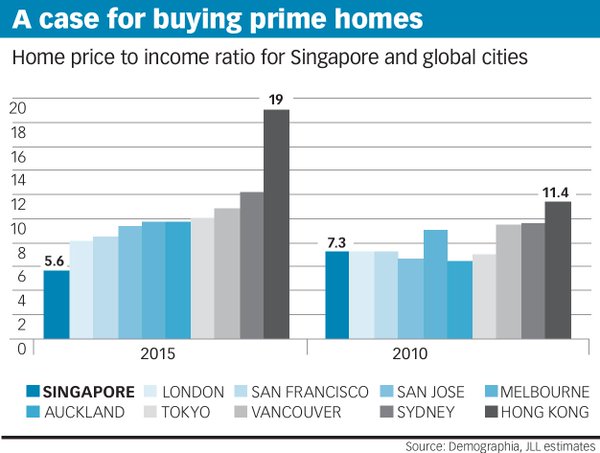
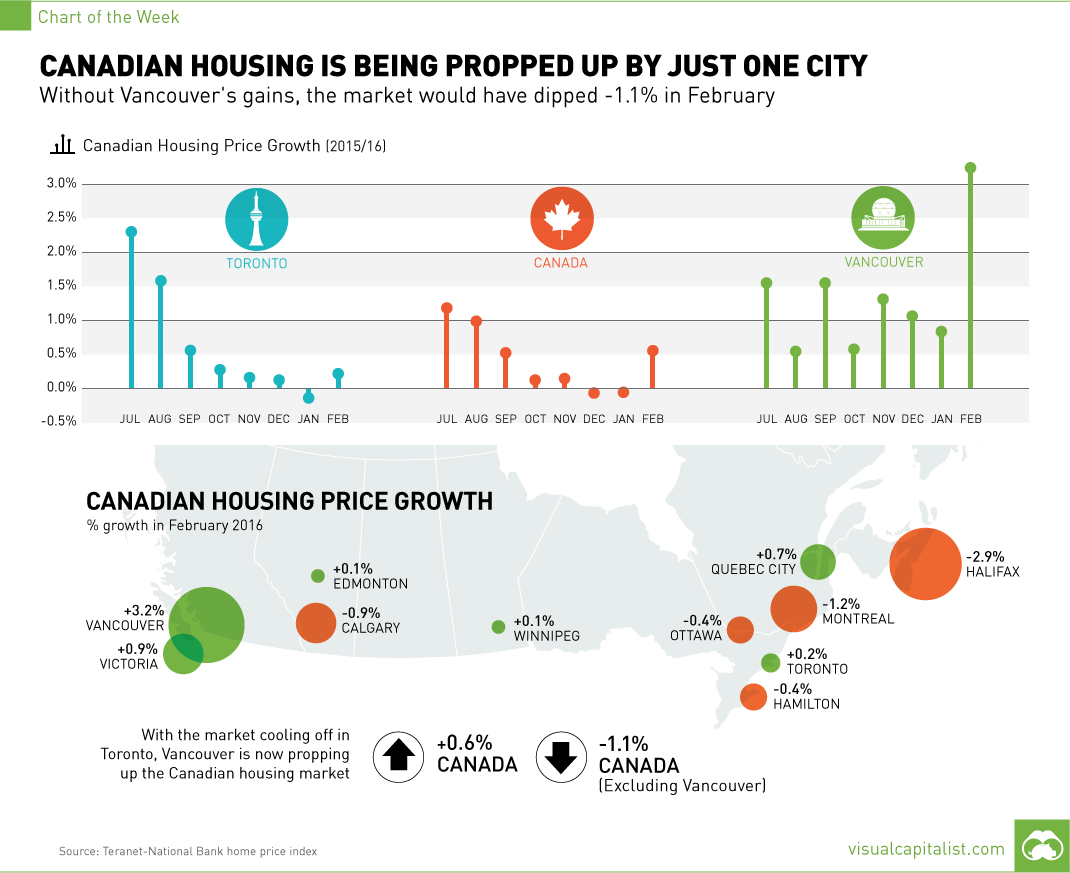
Canadian real estate has been largely a tale of two cities, Vancouver and Toronto. China accounted for > 1/3 of Vancouver wide buyers in 2015. There are now 15 cities in China with populations >5mm. Canada only has 4 >1mm. Vancouver is #1 for Asian buyer due to i) climate and ii) proximity. FATCA has been a headache for many Chinese nationals with 10’s of thousands relinquishing their US Green Cards. While structuring solutions abound, US Estate taxes are an additional burden favoring Canada (Revenue Canada has no global taxation mandate and Canada levies no estate taxes, making it a tax haven at least on this metric).

Since the 05/15 Economist article warning of the bubble like conditions, Vancouver is up 14% and Toronto 8%. Further, Vancouver was up 3.2% in 02/16, the strongest 1 month rise since 08/06.

CdEpJegUYAAfIus

Canadian-Housing-Is-Being-Propped-Up-By-Just-One-City

Perhaps it is the French influence, but Canadians do not like locking into long-dated mortgages. Americans refi at the drop of a  hat in a falling rate environment, but most Canadian mortgages carry a hefty pre-payment penalty (3 months interest typically). IF people fix their rate it is typically for 5 years (30 year amortization). Overall consumer debt in Canada is high at 1.65x income but the make-up of the debt is less worrisome, dominated by residential mortgages, followed by home equity line of credit with credit card debt as distant 3rd. With the broad government support/subsidization for higher education, the student loan debt burden is but a fraction of the US $1tln + (size adjusted of course GDP and/or population, near 10:1 on both metrics). Canada ranks as the most highly educated country in the world (51% of adults >25, including immigrants, hold at least a Bachelors degree, up from 40% in 2000).

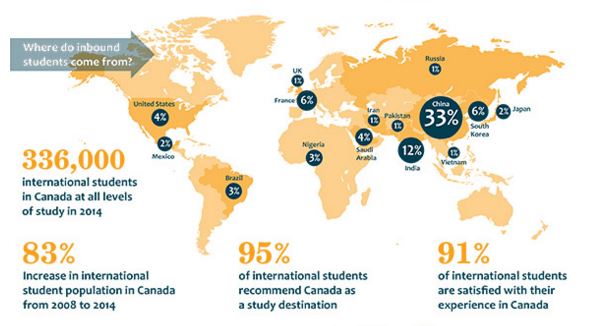
Immigration policy is a key metric when sizing up Canada. Policy has resulted in 1% growth (300,000 per annum) via open immigration policies. Foreign students has been a particular area of focus, with recent rules relaxed to have students study time counted partially (50%)  towards the time required to get eventual citizenship. The once popular immigrant investor program which granted permanent residency for those passing a net worth test of C$1.6mm and a C$800,000 no interest loan to Her Majesty in Right of Canada was replaced with a venture capital pilot requiring C$10mm net worth and $2mm tied up interest free for as long as 15 years. Perhaps more importantly than the dosh is the fact the venture program requires proficiency in either English or French whereas the immigrant investor program had no such requirement. The venture capital program has not been popular, needless to say. Canada was officially made a bilingual country (English/French) by Justin Trudeau’s father Prime Minister Pierre Trudeau. Montreal, Quebec at 4mm souls ranks as the 4th largest French speaking city in the world after Paris – France, Kinshasa – Democratic Republic of Congo (DRC) and Abidjan – Cote d’Ivoire.

ON-BQ344_abbych_NS_20160308211733

In the last quarter, Canada has admitted 25,000 Syrian refugees. Through the generous family sponsor program Canada has been able to double their country wide intake and plan a full 50,000 Syrian refugees for all of 2016. While these numbers pale in comparison to the 1mm + refugees Germany has accepted in the last year, Canada is clearly punching above their weight as a global citizen in this regard. The scale of the refugee crisis in Europe is immense and the most acute since the end of WWII. Some from developed EU countries which have borne the brunt of refugee support have turned an eye to Canada as a possible long term port in the storm (read, more potential high calibre immigrants). Trump “crazy dodgers” could eventually outnumber 60’s draft dodgers (est. 40,000) with Cape Breton’s program eliciting many hits if not plane tickets (yet). http://cbiftrumpwins.com/#intro

Tax policy. With the promised/coming tax hikes for “high earners” (>C$200,000, approx. US$150,000) in the most recent budget (+4% to the Federal rate) Canada is 2nd only to France in taxing high earners. All-in tax rates for Ontario domiciled high earners is 53% order of magnitude, on par with the “Left coast” California at 52.9% (although that rate is at a higher income level). Corporate taxes in Canada are considerably lower than the US (<13% overall) with small business, defined as those making <$500,000 taxed at modest rates (10.5% Federal + modest Provincial rates).

Summary:

There are likely easier and more compelling markets to short, despite apparent valuation asymmetries. The recent Canadian Dollar rally is likely to lose steam (personal financial exposure to CAD pared in favor of USD through early 2017). JCG

Comments »

EXXON MOBIL $XOM $12BLN 8 TRANCHE DEBT DEAL – NO BEAR HERE

Exxon took advantage of ultra low absolute rates to build on their war chest of liquidity, keeping the rating agency wolves from the door. XOM is rated Aaa/AAA and this monster bond issue matches Apple for the 2nd largest of 2016 year to date. Issuance is down considerably year to date by number of issues, but is only down 3% by volume given the huge scale of the issuance that has been brought to market.

The two biggest tranches at $2.5bln each were the 10 year (spread of +130bp to UST)  and 30 year (+150 to UST from initial price talk as wide as +180 over). Apple (Aa1/AA+) as a reminder came at +150 (20bp wider than XOM) and +205 in longs (55bp wider).

Very little to complain about here. A non gas & oil name could have purportedly come 25bp tighter, but these are very attractive all-in funding levels. Japan issued 10 year at a negative yield for the first time ever. German 10 years are at 0.10% (10bp) so you would have to hold to maturity to make 1%. The folly of this will become evident with the passage of time.

We stand with oil closer to $40 than $20 which is a good thing. High grade debt aside, we have seen a sizeable recovery in CCC rated debt and the high yield space has de-coupled from the equity market the last week of February (outperforming smartly with spreads tighter by 100bp in 2 weeks), a positive sign for risk assets for those focussed on looking forward. March is typically a positive month for risk assets.

91bf9f99-0d84-4eb6-aae1-bcbf5ddf2522

In related news, Goldman was finally able to get a challenging bond deal done for Solera, the Caa1 rated risk-management software company on the same day. The size was scaled back from $2bln to $1.73bln ($300mm in leveraged loan bump to make up the difference) on a 10.5% 8NC3 (8 year final, non-callable for 3 years) at a price of $95.00 for an effective yield of just under 11.50%.

Useful as a point of reference, as it gives you current “book ends” of what fixed income returns are achievable in the current market, Japan 10 year JGB -0.024%, 10 year German bunds 0.10%, 10 year US Treasuries 1.75%, 10 year XOM 3.05%, 8NC3 SOLERA 11.5%. JCG


Comments »

$20 OIL FALLOUT: RAPIDS – CLASS V, EXPERT

A betting man would likely place at least even odds on a $20 oil pendulum swing before we hit $50 again, if for no other reason to  its’ proximity to spot prices in the low 30’s.

oil_crash_660

JP Morgan has issued some interesting research, modelling the asset divestitures (by asset class) likely seen from reserve managers and sovereign wealth funds (SWF) on a further downside trajectory in oil, to as low as $20 per barrel. Global FX reserves peaked at just over $12 trillion in August 2014. Reductions from that time have come primarily from China (approx. $700bln) and commodity levered economies. A decent current estimate is $11 trillion. SWF assets stand at $4.5 trillion, with 93% held by the top 10 funds, ranked by size. Half of the top 10 gained their girth via oil riches with the remainder plumped via long held general trade surpluses. If we were to see a $428bln divestiture in 2016 on a move to $20 oil by this approx $15 trillion war chest (2.9% of assets), I would characterize it as a “flesh wound”. Seems low. Check you VaR. Fat tail result observation likely (kurtotic distributions).

CbFIx-OW0AAgPfb

The stresses on oil dependent global economies had been well documented and as illustrated in the graph below,most need a snorkel if not a nitrox tank already. 4 of the “fiscally challenged” sovereigns below also have top 10 ranked SWF’s by size.

-Saudi Arabia. SAMA Foreign Holdings. Est. 1952. $762bln (14′), 100 of GDP, 2.6x expenditures, 65.0 x sovereign debt.

-UAE. Abu Dhabi Investment Authority. Est. 1976. $589bln (14′), 147% GDP, 4.8x expenditures, 5.3 x sovereign debt.

-Kuwait. Kuwait Investment Authority. Est. 1953. $548bln (14′), 321% GDP, 6.7X expenditures, 54.0 x sovereign debt.

-Qatar. Qatar Investment Authority. Est 2006. $304bln (14′), 144% GDP, 5.48X expenditures, 6.2X sovereign debt.

Source: Moody’s, IMF, SWFI

The most stressed nations at  current oil levels will be in straight jackets at $20bbl oil. As the dominoes of Venezuela, Nigeria and Libya wobble if not fall, it will likely make Arab Spring of 2011 look like a Tragically Hip concert.

_79755553_oil_breakeven_prices2_464gr

Many market pundits point to the fact that lower is oil is positive and will result in an eventual  GDP lift for most countries. MSCI World (-6%)  has significantly underperformed MSCI EM (-1.8%) over the last 3-4 weeks.

As James Grant recently put it, more eloquently than I might, “Surely, no such thing as a separate and distinct U.S. economy can be said to exist. There is rather the single dollarized and financialized and leveraged worldwide economy. Like it or not, we are all in this together – the Chinese communists, the European socialists, the Japanese statists and we the people.”

The amount of Gas & Oil related debt that will need to be re-structured and that will eventually default clearly ramps at $20 oil. Current default rate estimates are at 7%+ and it is difficult to envision that default rates do not get to the low teens if oil prices languish to $20 bbl from here. The list of global survivors left to pick up the pieces dwindles as well, impacting recovery rates. The public debt markets have been the funding avenue of choice in the latest energy build out cycle and while the Banks will certainly not escape unscathed, there will be enough pain to share with estimated industry debt at $700bln+.

USD denominated debt (non-bank) outside the contiguous states stood at $9.2 tln as at 09/14, +$3tln since 01/10.

Cupped hands to make up for the reserve manager and SWFs asset divestitures are hard to find as the pension & endowment space revamp their asset allocation, largely away from the public markets in favour of private & specialty areas with higher alpha potential.

-1x-1

Liquidity is waning, and not likely to recover near term. Global regulations, regardless of intent, have had the effect of neutering the profit motive. The former commodity prop groups of the major global banks have largely been thrown to the winds with the most successful finding homes in the successful, albeit less stable trading houses (Mercuria, Vitol, Glencore, Trafigura, Noble, Gunvor, etc.).

Opportunities abound with so many cross currents, but the penalties for being wrong will be increasingly punitive. Asset redemptions, spikes is deficit spending/drawing down former surpluses, spikes in unfunded liabilities, credit downgrades (out of IG), increased civil unrest, increased protectionism and a ballooning global refugee crisis are all issues we will be dealing with in 2016 and beyond. JCG

Comments »

O’ CANADA – WE’RE GOING TO NEED A BIGGER GUN

As has been well chronicled on this web site, all is not well with the commodity complex. For a wealthy, developed nation Canada has a heavy reliance on primary industry. Canada is one of the few remaining AAA rated sovereigns credits. Canada is a 1st world country with a 3rd world currency. Much has to do with the high correlation with oil, it has always been high at 0.80, but has been running at 0.94 of late.

Combined, the Oil & Gas and Mining & Metals sectors make up 35% of the stock market in Canada, versus 16% in the US. Both Canada’s population and economy are about 1/10th of the US (34.75mm & $1.5tln respectively) and trade flows run predominantly North/South, 73% of exports and 63% of imports are with Uncle Sam.

“Just Like The States” is a compliment old timers still use for a job well done and approx. 85% of Canada’s 34.75mm people live within 100 miles (165 km for the bulk of the world on the metric system) of the US border. Canada’s unemployment rate stands at 7% (all US states are below 7% with the whole a low 5 handle) yet there is a high degree of regional disparity, with some in the double digits. There are only 4 cities in Canada with populations >1mm (Toronto, Vancouver, Calgary and Montreal).

Energy in the form of oil, primarily from Alberta (oil sands), Newfoundland (offshore), and Quebec (hydroelectric) along with metals, agricultural products, and forest products make up over 58% of exports. Autos, machinery and equipment make up 38%. Exports make up approx. 32% of GDP

The oil downdraft has had the largest effect on Alberta and the situation is not likely to improve in the near term. Much of the pipeline infrastructure focus has been on southbound KeyStone XL – Stage 4 which has been blocked by Obama (will Trump want naming rights to approve?). Part of the solution to the oil conundrum will be improving the mobility of trade across Provincial borders, with the added advantage of being able to settle in Canadian dollars. Justin Trudeau has arrived in the Prime Minister role (centerfold actually), bringing the Liberal party back to power with great fanfare and has promised spending of C$60bln over 10 years on infrastructure, with a front-end weighting. A portion of the infrastructure spend with likely be on critical intra-Canada linkages. While there are less viable road and rail options for this purpose, the Energy East pipeline and Trans Mountain pipeline twinning project are the two major proposed pipeline projects taking Alberta oil both East and West (in higher volume) respectively. New environmental hurdles have raised questions about the governments support for the pipelines, but in the end they make too much economic sense to not advance. This improved infrastructure would reduce and potentially eliminate the reliance on imported oil, which costs Canada > $20bln per annum. Venezuela and Nigeria are both on the watch list for major civil unrest in 2016, largely due to the swoon in oil prices. Canada also imports oil from the US (roughly 1/2 of the 630k bbl per day imported versus Canada’s 2.7mm bbl a day habit), Norway and the UK. Azerbaijan, requesting $4bln in aid this week is the canary in the oil well. Brazil and South Africa (who just hikes short rates by 50bp to 6.75% yesterday to put a finger in the ZAR dyke yesterday), are also markets to watch for 2106.

The structural decline of the auto segment in Canada is a much tougher nut and there is almost no degree of currency depreciation that can bring production back above the 49th parallel. The first wave of market share losses were dolled out by manufacturers establishing non-union plants in the Southern US States. More recently, Mexico has been growing significantly, no longer hampered by a perceived product quality gap. Canada’s unit automobile production (centred in Ontario) is down to 2.3mm unit per annum which is 24% below peak levels (99′).

No export discussion can leave out China. The Chinese Renminbi broke into the top 5 payment currencies in 2015, displacing the Canadian Dollar (CAD) to 6th rank. China had held the Yuan (CNY) steady in the face of significant easing by most of its trading partners up until August 2015 and still gained 3% world export share (to 13% from 10%). Read: China does not need a cheaper currency to be competitive. On the capital flight question, how much would China have to devalue the currency by to dissuade those so inclined  from moving? A lot is the answer, hence the worries of a 10-15% de-valuation by China is overblown. There will likely be modest depreciation versus the USD going forward (inside of 5%), and relatively sanguine fluctuations should be expected versus a basket of their trading partners (which is PBOC’s eventual intent). China runs a very large current account surplus (2%+ of GDP on a US$10tln+ economy) and there will likely be a spike going forward as the rate of domestic investment will fall at a much faster pace than the savings rate falls. Flooding the global markets with industrial goods when protectionism is on the rise is not a formula for getting along, but get along we must.

Canada has a vast advantage over the US in two key areas. Corporate taxes are a full 13% lower than in the US. Canada has the most educated population in the OECD with 51% of adults aged 25-64 having finished post secondary education (OECD avg. 31%). Canada heavily subsidises education and the world class ranking of the top schools attracts many foreign students.

As a developed market, birth rates are modest at 1.6 children per woman (2.1 required for a stable population base), but Canada has a long standing immigration policy that ensures, at least from a demographic perspective, that Canada keeps growing. Immigration to Canada is 260,000 per year (US is 1mm, 10x would be 2.6mm), 0.74% of the country’s population per annum (10% of those in the refugee category, 7% for the US). Life expectancy in Canada is 81.24 years versus 78.74 for the USA.

Canada is the 11th largest economy in the world, representing 2.9% of world GDP. Canada is home to 68 of the top 2000 companies in the world, for a tie for 5th with France.

Last week CAD and SGD, the Singapore Dollar traded at parity for the first time in 21 years, at 1.43 per USD. The commodity super cycle took CAD/SGD to near 1.60 over that 2 decade + period.  Singapore has none of the resource riches that Canada boasts, yet is has largely through will, minimizing graft and superior execution created the largest financial centre in South East Asia. The parallels to North America are strong, Hong Kong is like New York, Singapore is like Toronto. Singapore is one of the largest shipping centres in the world, depending on metric of throughput or value Singapore is often #1 (currently #2 to Shanghai). Singapore recently displaced Tokyo as the 3rd largest global fx trading centre after London and New York. Singapore boast > 30,000 multinationals that run their regional treasury centres for Asia (and in many cases broadened to include Europe and MENA) from a Singapore base.

Faced with the opportunity Canada has at hand, Singapore would have a crack team of government officials on tactical missions to entice multinational firms to relocate to Canada. Based on corporate taxation differentials alone (-13%), tax inversions make abundant sense. The grass is greener on the other side largely because it is fertilized with bull*hit, but in Canada’s case, the merits are largely beyond assail. The cash laden US tech sector in particular would be fertile with targets to entice to Canada’s Silicon Valley, Kitchener-Waterloo, Ontario. EDC, The Export Development Corporation of Canada, an Agent  of her Majesty in right of Canada (AAA/Aaa) stands at the ready to insure global trade.

Resident of Canada’s largest cities (Vancouver & Toronto) are admittedly over their skis with respect to residential property valuation at present (by 20% at Fitch’s latest tally), but even a modicum of success in leading a migration north of corporate America would make it look dirt cheap 3-5 year out.

Why did the Canadian cross the road? Answer: To get to the middle. Trade accordingly. JCG

Note: Author is a Singapore based Canadian, originally hailing from Cape Breton, Nova Scotia. Follow me on Twitter @firehorsecaper


Comments »

CHESAPEAKE ENERGY (CHK): RED FLAG OR WHITE FLAG?

The stock market took off last Friday Jan. 22nd like Space X’s Falcon 9 rocket, yet Chesapeake’s equity was left on the launch pad in the end, closing at $3.51, down 22% ytd and 82% yoy. The initial exuberance (+17% intra-day) at CHK cutting their pref dividends ($172mm in annual interest savings) gave way to the grave realization that all is not well, and time is is running out. Suspending the dividend on their prefs has been seen as prudent (prefs get paid after debt holders but before equity holders in a wind up). Notably, some of the pref dividend savings will be earmarked to buy back their secondary debt in the open market. Most CHK senior unsecured bond issues are trading distressed, wrapped around $30’s in price. Looking at a specific issue, the CHK 7.25% 12/15/2018 (senior unsecured) traded up to $40.00 for a yield of 47.5% . The bonds are rated B3/CCC+ with a recovery rating of 6 (the lowest rating, implying a recovery in the 0-10% band). This bond was trading above par for the first half on 2015 and only broke par to the downside in July 2015. CHK equity was at $10 when CHK 7.25% 18′ broke par (coincident with the common dividend being cut) and now sits at $3.51. Typically, one would expect the equity to massively underperform bonds on drawdown of this magnitude.  Part of the reason for the poor recovery rating on the CHK senior unsecured is that there is a lot debt with priority ranking ahead of it. The CHK 8% 12/15/2022 (2nd Lien), a $2.5bln benchmark size issue, is rated B1/BB- and traded at $46.25 for a yield of 24.55%. The recovery rating on these bonds is a 1, implying a very high recovery rate (>90%).

The debt load being carried by the top 60 independent oil & gas groups stands at $206bln, up from $100bln in 2006. Chesapeake has $9.8bln of this indebtedness versus $2.3bln in equity market capitalization. A full 1/3rd of the 155 energy names covered by S&P are now rated B- or below with a barrage of fresh downgrades in the offing by Q2 2016 (175 discrete global energy names in the case of Moody’s).

CZdYdLzWkAQxAzF

Oil had a strong rally off the lows last week, but US E&P players are being Ubered by OPEC at these prices. One can imagine Saudi Arabia relishing the death throws of “unconventional oil”. The Saudi’s have not had a good run either, downgraded to A+ in Q4 15′ and running a deficit approaching >15% of GDP ($90bln), largely due to lower profits from oil exports. That said, Saudi Arabia’s marginal cost of production is $3/bbl, versus $15/bbl for Iran, $73 for US “Shale” oil ($57 Gulf of Mexico) and $90 in Canada.

Chesapeake expected their negative cash flow for 2015 to be -$2.5bln with oil at $50 per barrel and natural gas at $3.00 per MMBtu. Not privy to projected numbers yet for 2016, but the price side of the equation is not helping at $31.5bbl and $2.12 MMBtu. Part of the solution is curtailing both activity and capex, both of which CHK has undertaken, and efforts continue. In Q3 2015 there were 16 active CHK rigs and there are currently 9 operating. To meet commitments for 2016 Chesapeake might be able to get there with 4-6 rigs. Capex of $280mm is expected in 2016. Interest costs will be $660mm for 2016 and there is a $500mm debt maturity due in March 2016, (CHK 3.25% 03/15/2016 which trades at $96.50). Chesapeake had $1.8bln in cash at the end of Q3 15′. Chesapeake’s $4bln bank revolver was re-negotiated into a secured facility in Q4 15′. Secured facilities further diminish the likelihood of senior unsecured  bondholders getting any substantive recovery in a tap out. As Le Fly has noted, banks generally like providing umbrellas when it is sunny, in the current environment, not so much. Chesapeake results for calendar 2015 will be out Feb. 24, 2016 with an expected $5.5bln loss for the year.

Unit operating cost have spiked 60% in the last decade for the industry overall and while cost cutting has allowed this number to come down to 46% (tightening staff and procurement) meaningfully deeper savings will likely require a deeper dive and could be more costly to implement.

Investors should buckle up, it is going to be a rocky ride. Chesapeake has some high profile holders, including Carl Ichan who owns 10.98% of the equity (holding as at last reporting, but offside >$1bln). When Carl was an infant, in the mid 1930’s, Aladdin kerosene lamps were all the rage. If we ever needed a genie, it is now. JCG

Disclosure: No current exposure to CHK equity or debt. Vetting 1st lien debt of minority (30%) owned oil services/fracking holding, FTS International, FTSINT 06/15/2020, hedged via CHK equity short.


Comments »