
Pref shares are not everyone’s bag, especially is an equity centric investment world. Regardless, prefs hold an important place in the capital structure, ahead of equity in terms of ranking, but behind debt. Prefs are typically issued with a par value of $25.
Bank equity has has an awful start in 2016, globally. Instrument selection can be as important as sector selection.
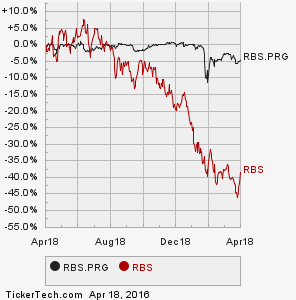
Royal Bank of Scotland (RBS) had issues well ahead of the 2008-2009 Global Financial Crisis (GFC). RBS devoured ABN Amro in 2007 (then the 8th largest bank in Europe), which was the equivalent of a python eating an antelope (hooves and all). In truth, other hyena were recruited in the pursuit, namely Fortis and Santander, but the bulk of the kill fell to RBS to digest. By the end of 2007 the RBS balance sheet was US$3.7tln (at GBP/USD exchange rates at the time). Enter the GFC. Enter the cavalry, enter the Queen. Between Dec. 2008 and Dec. 2009 The United Kingdom infused £45bln (US$64bln) into RBS, more than 40% more than the US Treasury pumped into Citi (US$45bln),to keep financial Earth from spinning off its axis.
I had been partial to the 7.25% RBS T Series prefs since coupons were restarted a couple of years back. I have a 4% allocation. As the T series prefs are trading in line with the issuance price of $25, yielding 7.23%, a call by the issuer is effectively a “wash” aside from re-investment risk.

A learned ex-colleague asked about the relative merit of the RBS 6.08% G Series prefs a few weeks back, first leading me to scoff at the sub-optimal current yield versus the 7.25% coupon T’s. Further analysis yielded much more information, and a timely Grant’s article in the April 8, 2016 issues titled “Least to Beast” with detailed input from Daniel O’Keefe, PM at Artisan Global Value Fund led me on the path to clarity.
The UK would like to show further progress on repayment of their bail out of RBS. The USA has since extricated itself from Citi ownership and even Lloyd’s has started paying a common dividend again. While some progress has been made, the UK government still owns >72% of RBS (down from 90% +).
The crux of the superiority of the 6.08% G series prefs at $24.03 over the 7.25% T at $25.06 lies deeper in the capital structure of RBS. The G’s were issued by RBS Capital Funding Trust VII. RBS Holdings N.V. (NV) is a wholly owned sub of RBS Group PLC (The issuer of the T’s) and holds the legacy assets of the 2007 ABN acquisition. Asset sales over the last 7 years have taken the NV unit assets to £19bln from £667bln. NV is better capitalized than the parent with tier 1 at 17% (parent tier 1 was 15.5% at 12/31/2015), a total capital ratio at 35% and common equity representing 19%+ of assets. NV carries a very high regulatory cost. Post-crisis protocols call for each regulated entity of RBS to have its own recovery and resolution plan. In summary, too much capital tied up in what is now an insignificant Amsterdam subsidiary. RBS’s total assets as at 12/31/2015 were £815bln, NV 2.3% of the total.
RBS has a total of US$3.3bln in prefs issued by NV, G, E & F (G series US$1.8bln). The play is to buy the G series pref on a potential take out at $25 by 05/18/2017 for a yield to call of 10.29%. The prefs are callable anytime after 05/16/2016. While you wait, the 6.08% coupon (6.33% yield) is a qualified dividend for US tax purposes. RBS could of course tender for the G series for less than $25 (par), but at $24+, it is not likely, given the negative signalling effect. RBS recently (Mar. 22, 2016) returned another £1.2bln owed to Her Majesty’s Treasury (HMT) and retired a class of prefs called the “Dividend Access Share”, paving the way for a common dividend in the not too distant future. JCG
Note: Long RBSPR 7.25% T Series (4% weighting), long RBSPR 6.08% G Series (2% weighting) from last week ($23.68-23.75) and long LYG common on recent resumption of common dividends. No wht (UK) and interest not taxable in Singapore on RBS prefs. Core holding.
Comments »