iBankCoin
Home / Tag Archives: #MAGA

Tag Archives: #MAGA

COVID-19: THE ZOO IS NOT CLOSING, EVERYTHING ELSE IS

Zoonotic pandemics were not on the list of tail-risks for investors coming into 2020. In hindsight, the timing of Chinese New Year, the world’s largest annual migration (US Thanksgiving x26, 1.3bln Chinese travel for CNY vs. 50mm Americans for Thanksgiving), could not have been worse. Closing borders, once a pandemic has started, has more limited utility.

In mid-February the global equity market was blissfully ignorant of the potential negative effects of the public health emergency, spawned by the infectious disease COVID-19, caused by the SARS-CoV-2 virus.

The Dr. Tedros led World Health Organization (WHO) has not made the global “pandemic” call yet, but this certainly could be the week. The range on unreported cases, due to the lack of testing outside of S. Korea (165k tested, 18k per day pace) is 10x (Johns Hopkins) to 38x (Lancet).

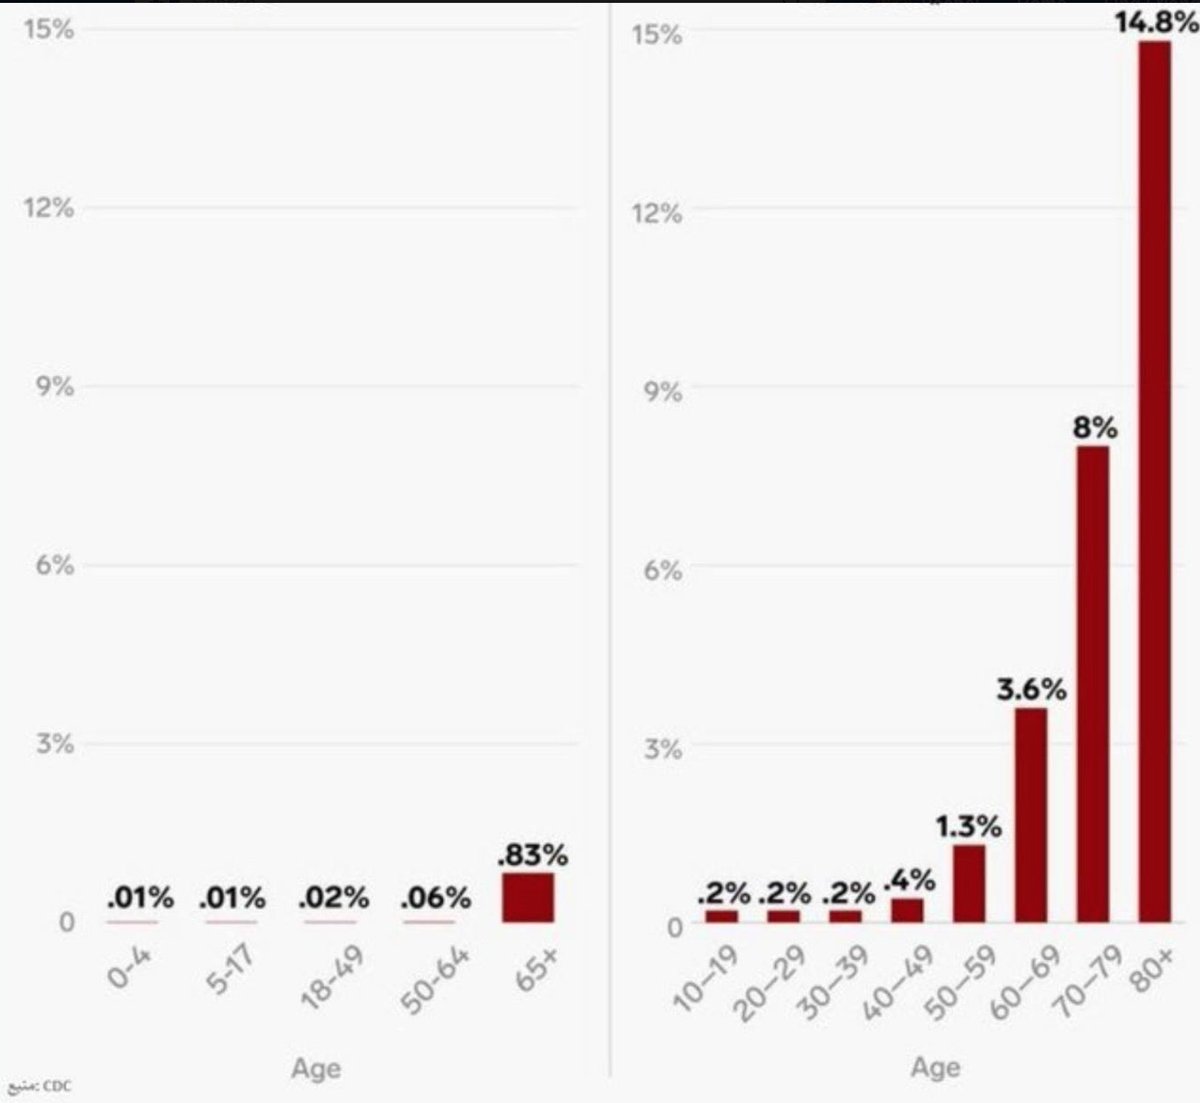
COVID-19 cases in China have crested, thankfully. Outside of China the cases have doubled >3 times in 12 days. Japan cases stand at 461 (>1,000 incl. Diamond Princess), USA is at 439, S. Korea 7134, Italy 5883 and Iran at 5823. Global cases stand at 106,200 with 3,600 dead. The epidemiological assumptions of the COVID-19 outbreak are, let’s just say, fluid. The case fatality rate (CFR) quoted most recently by the WHO is 3.4%, the range is a wide 0.68%-3.4% with S. Korea yielding the lowest CFR’s globally. Unreported cases are assumed to be less serious cases, hence it stands to reason that mortality rates will be lower for the broader group of infected sapiens (a terribly wide 7-34x more deadly than the flu, hopefully closer to 7). Spread rate, aka “r nought” est. 1.1-2.6 = 62% of contacts (approx. 2x virulent as flu). Morbidity, 20% will undoubtedly put a strain on global healthcare capacity. Many governments have been reluctant to invest sufficiently in their healthcare systems. Public health systems in less developed countries is of great concern. The cavalry is coming. The IMF has pledged $50bln in aid to assist countries dealing with COVID-19. The WHO has allocated $12bln ($8 new, $4bln re-allocated) and the USA just got approval for $8.3bln, just signed by DJT (not to mention an emergency intra-meeting 50bp rate cut by the Fed, other mopes falling in line on the follow with their short-end monetary spigots primed).

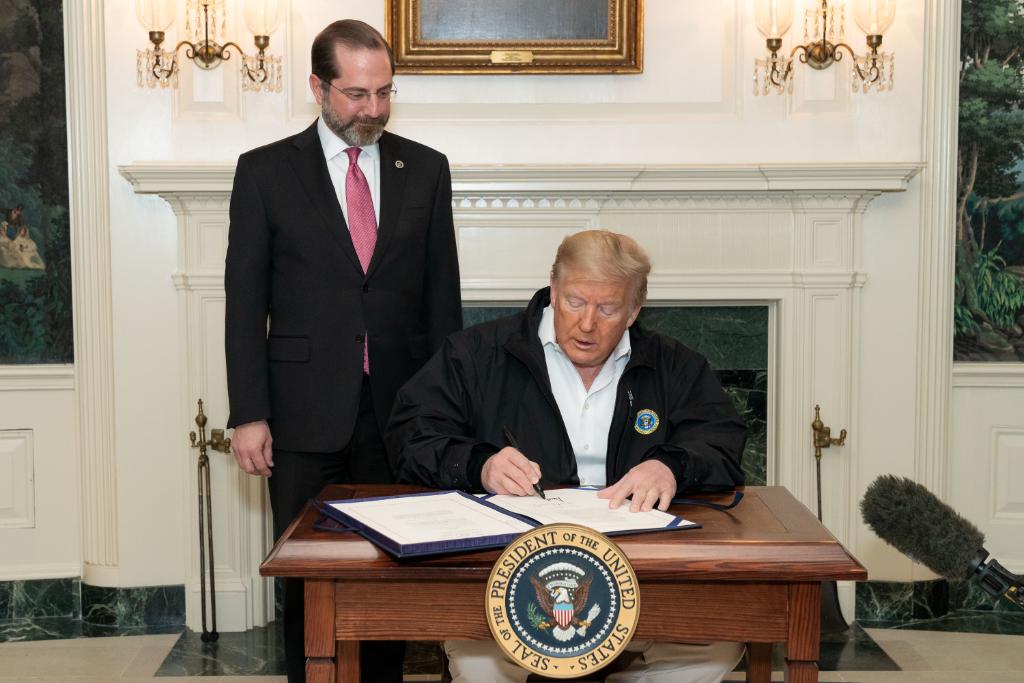
Trump signing $8.3bln COVID-19 spending bill

The potential COVID-19 effect on planet Earth is still being surmised. Listen to those with both skin in the game and involvement in the market (Andrew Brenner “The UST 30 year rate could break 1% by U.S. Sunday night) vs. the talking heads (Rick Santelli of CNBC; “Give COVID-19 to everyone, so we can get past this.”). The IMF released their estimates for China’s forward GDP estimates -0.4% to +5.6% for 2020 (not a chance, more cow-bell), and -0.1 for global GDP. More plausible estimates see the global impact to GDP at -$2.5 tln outright, just shy of 3% of global GDP, which would certainly trigger a global recession of unknown tenor. Price effects; The effect will overall likely be deflationary due to the shock to global consumption demand. There will be inflationary effects clearly with respect to the shock to the cost of production in many key sectors. The negative shock to global equity risk premia is what we have seen thus far (>$5tln), a long overdue re-tracement of multi-year multiple expansion driven by buybacks financed by a +100bln debt orgy post-GFC. The shock to labor supply will likely show itself quickly, especially in the critical global health-care sector. Child-care is another evident global bottleneck  in places like Japan where 13 million public school kids (joined by a couple million more from private school and universities) are homebound (aka self-quarantine, for a month) due to the closing of public school at the behest of PM Abe last week. Even the beleaguered cruise line industry has felt the effects, feeling the need to employ staff from the Yokohama docked Diamond Princess on the sister vessel, the Grand Princess now anchored off the California coast near San Fran (to be confirmed, but Pence, “Mr. COVID-19” has suggested this is factual/likely). The Port of Oakland has agreed to accept the vessel, it has been reported. Best wishes to all aboard for speedy resolution with next years’ resolution  to never board another cruise. Folly of the highest degree.

Financial market reaction:
Re-enforcing the repeated shortcomings of risk metrics like VaR (Value at Risk), the move we have seen in this “stress episode”, a 13% equity risk asset sell-off in 7 trading days is in many ways without precedent. As a “tail event” it would happen 0.1% of the time, running data back to 1896. Setting a confidence interval for VaR at 99% would not capture this event. 99.9% would just touch it. As Nassim Taleb would agree, it is not so much the breach as the magnitude “given breach” VaR falls down on.

The list of stress events of this magnitude is short. I have weathered them all, hence the grey hair!:
1.) Asian Contagion (1997). SE Asia currency crisis, laid at Thailand’s feet, but the MIST currencies, i.e. Malaysia, Indonesia, Singapore and Thailand all played a role.
2.) WTC attack (2001). Across the street at One Liberty Plaza for 9-11. 800 windows out, but no fatalities gracefully.
3.) The Big One (2008-2009). GFC (Global Financial Crisis). Epicenter in NYC, $5bln of credit (long). Indoor fireworks.
4.) Flash Crash (2010). Quite a day. Bonds had a good day, as you might imagine (re-allocation from equities, fear trade).
5.) Eurozone Crisis (2011). Sovereign debt crisis. Forced to sell 2 year Ireland paper at a yield of 14.5% (it eventually traded sub 1% before maturity).
6.) VIX event (2018). Structured, levered VIX ETF to zero. Caveat Emptor. Read the prospectus.

Last week 10 year US Treasury yields stood at 0.96% (0.70% intra-day Friday, 1st time since 1871). Long bonds (30 year UST) yield stands at sub 1.50%. Tough environment for pension fund managers, insurance companies and individuals looking to “build” a retirement income, that is for certain. The tumble in US treasury yields, by 1/2 in the case of the 10 year in less than 10 days (1.6% to sub 0.80%), has greatly increased the fragility of the rates complex (25%+ increase in duration translating to great price risk going forward).

Spread assets, like corporate bonds have experienced a massive sell-off. The US$5.3bn withdrawals from IG corp bonds this week was the heaviest on record. With the number of oil & gas credits in the HY (high-yield) market, this is the area likely to crack first with 7.9bln in outflows. CDX (spec grade credit) moved out (widened, i.e. more risky) by 42 basis points on Friday to +451 (365 recent LT avg.).

If you thought that central banks looked flat-footed in recent days, cast your eyes on OPEC. The break down in R-OPEC talks last week precipitated a 10% swoon in global oil prices, on the day (Friday). The demand destruction in the petrochemical complex is real, China alone will likely account for a 2-3 MMBRD (million barrel per day) demand shortfall versus prior run rate, and there is another 2 MMBPD in lower demand from elsewhere globally. Saudi Arabia plans to boost production is an all-out price war versus the prior expectation of a 1 MMBPD cut back in production. These are heady numbers and might bring back memories of oil with a 2 handle per barrel, as in sub $30 (well above the cost basis for most global conventional oil production). Peak Saudi production is 12 MMBPD, as a point of reference. As Stephen Innes puts it, “There Will Be Blood”. China’s “force majeure” declaration on LNG deliveries is wreaking havoc in the natural gas market with prices in the US now negative through the end of summer (-5 cents per mmbtu). Warren Buffet has reportedly pulled his funding commitment for the $9bln LNG project in Saguenay, Quebec, due to “challenges” in Canada. This, from a man who has been seen running into burning buildings, most recently with an incremental United Airlines stock purchase. Ill timed, rear view mirror, as airlines will have a $113bln revenue shortfall (projected) vs. 2019.

The only things up on the year include;

i.)VIX, largely to be observed, related tradeable instruments can be widow-makers (see VIX event above), if involved, with stops of course, trading sardines, not inventory sardines for certain. The vix stubbornly holding > 30 telegraphs 2-3% daily swings until further notice. Typical size reduction, stop widening strategies will be employed for certain. A Gatlin gun of global liquidity has been assembled, most yet to be deployed.

ii.) 30 year UST, iii.) 10 year UST, iv.) 5 year UST, v.) 2 year UST, vi.) Gold, and vii.) Palladium (20% +).

Analytics / like minds / support:

Within ibankcoin’s “Exodus” (multi-year subscriber, non-compensated post) platform there is a constantly transforming list of existing and emerging CODID-19 equity plays and the Pelican room spends a goodly portion of daily discourse on the topic of coronavirus. Few rooms are positive month-over-month through the lunacy that COVID-19 has triggered. A sampling of names currently on what I’ll call the “spec” basket include; $SPEX (Spherix, up 130% Friday past), $TOCA (Tacagen +57%), $INO (Inovia +44%), $NNVC (NanoViricides +39%) scalped short as what I view as a “suspect” name/play, akin to cannon fodder $XAIR, Beyond Air, -20% Fri.), $CBLI (Cleveland Biolabs, +25%), $ALT (Altimmune +13%), $OPK (OPKO Health, +13%), $TRIB (Trinity, +9%), $AEMD (Aethlon, +8%), $NOVN (Novan, +10%),  $BCRX (BioCryst, +7%), $VXRT (Vaxart, +7%), $CTSO (Cytosorbents, +8%), $COCP (Cocrystal, +4%), $VIR (Vir, +4%), $HAPP (Happiness Biotech, +6%), $CERS (Cerus, +4%), $VCNX (Vaccinex, flat), $APT (Alpha Pro, -13%), $LAKE (Lakeland Industries, -2% Fri.)., $CODX (CoDiagnostics, -10%), $NVAX (Novavax, -3%), and $ONEM (1Life Healthcare, -1%). All of these % moves are 1-day moves. The inter-web can provide historical and ytd numbers, but needless to say there are endless contenders afoot, many well over their skis. The real contenders will show themselves soon enough. Most will not be successful in terms of their COVID-19 aspirations,  but those with a broader platform will avoid being taken out by failure with respect to CODID-19 efficacy. Best to diversify a bit as well, hygiene, masks, test kits, vaccines, anti-viral, etc. These are all common sense considerations. With the outsized support both provided and promised for global risk markets, skew will favor the assumption of risk versus the shedding of it going forward. It is the timing of when best to ford the river that remains very much in question.

Large-caps:

$MRNA. Moderna sports a $11bln mkt cap. A novel (pardon the pun) approach. My only other current long after taking profit on $GILD calls Friday past. Moderna intends to develop a messenger RNA (mRNA) vaccine for the virus. The company will use the CEPI* funding to manufacture the vaccine. Promising, as others are, especially given the high tech nature of their approach (akin to $SGMO, Sangamo one of my long term plays).

*Coalition for Epidemic Preparedness Innovation (CEPI) was est. 2017 with an initial grant of $460 million by Germany, Japan, Norway and the Bill & Melinda Gates Foundation. While I was not negative, I think Bill Gates is “moving on up” as an aside.

$AZN. AstraZenica. $124bln.

Clinical trials:

The big boys (maga big cap) are clearly safer investment vehicles and is where I have focussed my recent due diligence efforts.

1.) $GILD. Gilead’s Remdesivir is currently conducting 2 trials (one mild/moderate, one for severe), 297 patients total. First results April. A failed ebola drug that never got FDA approval. Some promise in treatment of SARS & MERS (good anti-viral activity). Worked on 1 patient in the USA, sample size as small as possible, i.e. N=1. $GILD stock has gone up 17% inside of a month, much higher than pv of an approved drug, but with a $100bln mkt cap and a suite of other drugs, seen as a lower risk play.

Varied success, but just closed out a profitable call option trade on $GILD (Gilead +5% Friday to $80) June $70 strike called sold at $13.00 (basis $3 mid Feb.). Yield 3.7% p/e 19, even after recent run-up. Will re-establish long outright or via calls on a retrace to mid 70’s on underlying.

2.) $ABBV. AbbVie Inc. is a $130bln diversified global pharmaceutical company. ABBV’s HIV drug Ritonavir (Kalentra marketing name) has just completed a 199 person trial and results are expected soon. Another untested drug in their arsenal is Erbevo. HT James Bourne on several items in this blog post.

Other:

3.) $RHHBY. Roche is a behemoth, $287bln mkt cap . Oseltamivir (Tamiflu, marketing name) is a tried and true flu drug and esp. if the L and S strains of COVID-19 stay with us on a seasonal on-going annual basis, we will require the full menu of treatments at our avail. At peak valuation (prior) during the SARS breakout a lifetime supply of Tamiflu cost $100k. Rights to Tamiflu now owned by Sanofi, $SNY ($120bln mkt cap).

4.) $JNJ, Johnson & Johnson. Near all time highs, strength to strength, $374bln mkt cap. Steady as she goes.

5.) IBB, iShares Nasdaq Biotechnology ETF. $7bln. Less idiosyncratic risk, buy them all. One way to go. Screen holdings well.

The knife catchers stand at the ready, but never bring a knife to a gun fight. Patience is warranted. Catching the meat of the move is much more important than catching the bottom tick. Central banks must of course show a “chin up” demeanor, but they of course know their runway configuration has issues. Too much accommodation was held for too long a period and they find themselves without stores of ammunition for the battles ahead. Calls for an expansion of Fed mandate, first whispered on Friday last, sparked the valiant final hour recovery. Weekend bookies see much of that final Friday gasp getting retraced before futures open Sunday evening. Rest up, the days ahead will test us all. There will be 5% up days, there will be 5% down days.

Regards,

Professor Gibbons, CFA, FRM

Follow me @firehorsecaper

PS: Some numbers could be stale due to source and/or passage of time. In most cases meant to signal magnitude, not false precision.

https://twitter.com/firehorsecaper/status/1228444727676030977?s=20

Jan. 27, 2020: (Discord chat history). Do we need a #coronovirus tab for both longs ($ZNO $NNVC $APT $LAKE $NVAC $BCRX $ATHX $AZN, $MRNA $LLIT, etc. ) as well as shorts? (airlines $TCOM).?

Comments »

AMERIZUELA: $FNMAS FANNIE MAE – ONLY ONE OUTCOME, RULE OF LAW MATTERS

While a number of “Mom and Pop” investors were also caught in the downdraft of Fannie Mae and Freddie Mac’s Conservatorship in September 2008 (10 year anniversary next year!), the largest current law suits appear to be from the hedge fund community at large. Fannie and Freddie had $36bln in preferred shares o/s when they were placed into Conservatorship, with community/regional banks the largest aggregate holder.

Bruce Berkowitz’s Fairholme Capital appears to be the most “all-in” with respect to position sizing with 35% of the fund’s capital deployed long Fannie and Freddie subordinated preferred shares. AUM for Fairholme is currently approximately $3bln (they were managing $19bln at their pinnacle), making this a 10 digit wager.

In Fairholme’s words:

“Fannie Mae and Freddie Mac. We believe that these two companies may be the most important financial institutions in the United States – perhaps the world – and directly support housing affordability and accessibility, including the uniquely American 30-year fixed-rate mortgage. They are a major reason why our country did not descend into a second Great Depression. Millions of American families depend on Fannie Mae and Freddie Mac to lower the costs and improve access to homeownership. In times of stress, these two have helped to ensure the continued functioning of the U.S. housing market. They have no substitutes. Fairholme’s investment in Fannie and Freddie demonstrates a commitment to ignore the crowd and invest in valuable, systemically important institutions – even those that are politically unpopular.”

Richard Perry’s Perry Capital (in wind down), is also long the prefs, exclusively.

Bill Ackman’s Pershing Square is much less committed, in terms of size of position at least (but still a sizeable swing at 9%), and has chosen to purchase the common shares of both Fannie and Freddie (although he has been rumoured to be selling common in favor of the prefs). Both GSE’s applied to be de-listed in 2010 from the NYSE and now trade over-the-counter on OTCQB, the “venture” stage marketplace for early stage companies that report to a US regulator.

The original government bailout of Fannie and Freddie was $187.5bln and they have now remitted in excess of $265bln back to the Treasury ($78bln more than the amount of the bailout). Fannie Mae accounted for $116.1bln of the $187.5bln and have repaid $159.9bln total to date (owned + $43.8bln surplus via net worth sweep).

The mechanics of the tithe were changed in August 2012 when the 3rd Amendment to the GSE Conservatorship  was passed (both GSE’s were paying a 10% dividend to the US Treasury on the Senior Preferred shares up until that point). The 3rd Amendment, as it became known, called for a “Net Worth Sweep” which is to be kept, in effect, for perpetuity. The golden geese have remained tagged since and the $ have been rolling in. Earnings for both GSE’s have been bolstered by an increase in guarantee fees as the fees on new mortgages exceeds the fees on those in the existing portfolio. Both have seen growth in their total guarantee portfolio, along with underlying mortgage origination and finally both have experienced lessening credit losses as their aggregate portfolio level credit metrics improve. An amazing turnaround story, were it not for the gold eggs being sent to corporate (aka Treasury) while they are still warm from being laid.

Fannie Mae had a profit of $12.31bln in 2016 as a point of reference. One potential fly in the ointment, in terms of reported earnings going forward, relates to deferred tax assets (DTAs). This is a bigger issue for Fannie than Freddie because of the relative size of their DTAs and the potential impact of Trump tax reform (corporate rate from 35% to 15% proposed, but many handicapping a final rate of 20%). Fannie Mae’s DTAs stand at $35.1bln and Freddie Mac at $18.7bln. Steve Eisman, who disclosed owning Fannie Mae prefs in smalls,  implied on TV this week that the DTAs could prove to be a catalyst for action, implying the US Treasury would be called upon to make the GSEs whole on the potential DTA value impairment due to the proposed Federal corporate tax cut. I may have misinterpreted Mr. Eisman’s call on this, but one thing is 100% for sure, the status quo is not sustainable. The US Treasury can ill afford to assume an additional 5-6tln of debt by nationalising the GSEs when the non revenue neutral programs on the table already get the USA to the mid 20’s (trillion) in Federal debt.

The lawsuits have not been going swimmingly for the hedge fund dominated plaintiffs to date. Shares of both GSEs have dropped >25% in the last 2 months months after an appeals court upheld a ruling against shareholders challenging the legality of the government’s Conservatorship. Shareholders continue to argue that the government’s net worth sweep of all GSE profits in perpetuity is unconstitutional.  An overturn of the perpetual full profit sweep is  the only viable alternative leading to a non zero-valuation for both the common shares and junior preferred shares of Fannie Mae and Freddie Mac. This is a binary, legal based outcome, hence not for the faint of heart. Ackman’s take, “We believe that Fannie and Freddie offer a compelling risk-reward as there are various scenarios which will generate a many-fold multiple from current levels. While a total loss is possible, we believe the probability of a total loss is relatively modest, and has become lower in the new political environment.”

Catalysts for a positive outcome:

1.) The U.S. Supreme Court overrule previous court decisions and overturn the net worth sweep.

2.) Trump and Treasury Secretary Steven Mnuchin recapitalize Fannie and Freddie, returning control to shareholders.

The 2nd scenario is the one that has boosted the stock since Trump’s win in November. FNMA and FMCC spiked as much as 250% (from $1.65 to $4.40) before settling in at the current $2.65 level (+50% from November).

Nobody is better suited to craft and execute GSE reform than Mnuchin, aka “The Loan Ranger”. Post Goldman, he purchased failed Pasadena, CA IndyMac,  doubled its capital base (via additional acquisitions) renamed it One West and sold it to CIT for a tidy profit.

https://cei.org/blog/mnuchin-must-bring-transparency-fannie-mae-and-freddie-mac

Mnuchin has publicly stated:

“[We have got to] get Fannie and Freddie out of government ownership. It makes no sense that these are owned by the government and have been controlled by the government for as long as they have. In many cases this displaces private lending in the mortgage markets and we need these entities that will be safe. So let me just be clear we’ll make sure that when they’re restructured they’re absolutely safe and they don’t get taken over again but [we have got to] get them out of government control.” (Footnote: Nov. 30, 2016)

“[…] it’s right up there in the top 10 list of things that we’re going to get done and we’ll get it done reasonably fast.” (Footnote: Nov. 30, 2016).

Mnunchin’s right hand man is Craig Phillips, a near 40 year Wall Street veteran (most recently at venerable Blackrock) but he ran the Mortgage Securities unit at Morgan Stanley in the lead up to the GFC (May 2006, about a year before the wick was lit on the MBS woes to follow).

With Housing Finance Reform a top 10 priority, in terms of timing this likely makes it 2018 business (prior to 2018 midterms). The Trump tantrum we saw in the markets yesterday provide a potential entry point for punters willing to take Mnuchin et al at their word. FNMAS, the most liquid Fannie subordinated pref traded off by 5.6% to $6.75 yesterday (17-May-2017). The 52-week range has been a wide $3-$11, reinforcing the speculative nature of the proposed foray. The low was close to 9/11/2016, the 8 year anniversary of the prefs going ex dividend on 9/11/2008. The Trump Bump sent the Fannie prefs prices skyward, from lower left to upper right as Gartman would put it, approaching $11, appropriately, on Valentine’s Day 2017. FNMAS now at $6.75 have since given back 38% from the February 2017 $11 high.

This is the appropriate time to ask, “What is the upside on an investment in Fannie Mae subordinated prefs (FNMAS)?”, given that the downside has been shown to be zero. Fannie Mae did not file for Ch. 11. It was placed into Conservatorship, along with Freddie Mac. The capital structure remains legally intact, under which the subordinated prefs rank behind the US Treasury senior prefs, but importantly ahead of the common (which is to be diluted by 80% …. the US Treasury mandated “deal” when placed into Conservatorship). Also worthy of note, at the time the GSEs were placed into Conservatorship all senior and subordinated debt of the GSEs was paid/matured at 100 cents on the $. Before the US Treasury prefs can be extinguished (legally) it highly likely the dividends on the subordinated prefs would have to be reinstated. There are 16 discrete series of Fannie Mae subordinated prefs, FNMAS just happens to be the most liquid. None of the prefs are cumulative (i.e. no legacy dividends are owned once they start to pay again). The coupon on FNMAS is Max (3 mth Libor +4.25%, 7.75%) with a par value of $25.00. Cessation of the net worth sweep would see FNMAS trade back to par ($25) in short order for a 3.7x return on invested capital. It will likely take Fannie Mae time to build a capital buffer once/IF the net worth sweep is nullified. The US Treasury, despite the windfall seen via the net worth sweep will likely mandate the timetable for their senior prefs to be repaid. FNMAS, on a dividend reinstatement would pay 7.75% until Libor gets to 3.495% (good things are happening if/when we get 3mth Libor back to a 3 handle, I assure you), at which point L+4.25% would become the MAX, hence the applicable coupon. Given how high the rate is versus current market rates, it stands to reason that steadfast FNMAS investors could well see the market price trade well above par. I like the potential payout on a positive outcome for FNMAS  (3.7-4.5X invested $) much better than FNMA common. FNMA common traded off 3.3% yesterday to $2.65 and with some analysts guessing on an equity value of $15 post net worth sweep that would get risk-seeking investors a 5.66x return on their money. The pick-up versus the subordinated prefs does not seem worth the substantial additional unknowns and the known capital structure inferiority in terms of priority of payments.

Mnuchin is scheduled to speak today on GSE Reform in front of the Senate Banking Committee. Nobody is holding out for 100% clarity, but in a land increasingly filled with mere whispers, a clear voice can go a long way in setting the future course for perhaps the #3 priority for the Trump administration (just behind healthcare and tax reform).

Follow me on twitter @firehorsecaper

JCG

Disclosure: Long FNMAS, 2% allocation @ $6.75.

Comments »

RARE EARTH METALS REDUX: UCORE RARE METALS INC.; $UCU.V, $UURAF

Background:

Rare Earth Elements (REE) are expected to be a $9bln market by 2019, hence a tiny but critical market. Industry shipments totaled 133,000 tonnes in 2010 and have grown at a 9% CAGR over the last several years, with shipments expected to total 192,000 tonnes by 2019.

75% of global REE are currently sourced from China, where the bulk of global supply is processed, due largely to lower labor costs. 22% of REE emanate from Japan, and a scant 3% rest of world (ROW). 97% of current mine supply is from China.

Many, including the author, think the US should urgently take steps to secure a consistent supply of REE, strategic metals both for clean energy initiatives (rechargeable batteries for electric vehicles and the generators for wind turbines making up a goodly portion of the demand) and for national security & defense applications (jet fighter engines, missile guidance systems, anti-missile defense, satellite and communication systems).

The US currently imports 100% of their REM (Rare Earth Metals) and REO (Rare Earth Oxides) from China. World REE reserves are estimated at 110mm tonnes with China accounting for 50% and the US at 13%. Obama brought a 2012 WTO case against China, accusing them of hoarding key rare earth metals. Little progress has been made, although the WTO did rule against China in the case and export restrictions were lifted in 2015. The odds for Trump sweet talking better relations seem long. The typical business greeting in China is now the handshake, but most have little exposure to Trump’s Krav Maga version of the customary greeting.

Name of element Atomic number and symbol – REE: lanthanum 57 La (produced as an individual metal, est. to be 24% of REE value shipped 2013), dysprosium 66 Dy (used for control rods in nuclear reactors), cerium 58 Ce (produced as an individual metal, est. to be 40% of value shipped 2013),  holmium 67 Ho, praseodymium 59 Pr, erbium 68 Er, neodymium 60 Nd (produced as an individual metal, a key, rare 28ppm element used in producing lightweight permanent magnets in combination with iron and boron, NdFcB) , thulium 69 Tm, promethium 61 Pm, ytterbium 70 Yb, samarium 62 Sm, lutetium 71 Lu, europium 63 Eu, scandium 21 Sc, gadolinium 64 Gd, yttrium 39 Y (produced as an individual metal, used in alloys to strengthen aluminum), terbium 65 Tb (fuel cells). There are 17 REEs in total (15 lanthanides, yttrium & scandium) with most produced as oxides (produced as metals where noted).

Crystal abundance for REEs ranges from 0.5 to 60 ppm (part per million). It is often not economically feasible to mine solely for REE given the scant concentrations found in most deposits (Cordier 2011). Further, their often conjoined occurrence and similar properties makes the extraction of a sole REE both difficult and cost-intensive (London 2010). Copper is typically 50ppm, as a point of reference, hence while rare in relative terms, a concerted effort by the USA (#MAGA) to be self sufficient in elements like neodymium (29ppm as noted) is within the realm of possibility. Where should we start? The state with the lowest population density, Alaska (Sarah Palin land) seems like a good place to start.

Ucore:

Ucore Rare Earth Metals is a Canadian (Bedford, N.S.) development stage, micro-cap company with some big aspirations in the REM space. Ucore’s primary listing in on the TSX Venture exchange under the ticker UCU.V sporting a market cap of C$89mm (US$66mm). Very low liquidity, but the name also trades over the counter (OTCQX), under the ticker UURAF in US$.

Ucore has trademarked an innovative separation technology, “SuperLig” which can extract valuable RREs from oil sands and other tailings such as coal ash. Test results thus far for this innovative and potentially disruptive technology look promising. Ucore has been able to extract specific rare earth elements via it’s Molecular Recognition Technology (MRT)  nanotechnology to >99% recovery rates and purity.

Ucore is not just a mining technology company via SuperLig MRT, they also own over 11,000 acres of land in mine friendly Alaska – Bokan-Dotson Ridge, in Southeastern Alaska.

http://ucore.com/ucore-acquires-new-strategic-rare-earth-properties-in-alaska

Readers can dig into the assay result provided via the link. Ucore advertise they have the highest grade heavy REE (HREE) deposit in the US (N1-43-101 compliant). REEs with atomic numbers =<62, the ceric group, are termed light REEs. 63 and above are more rare (hence expensive) and termed heavy REEs. The 4 elements highlighted above have an anomalous skew in Bokan results thus far. The Alaskan government is certainly excited at the prospects for Ucore (Jewel CD sales have hit full saturation at 30mm). Through AIDEA (Alaska Industrial Development and Exploration Authority) they have made a US$145mm financing commitment to the Bokan-Dotson Ridge REM/REO project, subject to a laundry list of conditions of course. A pledge of this magnitude from the Alaska government could cover 2/3rds of the capex for the project and importantly, avoid dilution for common shareholders.

The only ETF specifically targeting the space is VanEck Vectors Rare Earth / Strategic Metals ticker $REMX which has AUM of $53mm and approx. 50,000 shares trade per day, on average.

Global names:

China Northern Rare Earth (ticker 600111.SS). Market cap, 44.6bln CNY (US$6.5bln). A shares, hence most can not access, even if you wanted to.

China Minmetals Rare Earth (00083.SS). Mkt cap 12.3bln CNY (US$1.8bln). A shares, hence most can not access.

Rare Earth Mineral Plc (REM.L) Mkt cap 43.2mm GBP (US$53.6mm). Highly liquid, London stock exchange listing, GBP denominated.

Very small allocation justified, if all all, given the perilous track record rare earth miners have left behind for forensics. Molycorp Inc., ticker MCP filed for Ch. 11 in June 2015, having reached a market cap of $6bln at its peak ($77 share May 2011). Skull and cross bones warnings.

Follow me on Twitter @firehorsecaper JCG

Note: Monitoring  UCU.V liquidity and vetting a long position in smalls. Currently flat.

Comments »

SUPERNOVA INVESTING : URANIUM

Symbol U, atomic #92, Uranium is Earth’s heaviest natural occurring element in the periodic table.

periodic_table

Earth is dominated by the following 4 elements; Oxygen #8, Magnesium #12, Silicon #14 and Iron #26. For reference Silver is #47 and Gold #79.

Uranium has garnered a lot of attention this far in 2017. Little wonder, as the uranium plays are up nearly 60% since the deemed pro-nuclear Trump was elected in November 16′. Using the largest uranium ETF, ticker URA – Globe X Uranium ETF as a proxy for the space, https://www.globalxfunds.com/content/files/Global-X-Uranium-ETF-1.pdf ,one can clearly see the pain inflicted over the last 5+ years;

2017 +27%, 2016 -1%, 2015 -37%, 2014 -23%, 2013 -21%, 2012 -19%, 2011 -60.%. From inception (11/4/2010), URA is down 79.5% cumulative.

U3O8 uranium currently trades as $25.31.lb. down 81.4% from the 2007 high of $136/lb.

uxc_graph_u3o8

The merit of nuclear power on metrics of both energy security and a low-carbon future are beyond refute. Real facts;

fuelcomparison

1 kg. of uranium, post enrichment and used for power generation in light water reactors produces 45,000 kWh of electricity. From an output perspective 1 kg. of uranium is equivalent to almost 10,000 kg. of mineral oil and 14,000 kg. of coal.

The comparisons on emissions are as striking as on energy output;

Greenhouse-Gas

Approximately 10% of current world energy supply comes from nuclear power. There are 447 operable nuclear reactors in the world at present, requiring 140 million lbs. of uranium per annum. Utility stocks are estimated at 478 million lbs., 3.4 year of demand. The largest 3 markets for nuclear power are France (58 reactors, 75% of overall power coming from nuclear), Japan (42 operable reactors, 40% of power pre-Fukushima disaster, only 3 have been brought online since all closed in 2011) and USA (99 reactors, 20% of overall power). A total of 60 reactors are under construction at present in China, India, South Korea, UAE and Russia . Twenty two of the nuclear plants under construction are in pollution ridden China, where 40% of growing electricity demand is still coal-powered, and the liveability of 25 of its largest cities hinge on nuclear power’s hockey stick growth projection. China is expected to have 40 nuclear reactors online by 2020 and to add 10 per annum thereafter. CNECC (China Nuclear Engineering and Construction Corporation) is the exclusive nuclear plant builder in China.

The USA only produces 4.3mm lbs. of uranium at present (2% of global output) versus an annual need of 56mm lbs., hence 93% of the uranium the US needs annually to operate existing nuclear plants is imported from places like Kazakhstan (39% of world uranium supply). Canada accounts for 22% of world supply and Australia 9%.

The World Nuclear Association (WNA) appear to have the best stats on the space. The top producer is Kazakhstan’s KazAtomProm at a 22% share. They recently announced a 10% production cut for 2017 (3% of world supply).

Canada’s Cameco is world #2 producer, not far behind KazAtomProm, at 18% of global production. The stock ticker is CCJ on the NYSE in US dollars and CCO on the TSX in dollarette’s (CAD). Despite all the seemingly good fundamental news on uranium, the price action has been nauseating. Cameco has some issues. Customer concentration is one, whereby almost 1/2 their long term sales contracts are with 5 key customers. Cameco received a termination notice last week from Japan’s TEPCO (Tokyo Electric Power, operator/clean upper of the crippled Fukushima plant) on a contract running through 2028 worth approx. $1bln. To give you an idea how offside TEPCO was on this long term uranium contract, 9.3mm lbs. spot is worth approx. $233,000,000 versus the $1bln contracted value, that is a $767mm potential hickey for Tepco. They have claimed “force majeure” in cancelling the Cameco contract, which might have had a shot of success if they had not accepted deliveries and paid for uranium 2014-2016. Sounds more like force manure to me, most expect Tepco will have to honor the contract via legal settlement. The news sent CCJ shares down 12.5% last week, although it remains above the 200-day moving average at $10.67.

The 2nd blemish to be addressed by potential longs is Cameco’s ongoing tax battle with the Canadian tax authorities, the venerable Canadian Revenue Agency (CRA). CRA are asking for C$2.2bln (US$1.7bln) in back taxes related to a purported tax dodge run by Cameco 2005-2015 where C$7.4bln of earnings were allegedly run through a low-tax Switzerland subsidiary. Most expect this case to be settled out of court in either 2017 or 2018, but the magnitude is unsettling to say the least. Plenty of press on the matter for those that would like to weight the merit of the case. The market cap of CCJ, as noted, the 2nd largest global uranium producer, is $4.15bln or 10% of TSLA ($40.4bln), as a point of reference.

There is a high degree of idiosyncratic risk in buying the listed equity of  individual uranium companies. The largest ETF highlighted above, URA has enough daily turnover to be considered liquid, but it small at $250mm in AUM (MER 0.70%). The weighting of the ETF in Canadian uranium names is high at 60% (23% in Cameco alone). The Kazakhstan names do not have listed equity.

For those seeking modest allocations to the uranium space, I would recommend looking at URA for the diversification, but shorting CCJ to reduce the single name exposure. With the proceeds of the CCJ short I would buy smaller US producers (some better described as micro-caps) as they will likely have few headwinds under the current administration (i.e. permitting, production, and expansion). The smaller players are largely unhedged without long term supply contract hence they provide more leverage to the underlying uranium price.

A sustained recovery in uranium equities depends on uranium prices staging a recovery from the depressed levels we have seen over the last several years. We have smoke, we need fire. JCG

Note: Long CCJ (1% weighting), but looking to diversify near term to a broader grouping of uranium names.

Comments »