iBankCoin
Home / Tag Archives: #CANADA

Tag Archives: #CANADA

URANIUM BULLS: THE QUEUE STARTS HERE

I last wrote on the uranium market in February 2017, “Supernova Investing: Uranium”. Please start here for full background, before you go down the nuclear/uranium rabbit hole; https://ibankcoin.com/firehorsecaper/2017/02/06/supernova-investing-uranium/#sthash.0jGcPuHC.dpbs

Envelopment of the globe by COVID-19 has been swift, and unforgiving. Most markets, especially commodity markets (save gold), are beset by demand destruction never seen in modern times. The workings of the global nuclear energy market do allow such respite for the uranium market, higher prices ensue. The 447 global active nuclear reactors (99 reactors or 40% in the USA, providing 20% of the USA energy needs) require their 140 million lbs. of U308 uranium per annum. New reactors planned in China, India, UAE and Russia will be the thumb on the scale demand wise. COVID-19 has led to the closure of critical uranium mines, with more announcements expected. The near term drivers of spot (out to 1 year) uranium prices will likely be supply driven. Uranium mines are typically remote, fly-in affairs with workers on monthly cycles in camps. Not ideal for social distancing, as you might guess. Cameco, Canada’s largest producer, and operator of the only operating uranium mine in Canada, Cigar Lake (18mm lbs/yr) is currently closed. There are only 40 operating uranium mines in the world.


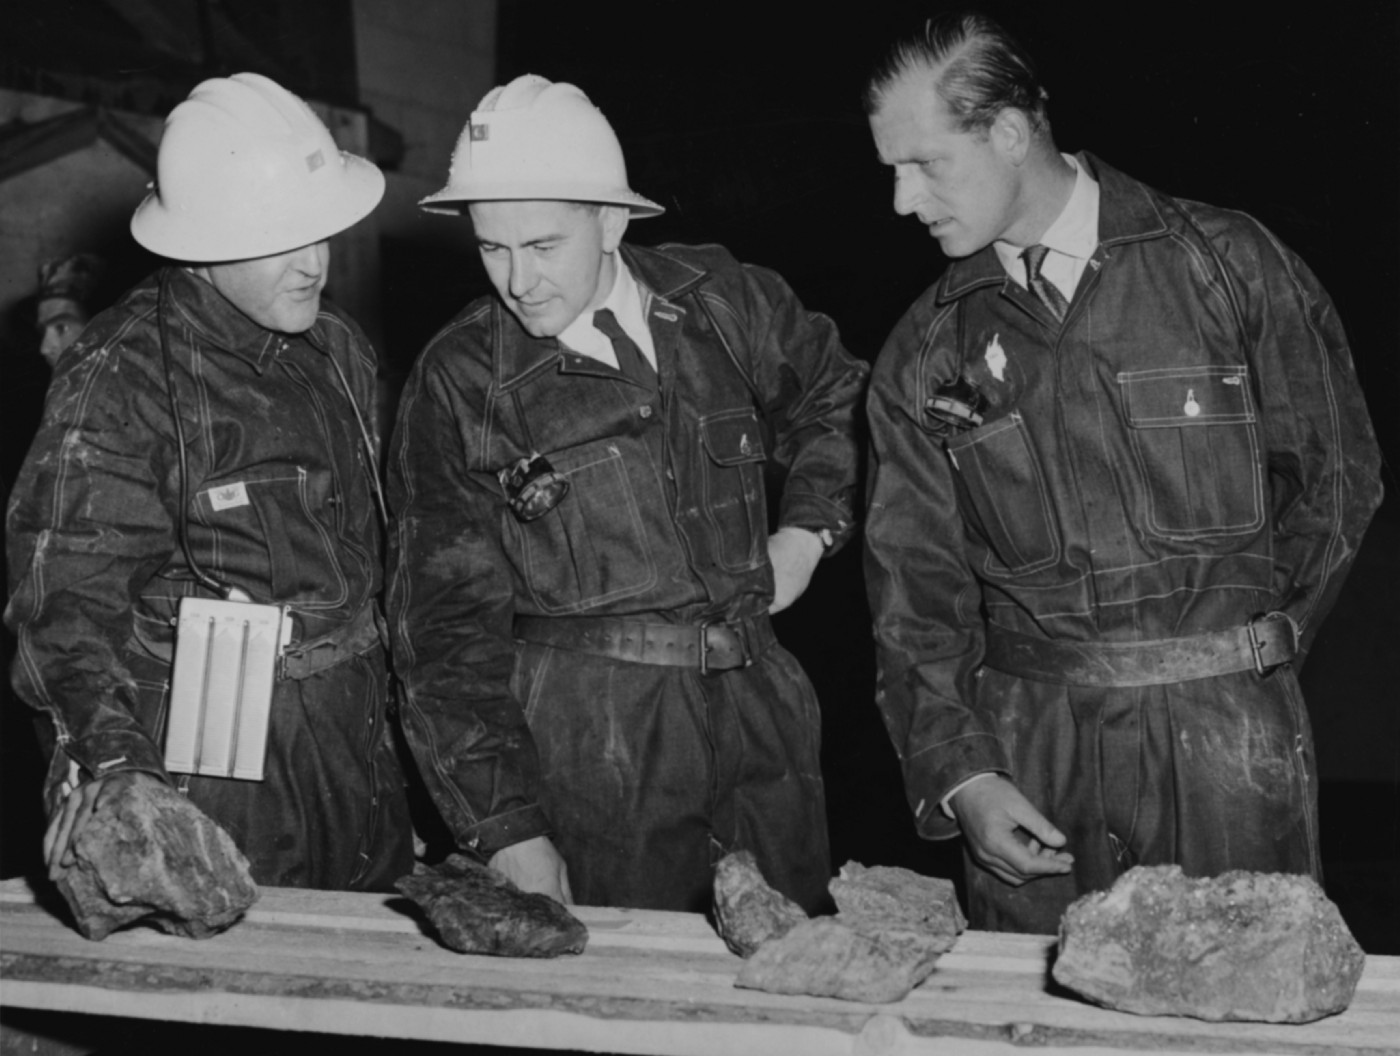
Getty images. Very clean uranium miners. The ties are a dead give away, “mgmt”.

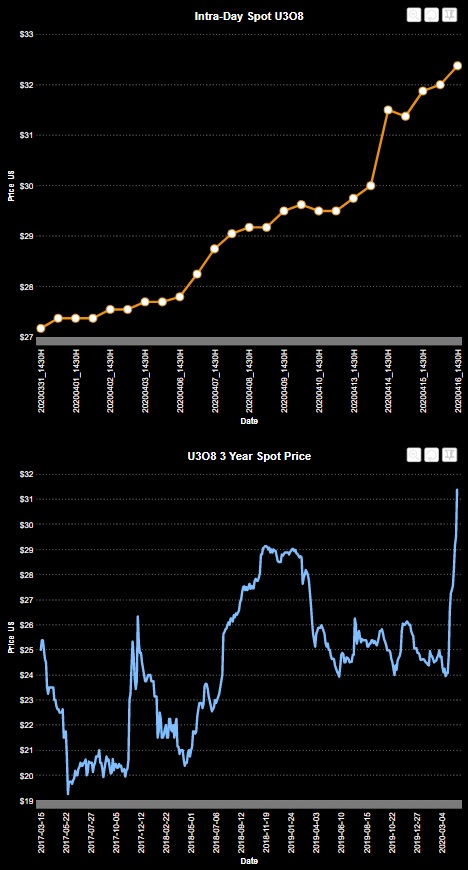
U3O8 uranium currently trades at $32.25lb. down 76% from the 2007 high of $136/lb., but up smartly from the high to mid $20’s where it languished for years. The entire uranium ecosystem is worth < US$10bln, down from a peak of US$130bln.

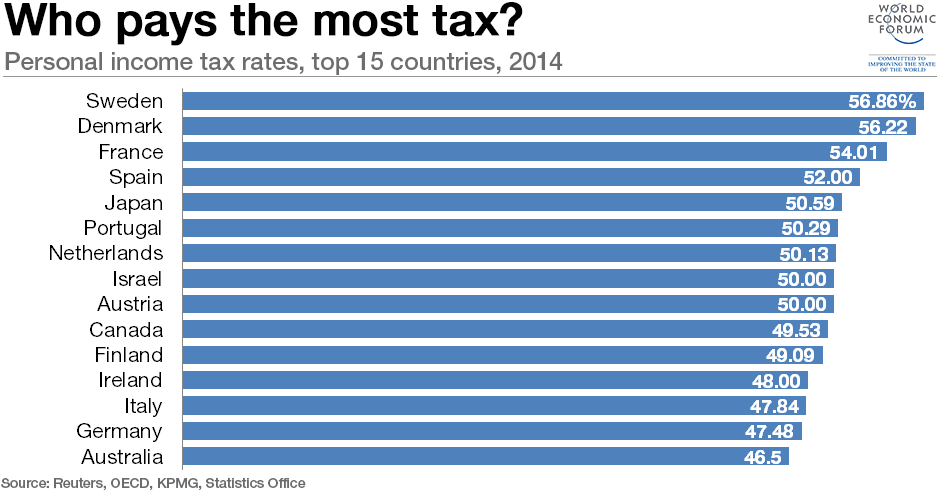
The uranium market has been in a funk ever since the 2011 Fukushima disaster in Japan. Fukushima is in the Tōhoku region of Japan, a couple of hundred kilometers north of Tokyo.  It has been reeling not just from the earthquake and tsunami, but from the clean-up of the nuclear plant site. Japan used to get 40% of their energy from nuclear power, pre-Fukushima. Few Japanese nuclear plants have come back on-line in the interim, with LNG and coal providing the bridge fuel. The country with the highest % of power produced from nuclear power is France at > 70%. Globally, nuclear power is a stable 10% of the global energy mix.

The uranium supply chain web is complex and secretive. JV’s, off-take agreements and bi-lateral contracts. There is no futures market for uranium. Data on reserves is scant and dated, but all prognosticators see inventory levels at both the producer and utility level as relatively low and headed lower. EIA data from end of 2018 saw utility reserves at 110mm lbs., about 27 mths supply. They are assumed to be < 100mm now, hence inside of 24 mths. 1/3 of the nuclear plants uranium needs are replaced on an 18 month cycle. Plants only close for scheduled maintenance, otherwise it is a 24/7/365 day commitment. Producer inventories are lower than historical; Cameco used to run 24mm lbs. before the McArthur River mine was closed and is now at 6 (2-3mm lbs. shy of their target). Barring the ability to negate some contracted volume via the enforcement of Force majeure clauses in individual contracts (due to COVID-19),  Cameco is expected to be a buyer of uranium in the spot market through 2020.

The uranium investment choices have expanded considerably since my 2017 missive. I’m now more keen on the producers, like Cameco Corporation (recommending the TSE listed Canadian dollar denominated shares, i.e. long the stock, short the currency) $CCO.TO, despite the idiosyncratic risk. Cameco’s prior tax woes with the CRA were resolved and their cost base is considerably lower than in prior cycles. Lower oil prices and a weaker Canadian dollar both improve margins considerably (20% +). The uranium market is in many way a duopoly, with Canada’s Cameco and Kazakhstan’s KazAtomProm accounting for 60% of world supply. I’m less keen on the Uranium ETF $URA due to a lack of sophistication in their portfolio construction.  70bp seems like a big fee to buy a handful of names, let alone to go “off piste” with names like Barrick Gold (5.75% weighting). $URA’s weighting is 24% in National Atomic Co Kazatomprom and 21% in Cameco. $URA has a paltry $160mm in AUM, perhaps reflecting the underwhelming changes since 2017.


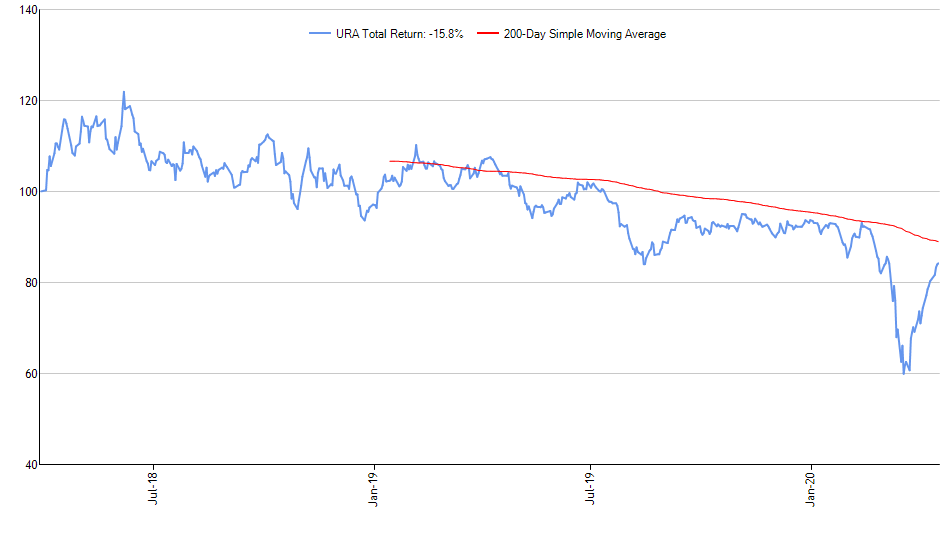
$URA price chart. Not early, 200 day moving average calling?

A couple of listed physical uranium plays have entered the fray. Uranium Participation Co. (UPC), ticker symbol $U.TO has a market cap of C$693mm (US$495 million with USD/CAD at 1.4020 …. 1.45 to be re-visited soon, in my view). Uranium Participation Corp has had a wild ride in 2020, swinging from a ytd loss of 21% the 3rd week of March (a 30% discount to the NAV of the uranium they held I might add) to a 25% gain on the year. Even in a home made ETF construct I’d likely keep the weighting modest in anything that can deviate from intrinsic that far, but such was the dislocation evident before Powell and Mnuchin re-painted our Potemkin village (BRRRR). The volume, including block trades as high as 400k, which we have seen in Uranium Participation Corp stock in recent days implies some incremental institutional involvement in the space. The other listed vehicle for physical uranium is LSE listed Yellow Cake plc, ticker $YCA.L with a market cap of £199mm (US$240mm). IF I allocate to this I will certainly hedge the currency (i.e. I do not want to be short British pound sterling, but I’d gladly short the Cdn Loonie ,as noted). You might recall the term yellow cake from the Uranium One scandal where it was alleged that Hillary Clinton brokered a deal for 20% of the US uranium reserves to Russia for a $145mm “donation” to the Clinton Foundation. The allegations have not been proven, I might add. Yellow cake, also called Urania, is “semi-processed” uranium (post mining, but before fuel fabrication or uranium enrichment).

As inferred by Yellow Cake’s clever logo, all uranium is used for clean energy, hence it passes even the finest Environmental, Social & Goverance (ESG) filters for investment. Few things have gone off the radar as completely in a pandemic as ESG, there is likely more concern about MSG in your Chinese take out order, but it is an important metric in terms of staying power for the rally in uranium prices, beyond the current supply-driven price shock. The USA needs 56mm lbs. of uranium per annum to feed its active nuclear reactors and only produces 4.5mm lbs. Secure supply is likely to trump a pure price based procurement strategy going forward. Supply chain re-engineering post COVID-19 will favor producers like Canada’s Cameco and a much needed “wind in the sails” for Saskatchewan, Canada.

Mr. Pompeo’s will be in the mix going forward as well, both uranium and rare earth metals will fall under increased national security scrutiny. If the US wants to develop autarky in these critical areas, investment will be required. Higher spot prices will create an incentive to grow domestic uranium production via in situ methods (i.e. uranium’s equivalent of fracking where solutions are injected into wells, leaving the rock in place but extracting the ore). Soy beans to China and Japan is not enough.


Other uranium supply concerns:

BHP’s Olympic Dam mine is Australia is still operating, but some expect the Australian government to allow some closures going forward, depending on how their COVID-19 containment efforts go. With 6,500 cases and 63 fatalities Australia is fairing much better than Canada which has 30,000 cases and 1,195 dead from C-19 at the time of writing (17-4-2020).

KazAtomProm of Kazakhstan have announced delays in well field development, a reduction in their operating cost base and lower capex. This is from the biggest and lowest cost producer. They produce 59mm lbs. per annum and recent announcements will see this fall by 10.4mm lbs.

France’s Orano has a mine in Niger which may see closure.

Uzbekistan Navoi mine (6.5mm lbs/ per year) may close due to C-19.

Summary:

Demand flat to upward sloping. Resilient to any demand destruction given the highly regulated and fortress nature of global nuclear power installations.

Inventories are approaching critical levels at  both the producer and utility level.

USA, the  biggest uranium buyer (40%) is likely not keen to rely too heavily on Eastern Bloc for critical uranium supply.

Supply is reduced due both to mine closures due to COVID-19 and natural inherent constraints in the uranium supply chain (mine deletion, prices not supportive of greenfield investment).

Small % allocation warranted. The same skull & cross-bones warning as in 2017. Stops in place.

@numerco on Twitter for spot U308 prices and charts. I’m @firehorsecaper. Do your own due diligence. I’m giving you the scent, you must find the quarry.

Ways to position longs:

Cameco Corp, $CCO.TO C$5.4bln mkt cap, >1mm shares traded daily. $CCJ in USD for those that do not want the currency worries.

Uranium Participation Corp. Canadian dollar denominated, U.TO on the TSE. Recovered smartly from March lows, note deviation from NAV in the roughest seas.

Yellow Cake plc $YCA.L in £.

KAZATOMPROM ADR in £ KAT.L Scant volume, but worth monitoring. Sperbank is the only Russia single name stock I would own, as an aside.

$NLR VanEck Uranium ETF. Avoid, small, no volume. Odd construction. Should be de-listed.

$DML.TO Denison Mines on TSE in Cdn dollars. Solid uranium development projects for those playing the long term thesis.

$NXE.TO NexGen Energy on TSE in Cdn dollars. same as Denison, promising uranium projects on the come.

Trade safely. Socially distance.

Regards, Caleb Gibbons, CFA, FRM

Comments »

OBAMA 15′ TAX RETURN – THE TAX MAN IS GLOBAL

President and First Lady Obama have filed and disclosed their 2015 US tax returns. On 2015 income of US$436,065, the Obama’s paid US$97,489 in taxes (the bulk Federal at $81,472) for a tax rate of 22.4%. Charitable contributions were a sizeable $64,000 (15% of their adjusted gross income) which skews the numbers considerably for those ready to skewer their tax accountants (you pay a lot more). The Illinois State Tax rate was recently as high as 5% but sunset back to a 3.75% rate as of Jan. 1, 2015. The Obama’s paid $16,017 in State tax to Illinois (3.7%).

There are many jurisdictions where state tax bite would have been a lot higher. NJ is a timely example, which has the 3rd highest taxes in the US (income taxes, property taxes, estate taxes and inheritance taxes). 40% of the NJ budget is funded by personal income taxes with a full 1/3 collected from the top 1%. The highest personal income tax rate is currently 8.97%. A special 10.75% millionaire bracket has been proposed but Gov. Chris Christie has vetoed repeatedly. Only a small percentage of the 1% have cement shoes, even in NJ, and they have lost a high profile golden goose to Florida for the coming tax year. NJ’s #1 taxpayer, David Tepper (58, has a net worth estimated at $11.4bln), has taken flight after 2 decades, setting up a branch of his Appaloosa fund in South Beach, Miami and listing his condo there as his primary residence. People can vote in many ways in a Democratic society and New Jersey should fully expect more to vote with their feet. Florida has no state income tax or estate tax.

I thought it would be instructive to show what the Obama’s 2015 tax bill would have been in other world jurisdictions.

who-pays-the-most-tax

France up is first, Paris of course. Tax rates are very high. For the level of income the Obama’s report on their joint filing, France would extract $185,057 in taxes for a tax rate of 42.4%. Over half of France’s inhabitants pay no income tax. 14% pay 30% for EUR26,792-71,826 band of income and only 1% pay the 45% rate, applicable to income above EUR151,108. There is a 66% credit (up to 20% of income) for charitable giving which greatly reduced the tax liability in the Obama’s case.

Canada is not far behind, but remember this analysis is for the 2015 tax year. The new Liberal government has raised taxes on the wealthy, defined as those making > C$200,000 (US$155,083) by 4% to 33% (Federal). Provincial taxes are high in Canada as well, with Ontario’s highest rate at 13.16%. Assuming the Obama’s hung their touques in Toronto, the tax bill would be US$165,179, for a tax rate of 37.9%, again tempered by the charitable donation of C$82.560. The top marginal tax rate in Ontario for taxpayers making > $200,000 for the 2016 taxation year is 53.53%.

-1x-1

United Kingdom, sunny London of course. The tax bill would be US$181,470 for a tax rate of 41.6%.

Singapore, Republic of Singapore. With no charitable deduction, the Obama’s tax bill for 2015 would have been US$71,293 or 16.3%, but a generous incentive program was in place for charitable giving in 2015, Singapore’s 50 year Anniversary year. The amount of the qualifying gift is grossed up by a factor of 300% for 2015 donations (normally 250% through 2018) which would have resulted in the Obama’s tax bill being $32,893, for a 7.5% tax rate (lower than NJ State tax for reference).

The US Federal tax code stands at 74,608 pages, by far the most complex of the countries mentioned. The average tax prep cost in 2014 was $273. The cost for all parties, including collection (IRS) calls for simplification of the tax code.

While a progressive tax system on balance makes the most sense globally, for developed economies, there are limits to the tax freight paid by the 1%. It is difficult to determine the exact breaking point, but when it comes, the golden goose can take to the skies for friendlier climes through both legal means (relocation) and via “structuring solutions” mired in the complexity of global tax policy (Mossack Fonseca et al). JCG

Note: The charitable laws of the US and of other nations reflect the notion of territoriality or the restriction of tax relief to those charitable contributions made only to domestic charities.

FX rates used; USD/CAD 1.29, USD/SGD 1.36, GBP/USD 1.42, EUR/USD 1.128.

Comments »

O’ CANADA – WE’RE GOING TO NEED A BIGGER GUN

As has been well chronicled on this web site, all is not well with the commodity complex. For a wealthy, developed nation Canada has a heavy reliance on primary industry. Canada is one of the few remaining AAA rated sovereigns credits. Canada is a 1st world country with a 3rd world currency. Much has to do with the high correlation with oil, it has always been high at 0.80, but has been running at 0.94 of late.

Combined, the Oil & Gas and Mining & Metals sectors make up 35% of the stock market in Canada, versus 16% in the US. Both Canada’s population and economy are about 1/10th of the US (34.75mm & $1.5tln respectively) and trade flows run predominantly North/South, 73% of exports and 63% of imports are with Uncle Sam.

“Just Like The States” is a compliment old timers still use for a job well done and approx. 85% of Canada’s 34.75mm people live within 100 miles (165 km for the bulk of the world on the metric system) of the US border. Canada’s unemployment rate stands at 7% (all US states are below 7% with the whole a low 5 handle) yet there is a high degree of regional disparity, with some in the double digits. There are only 4 cities in Canada with populations >1mm (Toronto, Vancouver, Calgary and Montreal).

Energy in the form of oil, primarily from Alberta (oil sands), Newfoundland (offshore), and Quebec (hydroelectric) along with metals, agricultural products, and forest products make up over 58% of exports. Autos, machinery and equipment make up 38%. Exports make up approx. 32% of GDP

The oil downdraft has had the largest effect on Alberta and the situation is not likely to improve in the near term. Much of the pipeline infrastructure focus has been on southbound KeyStone XL – Stage 4 which has been blocked by Obama (will Trump want naming rights to approve?). Part of the solution to the oil conundrum will be improving the mobility of trade across Provincial borders, with the added advantage of being able to settle in Canadian dollars. Justin Trudeau has arrived in the Prime Minister role (centerfold actually), bringing the Liberal party back to power with great fanfare and has promised spending of C$60bln over 10 years on infrastructure, with a front-end weighting. A portion of the infrastructure spend with likely be on critical intra-Canada linkages. While there are less viable road and rail options for this purpose, the Energy East pipeline and Trans Mountain pipeline twinning project are the two major proposed pipeline projects taking Alberta oil both East and West (in higher volume) respectively. New environmental hurdles have raised questions about the governments support for the pipelines, but in the end they make too much economic sense to not advance. This improved infrastructure would reduce and potentially eliminate the reliance on imported oil, which costs Canada > $20bln per annum. Venezuela and Nigeria are both on the watch list for major civil unrest in 2016, largely due to the swoon in oil prices. Canada also imports oil from the US (roughly 1/2 of the 630k bbl per day imported versus Canada’s 2.7mm bbl a day habit), Norway and the UK. Azerbaijan, requesting $4bln in aid this week is the canary in the oil well. Brazil and South Africa (who just hikes short rates by 50bp to 6.75% yesterday to put a finger in the ZAR dyke yesterday), are also markets to watch for 2106.

The structural decline of the auto segment in Canada is a much tougher nut and there is almost no degree of currency depreciation that can bring production back above the 49th parallel. The first wave of market share losses were dolled out by manufacturers establishing non-union plants in the Southern US States. More recently, Mexico has been growing significantly, no longer hampered by a perceived product quality gap. Canada’s unit automobile production (centred in Ontario) is down to 2.3mm unit per annum which is 24% below peak levels (99′).

No export discussion can leave out China. The Chinese Renminbi broke into the top 5 payment currencies in 2015, displacing the Canadian Dollar (CAD) to 6th rank. China had held the Yuan (CNY) steady in the face of significant easing by most of its trading partners up until August 2015 and still gained 3% world export share (to 13% from 10%). Read: China does not need a cheaper currency to be competitive. On the capital flight question, how much would China have to devalue the currency by to dissuade those so inclined  from moving? A lot is the answer, hence the worries of a 10-15% de-valuation by China is overblown. There will likely be modest depreciation versus the USD going forward (inside of 5%), and relatively sanguine fluctuations should be expected versus a basket of their trading partners (which is PBOC’s eventual intent). China runs a very large current account surplus (2%+ of GDP on a US$10tln+ economy) and there will likely be a spike going forward as the rate of domestic investment will fall at a much faster pace than the savings rate falls. Flooding the global markets with industrial goods when protectionism is on the rise is not a formula for getting along, but get along we must.

Canada has a vast advantage over the US in two key areas. Corporate taxes are a full 13% lower than in the US. Canada has the most educated population in the OECD with 51% of adults aged 25-64 having finished post secondary education (OECD avg. 31%). Canada heavily subsidises education and the world class ranking of the top schools attracts many foreign students.

As a developed market, birth rates are modest at 1.6 children per woman (2.1 required for a stable population base), but Canada has a long standing immigration policy that ensures, at least from a demographic perspective, that Canada keeps growing. Immigration to Canada is 260,000 per year (US is 1mm, 10x would be 2.6mm), 0.74% of the country’s population per annum (10% of those in the refugee category, 7% for the US). Life expectancy in Canada is 81.24 years versus 78.74 for the USA.

Canada is the 11th largest economy in the world, representing 2.9% of world GDP. Canada is home to 68 of the top 2000 companies in the world, for a tie for 5th with France.

Last week CAD and SGD, the Singapore Dollar traded at parity for the first time in 21 years, at 1.43 per USD. The commodity super cycle took CAD/SGD to near 1.60 over that 2 decade + period.  Singapore has none of the resource riches that Canada boasts, yet is has largely through will, minimizing graft and superior execution created the largest financial centre in South East Asia. The parallels to North America are strong, Hong Kong is like New York, Singapore is like Toronto. Singapore is one of the largest shipping centres in the world, depending on metric of throughput or value Singapore is often #1 (currently #2 to Shanghai). Singapore recently displaced Tokyo as the 3rd largest global fx trading centre after London and New York. Singapore boast > 30,000 multinationals that run their regional treasury centres for Asia (and in many cases broadened to include Europe and MENA) from a Singapore base.

Faced with the opportunity Canada has at hand, Singapore would have a crack team of government officials on tactical missions to entice multinational firms to relocate to Canada. Based on corporate taxation differentials alone (-13%), tax inversions make abundant sense. The grass is greener on the other side largely because it is fertilized with bull*hit, but in Canada’s case, the merits are largely beyond assail. The cash laden US tech sector in particular would be fertile with targets to entice to Canada’s Silicon Valley, Kitchener-Waterloo, Ontario. EDC, The Export Development Corporation of Canada, an Agent  of her Majesty in right of Canada (AAA/Aaa) stands at the ready to insure global trade.

Resident of Canada’s largest cities (Vancouver & Toronto) are admittedly over their skis with respect to residential property valuation at present (by 20% at Fitch’s latest tally), but even a modicum of success in leading a migration north of corporate America would make it look dirt cheap 3-5 year out.

Why did the Canadian cross the road? Answer: To get to the middle. Trade accordingly. JCG

Note: Author is a Singapore based Canadian, originally hailing from Cape Breton, Nova Scotia. Follow me on Twitter @firehorsecaper


Comments »