Illinois:
As last outlined in 2017, the State of Illinois is insolvent with shrinking options to avoid filing Ch.9 (the section of the US bankruptcy code available to financially distressed municipalities). Illinois has a population of 12.7mm, making it the 6th most populous state after CA, TX, FL, NY and PA. The Il. population has fallen 6 years in a row as people flee the highest state & local tax burden in the country (yes even higher than the “left” coast CA).

Start here:
Without significant public employee pension reform, bankruptcy is a near certainly for the State of Illinois (18 mths – 2 years). As outlined below, pension reforms have been stymied to date, there is no credible case to throw good money after bad in Illinois.
The long required pension reforms are largely common sense; lower payout levels, paid later for those still working, no COLA until 90% funded status is achieved (+3% fixed per annum fixed currently), and gate the defined benefit plan for new workers who will receive comparable support in a defined contribution 401k like plan (like the bulk of the US working population). Pension reform is happening on a broad basis across the country, especially for new public sector employees, but Illinois legacy plans remain sacrosanct.
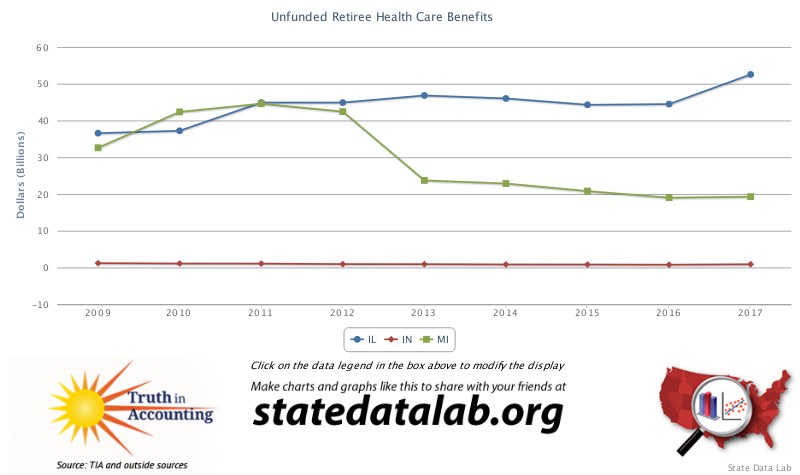
The average public pension funding level in the US was 70% as we entered 2020. Public pensions garnered positive returns in the last 6 months of 2019 of 6.1%, but have given back approximately 9% in the first 4 months of 2020 (The Year of the Rat, and the Bat bred COVID-19 coronavirus pandemic). The USA country-wide, (i.e. all states) pension shortfall stands at $4.1 trillion. Illinois has a current pension shortfall of $137 billion (against a current pension liability of $214 billion for a 36% “funded status). The rating agencies have acted accordingly, taking Illinois to the precipice of junk at Baa3/BBB- (negative outlook with both). Affordability of retirement programs remains a long terms source of municipal credit stress. Other post-employment benefits (OPEB) account for up to 28% of current unfunded pension liabilities, with the provision of healthcare coverage accounting the the lion’s share. Illinois has never reported their OPEB liability, but is expected to do so from 2020, according to the Governmental Accounting Standards Board. Given the generous public pensions in Illinois, their OPEB liability is 2x the national average on a per capita basis and is largely expected to take their total unfunded pension liability to $210 billion from the current $137 billion (+$73 billion, not “new” by any means, but recognized for the first time). This level of chicanery might be considered comedic to some, but to me it increased the inevitability of Illinois bankruptcy. Illinois have funded their OPEB liabilities at 0%, with 20 other US states in the same leaky boat.
As noted in my prior write-up municipal bond investors are a conservative lot. 2/3 invest via mutual fund and ETFs, rather than in individual bond issues. Some of these funds have strict investment guidelines to only hold investment grade bonds, leaving the municipal high yield space to specialists in that area. Little new money is getting put to work in Illinois municipal bonds given the perilous rating, sinkhole pension system, gross mis-management, rampant crime, bottom quartile education system and untenable tax burden at all levels. Most portfolio managers expect Illinois selling pressure as longs seek skinny exit doors on a loss of investment grade ratings.
The City of Chicago situation is even more dire, with the pension plans funded at 23%. The pension underfunding issue is serious in many states, but Illinois is a special case of financial co-morbidity. Illinois incorporated a pension protection clause in their constitution, going forward pension can not be “diminished or impaired”. Illinois pensioners have case law to back them up as well; in May 2015 the State Supreme Court rule unanimously ruled that no cuts to pension are possible, overturning a 2013 pension reform bill which planned to reduce pension costs by upwards of $160bln over 3 decades (i.e. they know what has to be done, but they can not do it, full stop). The other issue that has turbocharged the pension shortfall numbers is a “hard-wired” 3% increase in benefits per annum (this was approved in 19909), having the stand-alone effect of doubling the state pension liability every 25 years. Few will pity those pensioners found in harm’s way when the jig is up. The number of Illinois pensions with payouts > US$100,000 per annum have increased by 74% since 2015. It appears that from a base case of “zero pension” is the only viable starting place for Illinois, and this can only happen with a Ch.9 bankruptcy filing. Taking a quick look in the rear view mirror, in 2008 Illinois was rated Aa2/AA with a pension shortfall of $54.8bln (1.5x bigger in 2020, 12 years later).
Illinois has 5 discrete state pension systems:
Teachers’ Retirement System (TRS). The biggest covering teachers across Illinois (ex Chicago), 130,000 active members, 95,000 retirees (total membership 406,000). The largest pension in Illinois. $122 bln liability, 40% funded 2019.
State Employees Retirement System (SERS). 87,500 members. $47bln liab. 36% funded 2019.
State University Retirement System (SURS). 231,000 members. $42bln liab. 44% funded 2019.
Judges’ Retirement System (JRS). 972 members. $2,7bln liab. 36% funded 2019.
General Assembly Retirement System (GARP). 470 members. 371 million liab. 15% funded.
Illinois Municipal pension plans:
Illinois Municipal Retirement Fund (IMRF). The 2nd largest public pension plan in Illinois. 410,000 members. $44.5bln liab. 90% funded 2019.
Global pension asset stand at $46.7 trillion, approximately 52% of GDP. Asset allocation is fluid, but a snap-shot reflects 45% allocated to equities, 29% to fixed income, 12% to alternative investments and 3% in cash. Low interest rates and higher volatility in risk assets, such as equities, clearly increase the risk profile for public pension.
Global GDP stood at $88 trillion coming into 2020. The negative impact of COVID-19 is estimated to impact global GDP by -5.8 to -8.8 trillion in 2020 (-6.6 to -10% GDP) according to the latest estimates by the ADB this week.
Illinois Debt:
Illinois debt clock; https://www.usdebtclock.org/state-debt-clocks/state-of-illinois-debt-clock.html
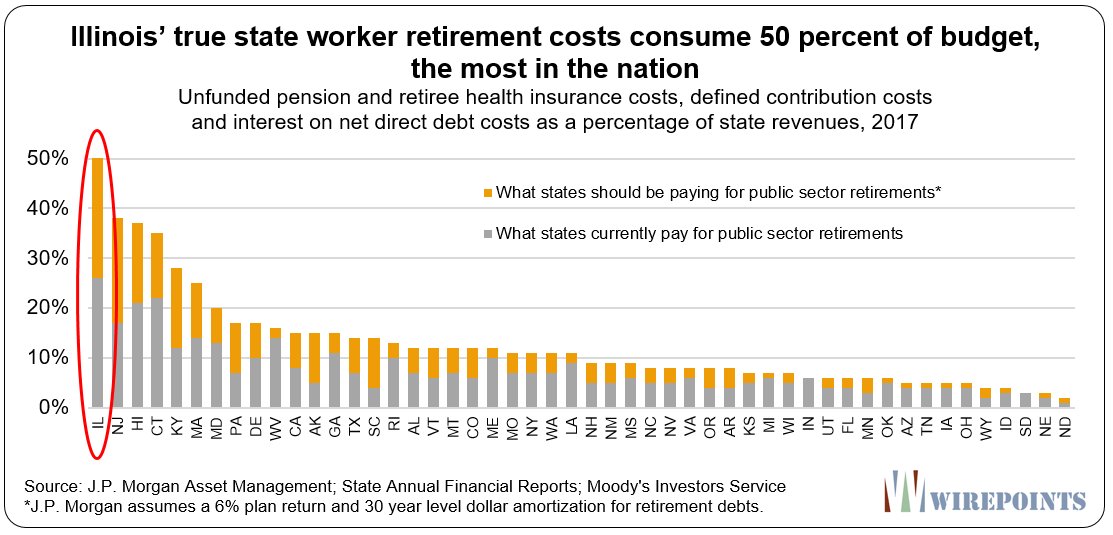
With $165 billion of General Obligation (GO) debt and a state GDP of $868 billion (1% of global GDP and 50% of Canada’s GDP), direct debt is optically manageable at 19% of GDP ($13k per resident). The 2nd layer of the onion lays bare the reality that Illinois is an ill-funded pension plan with a small state government attached. Of their annual budget, a full 25% is now consumed by pension servicing (the avg. of all states is 4%). Of the last $10bln contributed to the state pension, $4bln went toward new pension accruals (ARC, actuarially required contributions) and $6bln was expended for servicing. Illinois has issued $25.8bln of pension obligation bonds in aggregate, which are issued as taxable instruments. Illinois has more aggregate pension debt than 41 states. General obligation bonds are tax-exempt with respect to income tax (Federal for all, as well as state and local exempt for Illinois residents). Illinois recently (May 2020) issued $750 million in 2045 maturity GO’s that were 4x oversubscribed. The issue printed at 5.85% yield with reference 10 yr UST yielding 0.652%. With the top federal tax rate at 37% this has a taxable equivalent basis yield of 9.28% (double digit yield for Illinois residents).
The yield on $HYD, the Market Vectors High Yield Muni ETF is 4.64%. $HYG, iShares High Yield Corp Bond ETF yields 5.56% presently ($15bln AUM). The largest investment grade municipal ETF is $MUB with $15bln AUM and it yields 2.39%. The grey-haired investors in muni bonds to date have preferred mutual funds to ETFs, as reflected in their assets under mgmt (AUM). The biggest, Vanguard’s Intermediate Term Tax Exempt Fund has $70bln in AUM, is flat over the last 12 months and yields 2.58%. Nuveen’s High Yield Municipal Bond Fund (18bln AUM) is -9.5% over the last 12 months and yields 5.62%.
![]()
Chapter 9:
Municipal bankruptcies are relatively rare. Defaults in the municipal space have largely been restricted to bespoke revenue bonds which rarely affect the upstream, ring-fenced GO issuer. Detroit filed Ch. 9 on 2013 with $18.5bln of debt, the largest default to that point in US municipal finance. Puerto Rico had $70bln of debt in their bankruptcy in 2016 (their pensions were funded in the mid teen’s at the time of tap out, 14% blended).
Illinois will be a different kettle of fish altogether, much bigger, more complex with more potential knock-on effects. An investment grade rating (just I might add, with a negative outlook by both agencies) is hardly warranted at this juncture and few portfolio managers would buy the credit in the perilous environment we find ourselves. Should Illinois file Ch. 9, the recovery rate would not be stellar (loss given default, LGD) as they have already been to the pawn shop and monetized what they can. Examples include revenue bond secured from everything from toll roads to tobacco settlements. Illinois has even gone so far as to sell their prisons to private operators.
Illinois pensioners might wager that they would be able to secure a higher recovery rate than general unsecured creditors (namely general obligation bond holders) as we saw in the Puerto Rico case, but the degree of “outperformance” might seem moot when GO bond holders get 50¢/$1 and pensioner get 55¢/$1.
COVID-19:
Of the 4,058 COVID-19 deaths reported thus far in Illinois, a full 50% have been nursing home residents. This theme has been prevalent across the country, and the world. Japan’s population is 10x bigger than Illinois at 128 million yet COVID-19 deaths stand at 725 (yes, seven hundred and twenty-five). To have a comparable case fatality rate (CFR) experience, Illinois would have 73 deaths (roughly equiv. to two month of gang violence in Chicago). Japan has an older demographic than any country in the world. Rather than effect a hard lock-down, Japan has chosen a “cluster” C-19 treatment approach. Some credit has been given to universal BGC vaccinations (for TB) and that the COVID19 strain in evident in Asia appears less virulent, but all remain perplexed at the marked CFR discrepancies between countries. Notably, rates of obesity in Japan are 4.3% versus 36% for the USA and in the “at risk” demographic of 65+ I would argue the obesity rates in Japan are below the 4% average. I’m not a Doctor, this will be a subject of great debate and study as well navigate the “new normal” in 2H 2020 and beyond.

Illinois residents, save essential services, have been largely home bound since March 7th (Shelter-in-place order remains in effect). Government spending, esp. for healthcare have skyrocketed while sale tax revenue have plummeted (state income taxes to follow). Illinois, via Senate President Don Harmon has requested a $41.6 billion bail-out from the federal government (largest items include $14bln to close the state revenue shortfall, $9.6bln to aid Illinois cities, $6bln for the unemployment trust fund aid and $10bln for “kick the can”pension servicing.
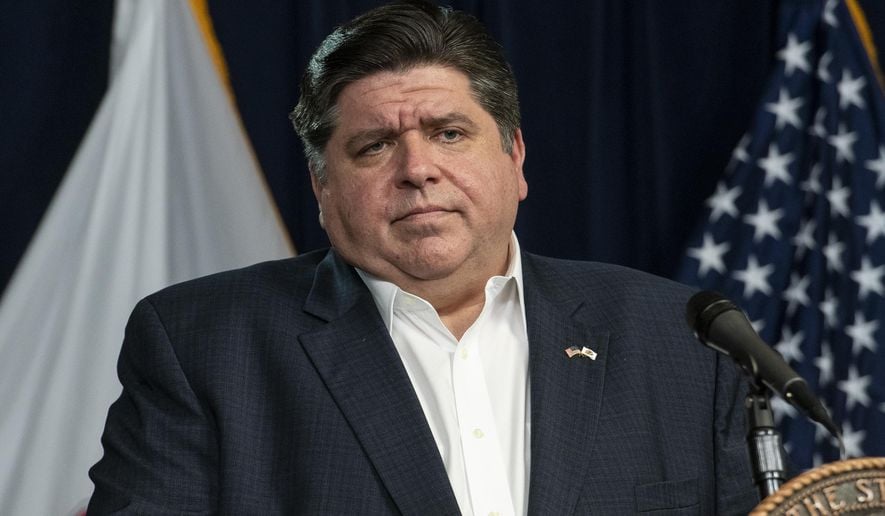
Pictured: Illinois Governor Pritzker continues to press that the Illinois remain effectively closed until the novel coronavirus is all but defeated (BMI undisclosed, seems high).
Senator Majority Leader Mitch McConnell has been vocal in pushing for the bankruptcy route for failing states, rather than kitchen sinking state pension bail-out in future COVID-19 relief bills. Mitch’s home state of Kentucky makes Illinois look financially prudent with the worst funded pension of the contiguous states with a laughable 16% funded rate. Kentucky is gracefully a small state in terms of significance and the unfunded pension liability is $36bln in absolute terms, a paltry 26% of Illinois $137bln shortfall (Puerto Rico was blended at about 14% across their 4 plans when they tapped out, for reference).
Public sector employment in the US averages 14.5% (State & local government employs 20 million in the USA). The 30 million currently filing for unemployment claims are largely from the private sector with a heavy weighting in the food & beverage, entertainment, transport and hotel sectors. None of the hundreds of thousands of Illinois public sector workers have been furloughed and the pension benefits continue to grow at a factor of 1.03 per annum.
14% or 1.8 million Illinois residents collected food stamps in 2019.
The latest government largess proposal, the $3 trillion HEROS Act, approved by the House of Representative last week, includes sweeping support for a pension plan bail-out via Division D, Title I, the Emergency Pension Plan Relief Act of 2020 (there are no benefit cuts proposed in the formula, big surprise). There are very long odds on this bill garnering broader support in its current form (as in ZEROS, a more appropriate bill name than the flag-wrapped swill the lobby groups try to pass off as 1st growth wine).
The Federal Reserve balance sheet has gone from $2.7 trillion to $7 trillion with remarkable speed (quantitative tightening to quantitative easing infinity). Monetary policy (short rates) went from the early innings of a tightening cycle in late 2019 (2.25% Fed funds) to zero inside of 6 months. Unemployment went from record lows (full employment) to 15% (20% + if fully reported) over the same time sub 6 month period.
Conclusion:
Is is premature to think we are “out of the woods” and the global municipal finance implications have not been fully vetted , let alone understood and absorbed. Those modeling “cliff risk” should have a delta of > 0.7 assigned to a State of Illinois default on an 18 month timeframe. EM will have more than enough fireworks as well, but I see Illinois as the “big 1” in the US municipal market. China’s lack of access to USD swap lines mean that devaluing the Yuan ($CNY) is their only near term course of action. The word for 2021 in global municipal finance will be austerity. MMT is poppycock. The near term demon to be slain is deflation. The only trade I like for more than 5 trading days is short the € versus the USD.
There is not enough yield pick up to venture into IG (taxable or tax-exempt), let alone HY, even with the goosing the Fed has effected with their announced and recently under taken HY ETF purchase program. A municipal credit support program is in the works, 100%. The last highly effective program for munis was the Build America Bond (BAB) program which, while limited in size and tenure ($147bln 2008-2012), the program had the desired effect of bringing in muni credit spreads, flattening the muni credit curve and providing funding to liquidity starved sectors of the muni market (healthcare/acute care in particular). The follow-on program linked to an infrastructure build out, America Fast Forward (AFF) never came to fruition, but most, including the writer, believe that infrastructure will be the next and on-going focus.
Trade safely. Cash is a viable investment alternative.
Follow me on twitter @firehorsecaper
Regards,
Caleb Gibbons, CFA, FRM
Comments »