“It has been awhile since I have posted on the web and thought this was an appropriate article to share. This article focuses on technical analysis of 3 currencies and the US Dollar Index. A lot of the technical indicators I follow are universal, but the way in which they are modified and put together will not be found anywhere else. Developing the Contracting Fibonacci Spiral and the inverse chiral inversion that happened last summer have played a role in the forecast of this article. As unbelievable as the forecast may seem by time the end of this article, there is a significant amount of logic that went into this and may even defy logic. There is a mathematical basis to this pattern and hopefully it will be understood somewhat by the end of this article.
The US Dollar Index has changed its pattern and has confirmed a number of trends discussed over the past few months. I have spent a lot of time reviewing the US Dollar Index this weekend, due to it remaining under pressure and failing to break higher. The Elliott Wave pattern I was following had the longer term pattern fail due to not breaking higher…This has repercussions for everything.
For one, gold and silver are likely to remain in an uptrend for longer than anyone may think…the last update I stated suggested 2-3 months…this could extend into next year, depending upon how the downtrend of the US Dollar Index progresses. The HUI/Gold Ratio is in an uptrend, so holding or adding to precious metal positions is still in effect.
Oil is again over $100/barrel and if it closes above $101/barrel, then it is going to $111 within 6-8 weeks, followed by a move to $130-140/barrel within 8-12 months. Once oil closes above $101/barrel on a daily basis, oil is locked into an uptrend, which will drive energy stocks higher. Conservative investors should look to enter positions once this trigger becomes activated.
Also, I have been thinking more about what the Chiral Inversion of the Contracting Fibonacci Spiral and what that means. From everything what I can fathom at this point in time, things are going to really move higher between now and Q2-Q3 2015. The CFS had a series of higher lows from 1932 until 2013, which had a series of higher lows. The chiral inversion of the CFS that happened last summer implied a reversal to this trend. A cycle low is expected sometime between Q2-Q3 2016 and suggests a series of lower highs from 2016 until 2020. The following time points are required to complete the CFS sequence after 2016: 2, 1 and 1. Two years after 2016 is 2018, which is the next expected cycle low, followed by 2019 and 2020. The 2020 low should mirror of the amount of time taken for the 2019 leg. As we reach the point of singularity in 2020, the volatility of the cycle will only increase.
So, going short at the right point in time during 2015 will be critical, because between now and then, many people are going to get burned and will not even want to try shorting anything again. At the 2016 bottom there should be a very powerful rally that lasts into 2017/early 2018, followed by another crash into mid to late 2018. Knowing the information above is going to be very critical, because a lot of money will either be made, or lost during this period of time.
I have a lot of updates to do this week to get back on track after spending too much time on this side analysis and thought process for how things unfold, but viewed this as a more important step. It is important to anticipate the hypothesis and continue to alter it and make the required changes to fit the model as time progresses. This is what Science is about…forming thoughts around a number of observations and extrapolating the thought into abstract form to model future experimentation. In our case, the field testing of our hypothesis is the market and because time only travels in one direction, we can not repeat the experiment. We can look back at history, but alas, it too only has one path.
One final thought…if the US Dollar Index is going to go down, then commodities are going to rise, which should in turn raise the value of the Canadian and Australian currencies going forward. It appears that Q2-Q3 2015 is going to represent the cycle low for the US Dollar, which should rise during the deflationary bought expected after this point in time.
Based upon this analysis, a list of gold and silver stocks to consider will be posted this week. Hint…most of these are one’s that I have covered in the past, but a few new one’s will be discussed over the coming week’s.
Currencies
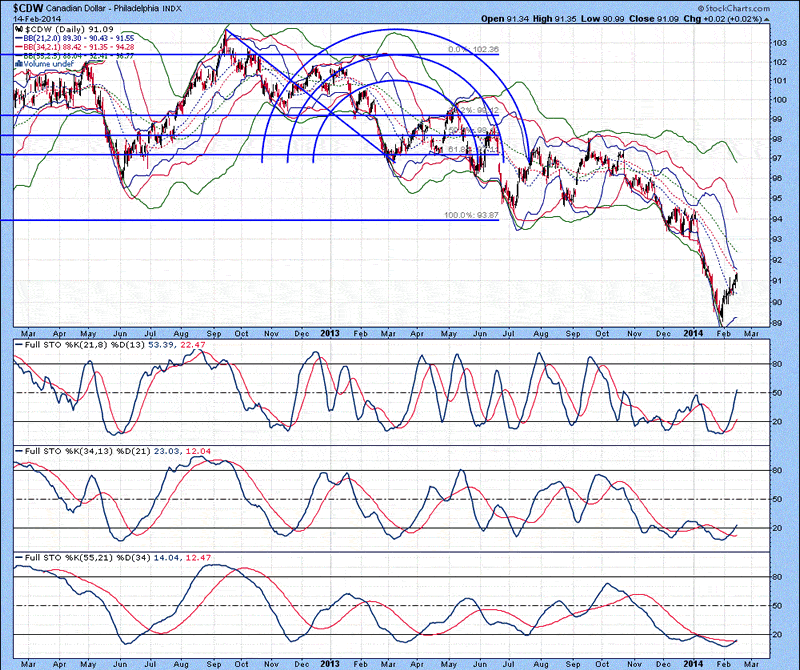
The daily chart of the Canadian Dollar Index is shown below, with lower Bollinger bands beneath the current price, suggestive that a bottom was put in place. Full stochastics 1, 2 and 3 are shown below in order of descent, with the %K above the %D in all three instances. Extrapolation of the %K trend in stochastics 1 and 2 suggest at least another 2-3 weeks of further upside before a top is put in place. I will post the monthly chart of the Canadian Dollar Index next week, which suggests the upward trend could last into next year. The Canadian Dollar has been in a down trend for over 18 months, so a bounce is expected.
Figure 1
The daily chart of the US Dollar Index is shown below, with upper 21 and 34 MA Bollinger bands in close proximity to each other with rising stochastics, suggestive that further sideways to upward price action is likely. The lower 21 MA Bollinger band is beneath the 34 MA Bollinger band, suggestive that an oversold condition is developing. Full stochastics 1, 2 and 3 are shown below in order of descent, with the %K above the %D in all three instances. Extrapolation of the %K in stochastics 1 and 2 suggest at least another 2-3 weeks of further upward price action before a top is put in place. There is a noticeable positive divergence between stochastics 1 and 2 relative to the price action of the Aussie dollar, suggestive that further upward price action is pending.
Figure 2…..”
If you enjoy the content at iBankCoin, please follow us on Twitter

