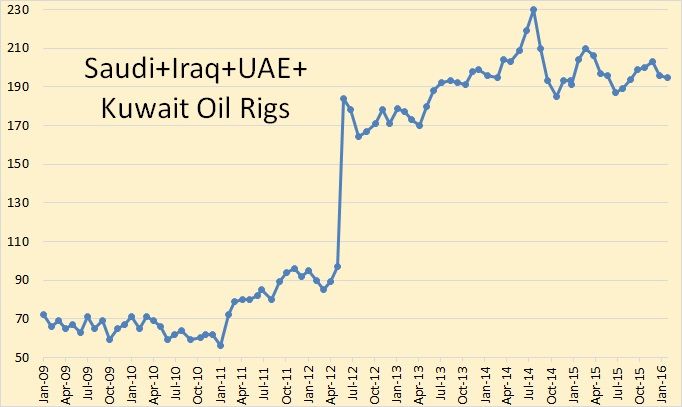
The U.S. rig count has now fallen in 15 of the past 16 weeks. As U.S. oil production gets cut to ribbons, middle eastern and OPEC oil production remain robust. While U.S. rig counts have dropped by a staggering 57% from last year, Middle Eastern rig counts remain at record highs. How is this possible?
The House of Saud has a lower cost of production and the state is actively supporting its sole industry, while America is more than comfortable to see its crown jewels wither away–without trying to protect this vital industry.
That being said, crude is higher by 5.5% and oil stocks are surging.
Nothing unfair about this. If you’re a driller in N. Dakota, simply move your family to the middled east and slap a hajib onto your wife and daugter’s and find good work over there.
If you enjoy the content at iBankCoin, please follow us on Twitter


What is up with the 1-month doubling in Middle-East rig counts (Apr 2012)? It completely wrecks the data
Fly, can you confirm that the Middle East chart is correct?
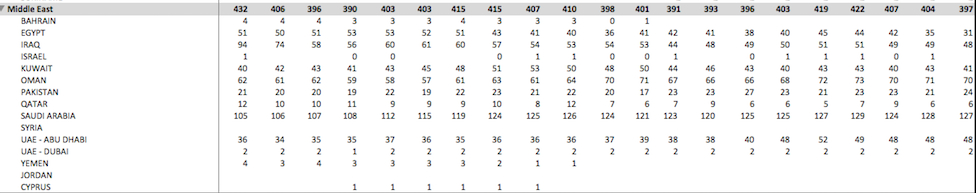
On your Table:
Min(kuwait) = 40
Min(Saudi) = 105
Min(UAE) = 34
Min(Iraq) = 44
so the Chart should be above 223 throughout the time period represented by the Table data shown
The April 2012 is fukado.
However the general thrust of the graph remains relevant.
It’s a bad idea to trust a chart when you can’t explain an anomaly like that. You didn’t trust Moody’s chart on Oil Losses, did you?
Also the table doesn’t match the chart. Assuming most recent data is on the left column), it also tells a dfifferent story:
Suadi Arabia and UAE have reduced rig count
Kuwait first increased and then reduced rig count
Iraq and Egypt (coming back from disruptions) have increased rig count