iBankCoin
Joined Nov 11, 2007
1,458 Blog Posts

Reader Request: INP

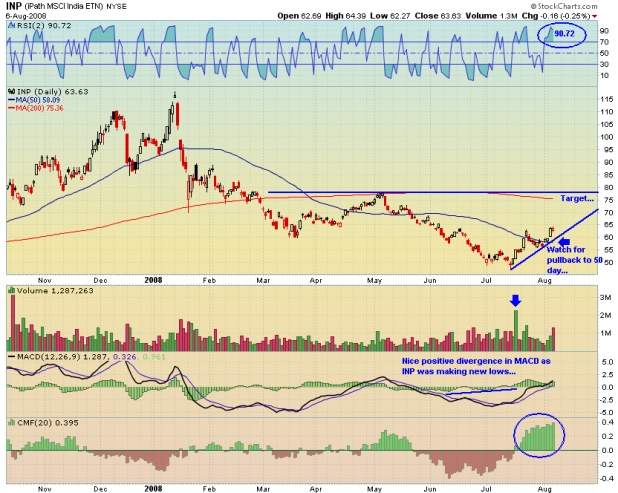
Buylo got long the India ETN [[INP]] and asked for some analysis.

Overall, INP looks like it has put in an intermediate term bottom. If I were long here, I would be looking for the run to continue to $75, where I would want to take some or all of my profits. I believe INP will encounter resistance at the 200 day.

Before I would buy INP here, I want to see a pullback, possibly to as low as the 50 day average at $58.00. At the very least, I want to see some of the overbought worked off the RSI2 before buying.

Note the bullish divergence in the MACD in June and July. That is one of the best ways to use the MACD, in my opinion. Also note the great volume at the bottom, the huge money flow, and the series of higher highs and higher lows.

Comments »

The Daily Breakout

Stocks continue to breakout from strong bases.

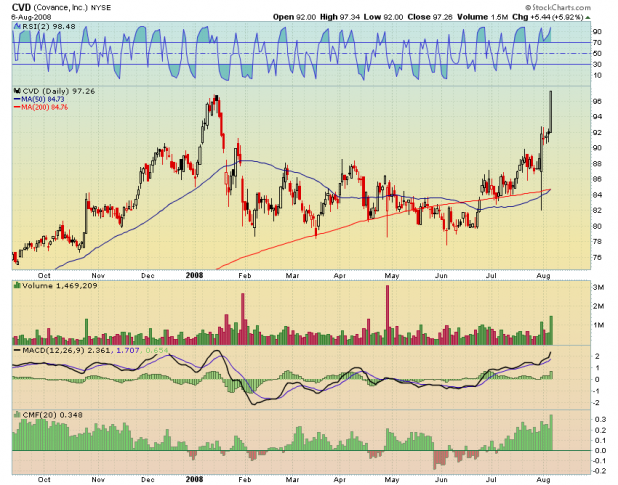
Covance Inc. [[CVD]] This one has been a good winner for me, as I have been long it since $88.30. Phil from Brazil initially brought it to my attention, and then it showed up on another screen. Now, CVD has begun to show up on ATR breakout and momo screens.

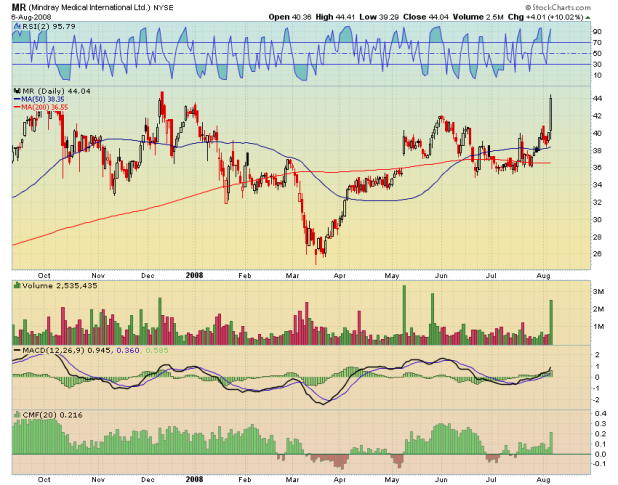
Mindray Medical International Limited [[MR]] Great volume on this move. Above $44.00 and MR will have cleared an 11 month base.

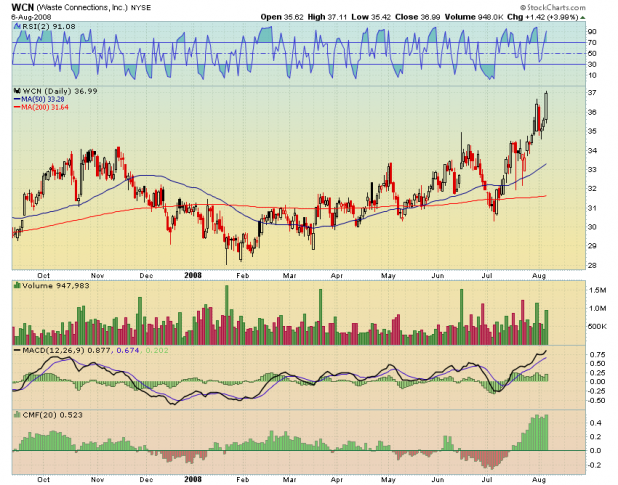
Waste Connections, Inc. [[WCN]] Very pretty cup with handle here. Truly, trash is rising to the top.

Comments »

The Daily Breakout: Killin’ It

Certainly was a great day for new breakouts. I may have to sell some of my laggard breakouts from a couple of weeks ago and add a few of these.

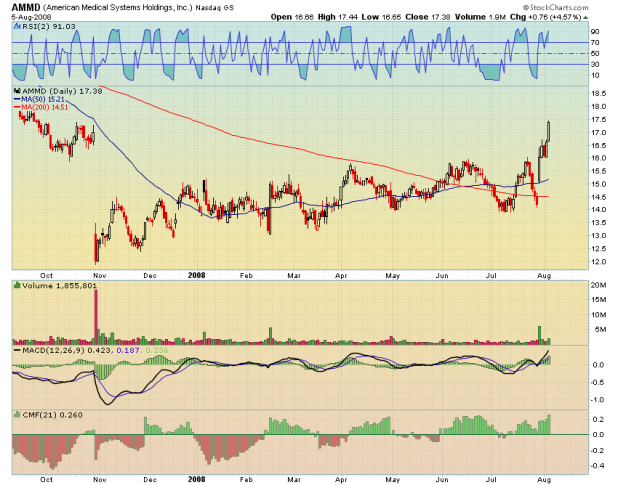
American Medical Systems Holdings, Inc. [[AMMD]] Unless you’ve been visiting Mars, you know this sector is HOT.

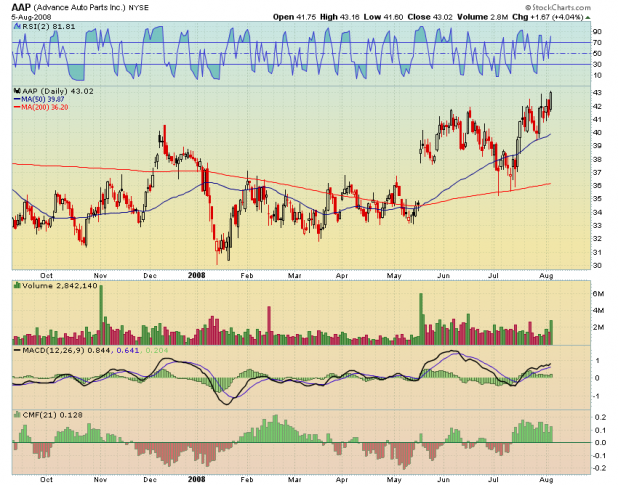
Advance Auto Parts, Inc. [[AAP]] Nice test of the May breakout level, and a recent test of the 50 day.

China Medical Technologies, Inc. (ADR) [[CMED]] I included this one as it did breakout today, although the chart ain’t so purty. Also, Cajun and Phil like it. As you know, hot sector.

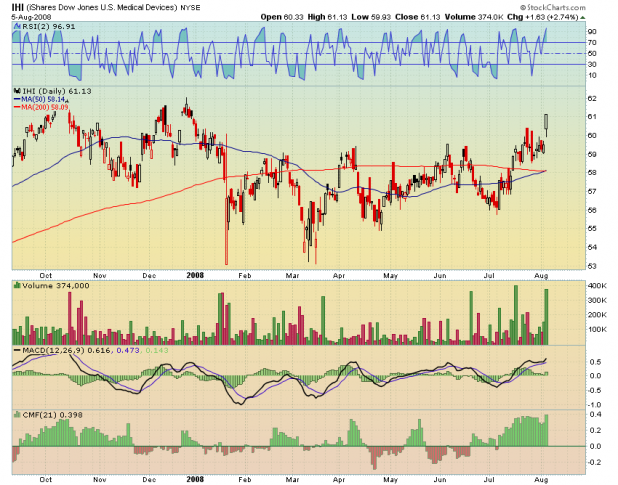
[[IHI]] I wish I would have known 2 weeks ago about this ETF.

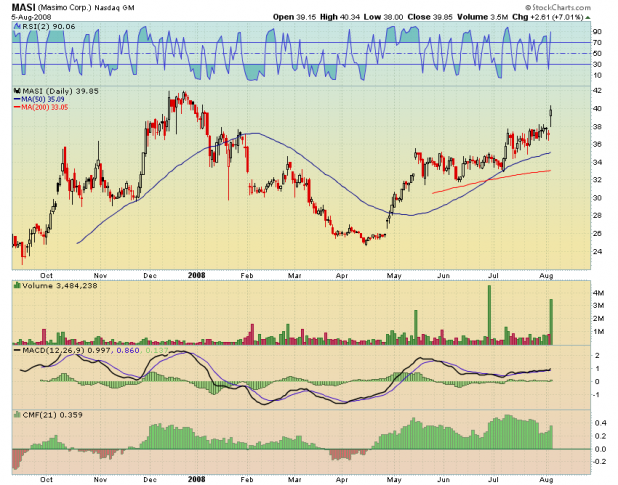
[[MASI]] reported tonight. Looks like the beat and raised. Definitely one to keep an eye on. Again, hot sector…Masimo Corporation engages in the development, licensing, and marketing of advanced signal processing technologies and products for the noninvasive monitoring of vital signs.

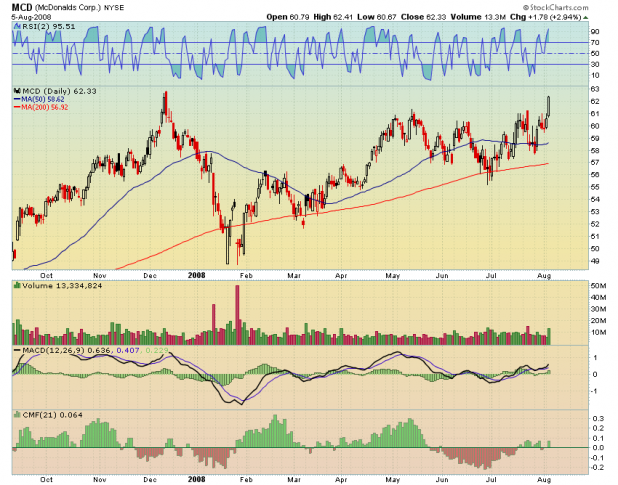
[[MCD]] All you skinny bitches out there need to go eat couple of fucking cheesburgers. Period. Nice looking chart.

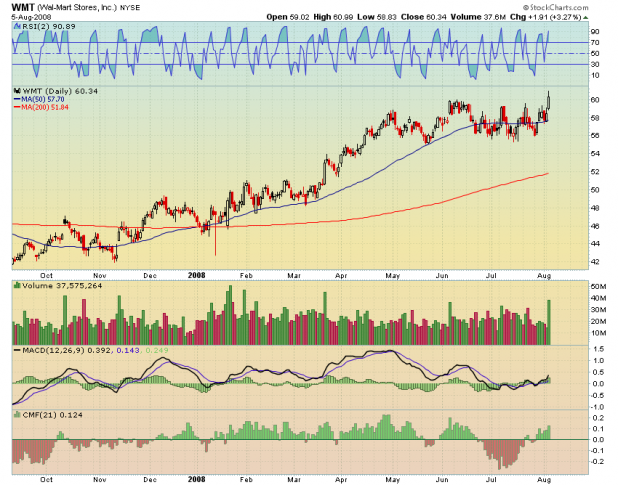
Wal-Mart Stores, Inc. [[WMT]] Gorgeous breakout. However, I’m not sure I can own WMT. I may give it some $$$ anyway.

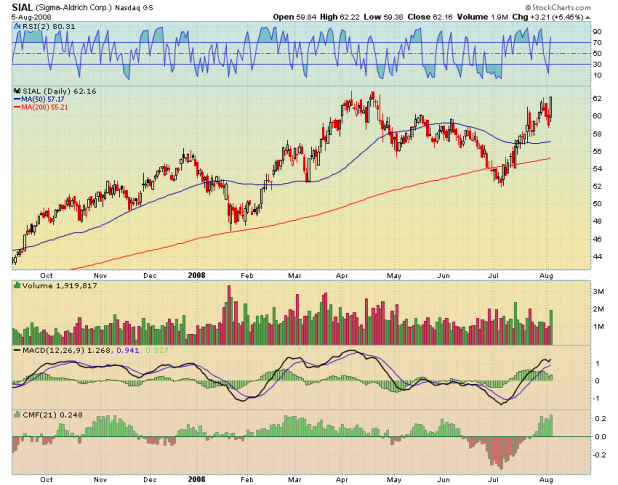
Sigma-Aldrich Corporation [[SIAL]] Another fantastic looking breakout.

Good luck out there folks. Remember, use larger stops, and buy smaller positions.

Comments »

Technical Analysis of the S&P 500 SPDRs

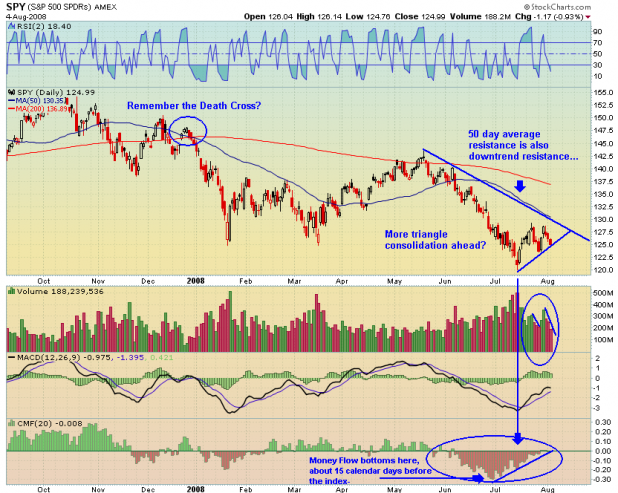
When I look at the last 11 months of downtrend on the [[SPY]] , it looks like a down trend that is not even thinking about putting in a bottom.

Notice the Death Cross, which occurred back in December. Two great posts I wrote about the event are Bulls Get Banded, and The Death Cross. Both of these posts have comments sections that are rich, with my favorite featuring the triumph of my Technical Analysis Machine over Fly’s time macheene. Its all there, from 8 months ago. Check it out.

Anyway, so yeah, the SPY is in a long downtrend, with what looks like another triangle consolidation forming. I guess the easy bet is that it breaks down from this pattern for new lows. Back in February, I wrote an article about the triangles that were forming then: Triangles Developing: Nasdaq, Dow, and SPY. Be sure to read the last paragraph of the article for yet another triumph of the Technical Analysis Machine.

In the above chart, a couple of items to note:

The volume has been higher on moves up and lower on pullbacks, since July’s low. Also, the SPY is still above a near-term uptrend line, and has not yet made a lower high, or lower low.

Also, I’ve never tested the Chaikin Money Flow, so I don’t really know if it works or not, but I’ve been sort of watching it, as it might be a good complement to the RSI indicator. Read more about Chaikin Money Flow here: Chaikin Money Flow. What amazed me about the index between December and February was that the CMF was barely negative. Of course, in June, the CMF shows the bottom falling out. Also, I want to highlight the positive divergence between the CMF and price. The CMF bottoms a couple weeks before the SPY.

I’m still leaning long. I am looking for a trip to 130.00 on the SPY, or the 50 day average before re-evaluating. The market may have other plans, and if it does break down here, I will stop out of most of my breakout positions.

I apologize for the egregious use of the bold function. What can I say? I’ve been reading too much of Alpha.

Comments »

Strategy Trading Results, Since Inception

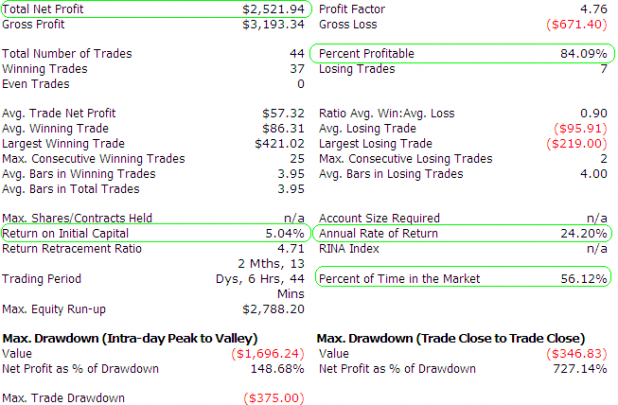
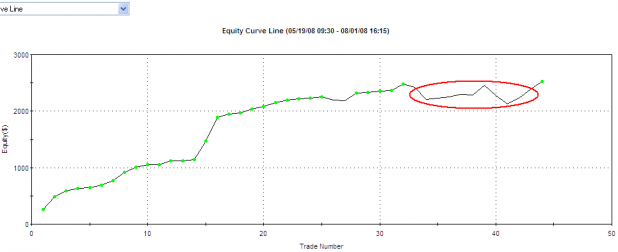
Above are the results since inception of May 19, 2008, from the mean reversion strategy (RSI2).

The strategy is holding one position, which is marked to market, in the above results.

I have still not had the entire equity allotted to this strategy in the market. The cash is available for positions at least 2x larger than what these results reflect. I am getting more and more comfortable with the system with every new trade, and it is getting to be more automatic. Before 2008 ends, I want to go a little bigger with my positions. Common sense tells me that my returns will be twice what is reflected above, but that will remain to be seen, as changes in position size affect psychology. The hardest part of system trading is managing my psychology.

The circled area on the equity curve reflects the last days of June and the first half of July, when the indexes were moving downward, with very few spikes up or down.

This system likes trending conditions, if they have regular counter-trend moves. As long as there are swings, it is happy.

The green dot means that the account closed today at a new high. I’m hoping this means the near-term market conditions are changing to be more favorable for this type of strategy. Months like January and June will result in drawdowns or flat results.

Comments »

The Daily Breakout

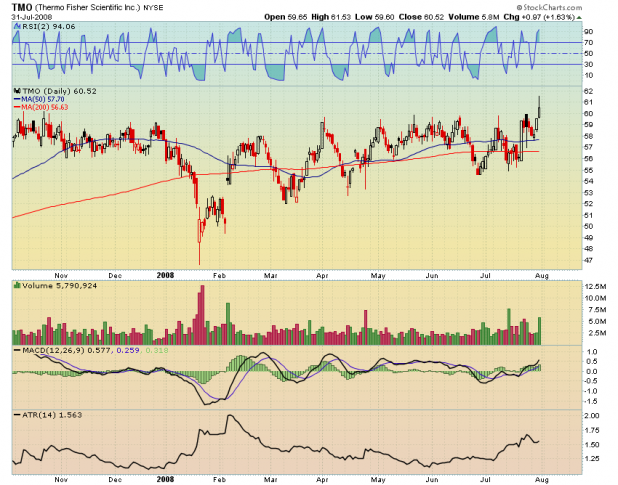
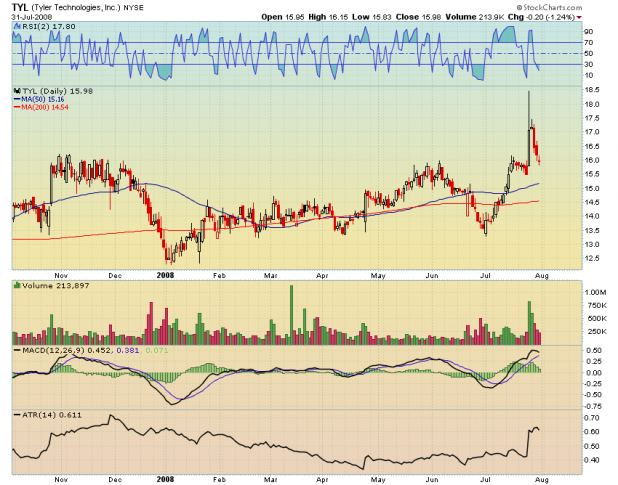
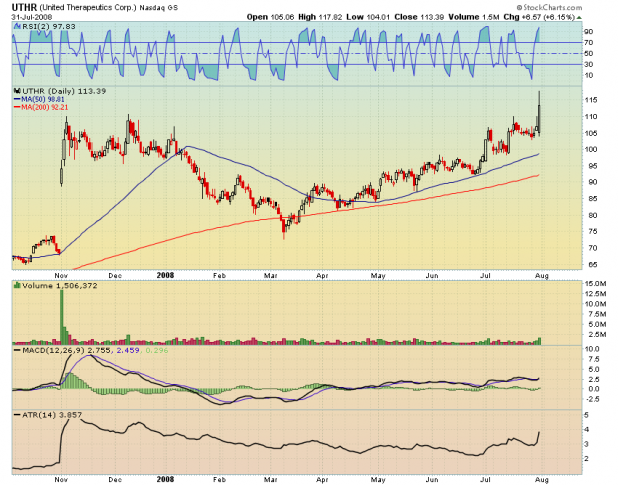
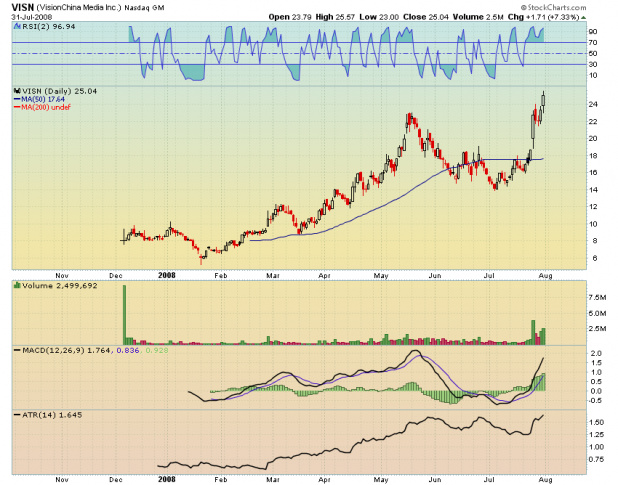
***Breaking News*** More breakouts today than in several weeks. These are moves from sound bases. The majority of breakouts from the last couple weeks have been holding above their pivot points. It is hard to be bearish when breakouts are working.

Note that a few of these breakouts were brought to your attention by fellow iBC bloggers, several days before they broke out.

[[CVD]] Covance Inc. Thanks to Phil from Brazil for bringing this chart pattern to my attention a couple of weeks or so ago.

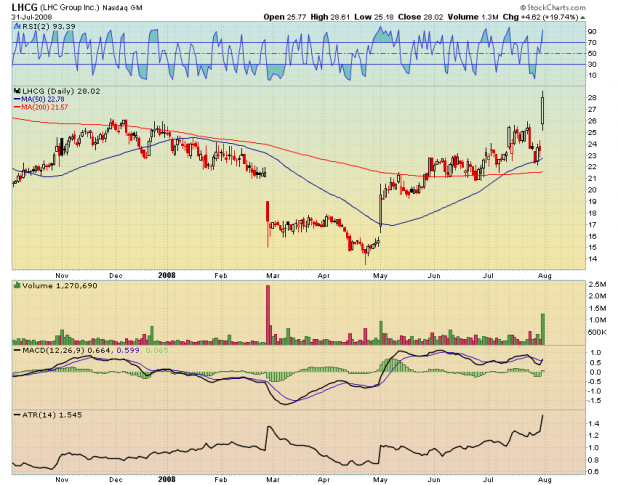
[[LHCG]] LHC Group, Inc.

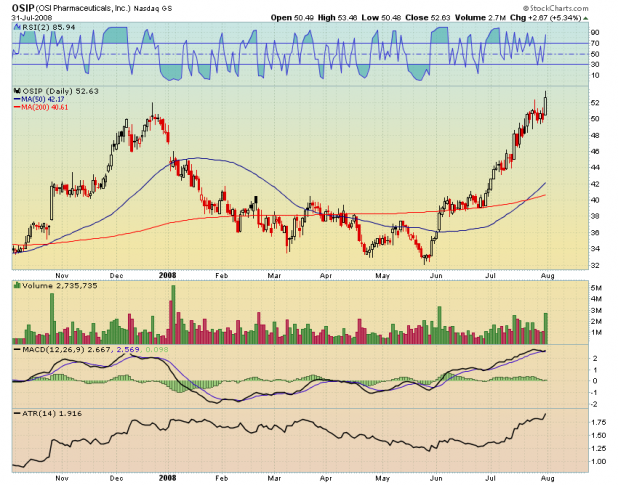
[[OSIP]] OSI Pharmaceuticals, Inc. Personally, I couldn’t bring myself to buy this one. However, its been a blast to watch and think, “What if?”

[[PBE]] Biotech. Duh.

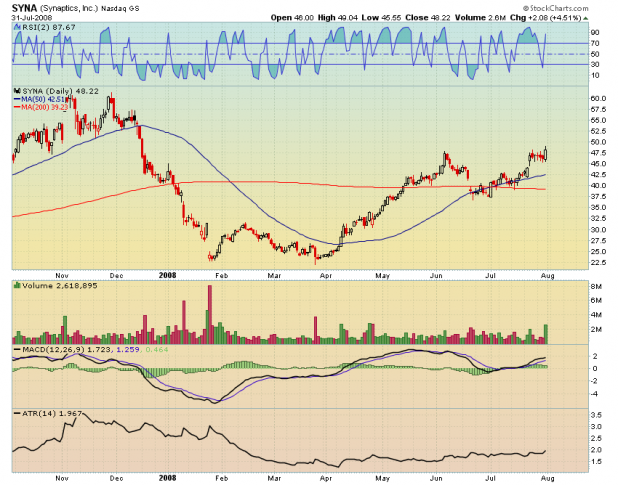
[[SYNA]] Synaptics, Incorporated This one is a personal favorite for the next few weeks.

[[TMO]] Thermo Fisher Scientific Inc.

[[TYL]] Tyler Technologies, Inc. This is a good example of why you should be saving these breakouts and checking them every couple of days. Sometimes they pullback, perfectly, like this one. This is a money setup folks. If this retest fails, sell it.

[[UTHR]] United Therapeutics Corporation This one should not be a new name to you. It has been mentioned on this blog recently.

[[VISN]] VisionChina Media Inc A Cajun pick a few days ago.

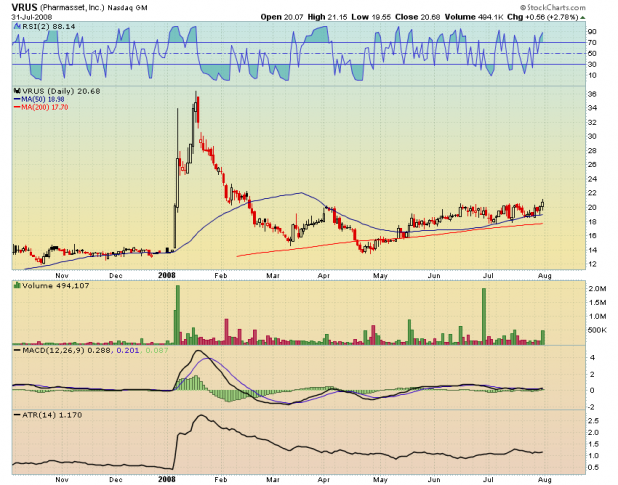
[[VRUS]] Pharmasset, Inc. This one was a Danny pick just recently.

Comments »